Committee of the Whole/Documents/BC Society for the Prevention of Cruelty to Animals Statement of Operations - Wild ARC
Appendix
BC Society for the Prevention of Cruelty to Animals Statement of Operations - Wild ARC
March 11, 2013Pages 16–171 section
Financial statement of operations for the Wild ARC branch of the BC SPCA for 2011 and 2012.
2012 Year-to-date total revenue: $583,8792012 Year-to-date net surplus: $43,013
BC Society for the Prevention of Cruelty to Animals
Statement of Operations
315 - Wild Arc
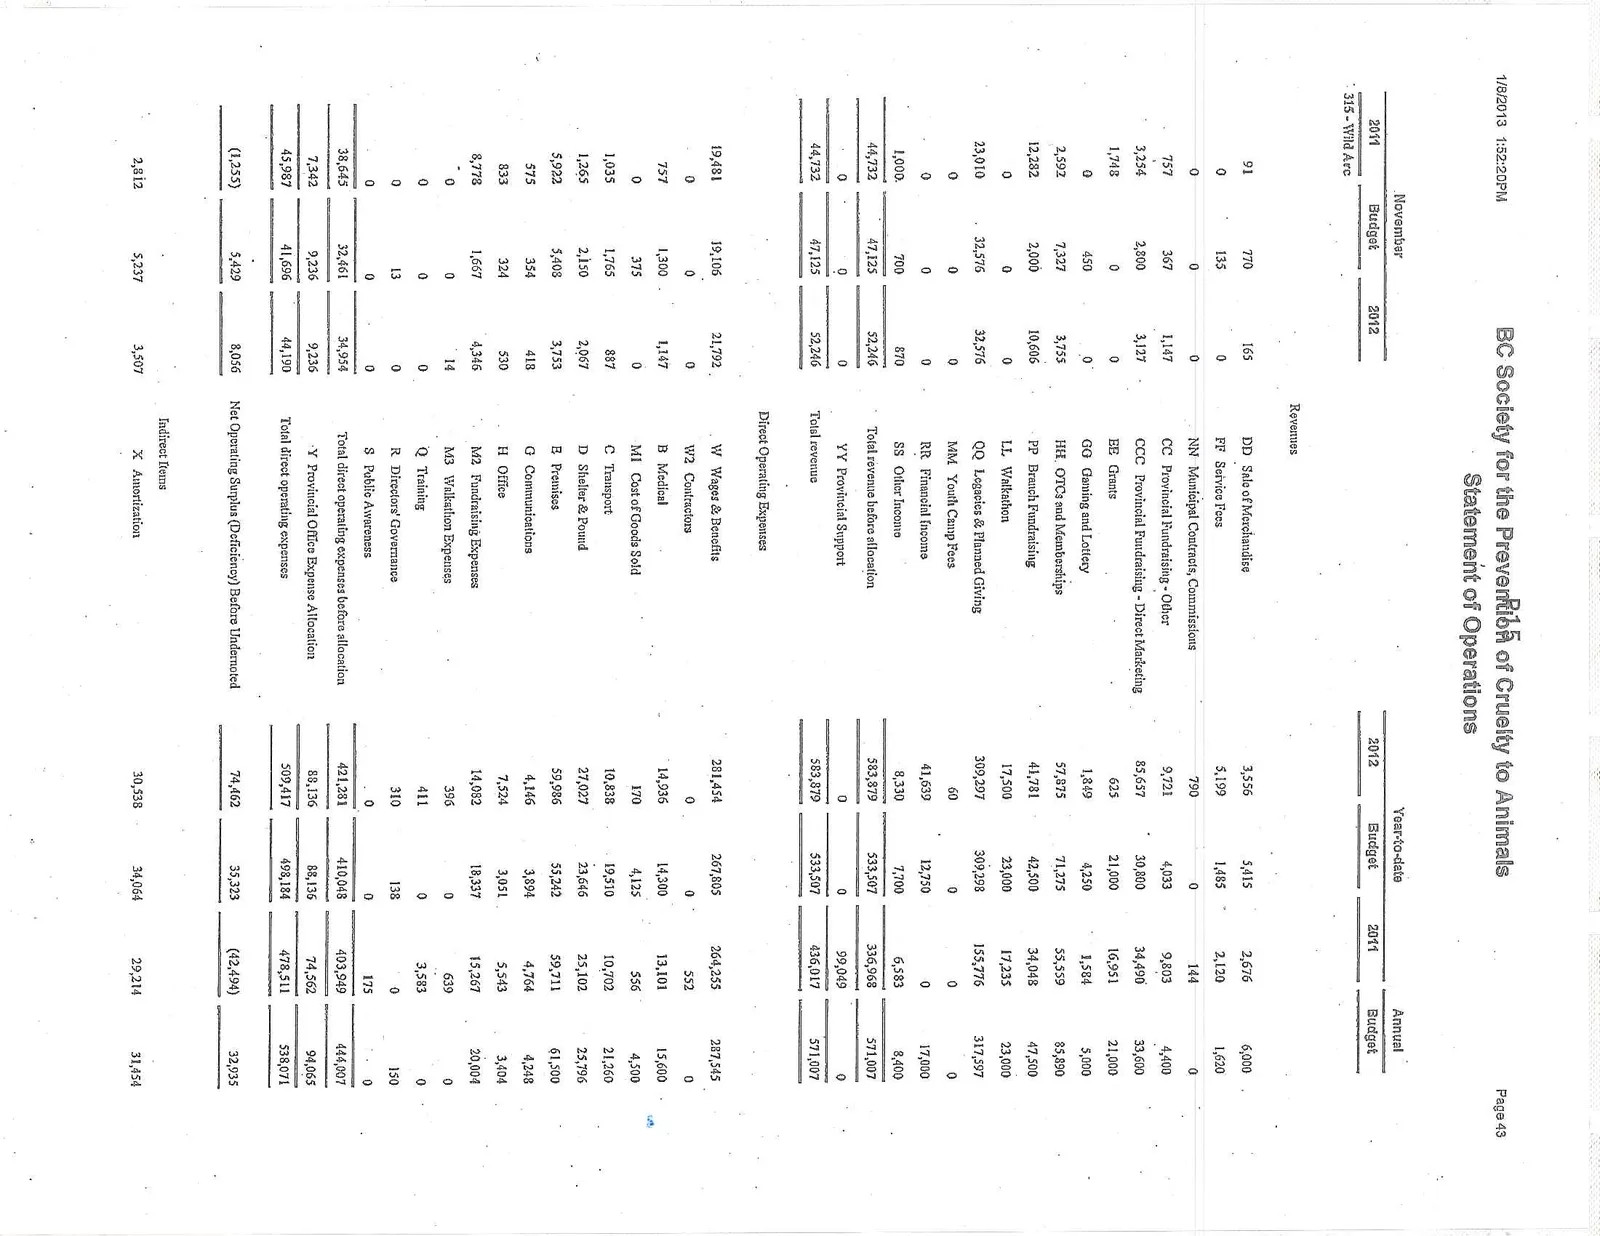
Revenues
| Description | November 2011 | November Budget | November 2012 | Year-to-date 2012 | Year-to-date Budget | Year-to-date 2011 | Annual Budget |
|---|---|---|---|---|---|---|---|
| DD Sale of Merchandise | 91 | 770 | 165 | 3,556 | 5,415 | 2,676 | 6,000 |
| FF Service Fees | 0 | 135 | 0 | 5,199 | 1,485 | 2,120 | 1,620 |
| NN Municipal Contracts, Commissions | 0 | 0 | 0 | 790 | 0 | 144 | 0 |
| CC Provincial Fundraising - Other | 757 | 367 | 1,147 | 9,721 | 4,033 | 9,803 | 4,400 |
| CCC Provincial Fundraising - Direct Marketing | 3,254 | 2,800 | 3,127 | 85,657 | 30,800 | 34,490 | 33,600 |
| EE Grants | 1,748 | 0 | 0 | 625 | 21,000 | 16,951 | 21,000 |
| GG Gaming and Lottery | 0 | 450 | 0 | 1,849 | 4,250 | 1,584 | 5,000 |
| HH OTCs and Memberships | 2,592 | 7,327 | 3,755 | 57,875 | 71,275 | 55,559 | 85,890 |
| PP Branch Fundraising | 12,282 | 2,000 | 10,606 | 41,781 | 42,500 | 34,048 | 47,500 |
| LL Walkathon | 0 | 0 | 0 | 17,500 | 23,000 | 17,235 | 23,000 |
| QQ Legacies & Planned Giving | 23,010 | 32,576 | 32,576 | 309,297 | 309,298 | 155,776 | 317,597 |
| MM Youth Camp Fees | 0 | 0 | 0 | 60 | 0 | 0 | 0 |
| RR Financial Income | 0 | 0 | 0 | 41,639 | 12,750 | 0 | 17,000 |
| SS Other Income | 1,000 | 700 | 870 | 8,330 | 7,700 | 6,583 | 8,400 |
| Total revenue before allocation | 44,732 | 47,125 | 52,246 | 583,879 | 533,507 | 336,968 | 571,007 |
| YY Provincial Support | 0 | 0 | 0 | 0 | 0 | 99,049 | 0 |
| Total revenue | 44,732 | 47,125 | 52,246 | 583,879 | 533,507 | 436,017 | 571,007 |
Direct Operating Expenses
| Description | November 2011 | November Budget | November 2012 | Year-to-date 2012 | Year-to-date Budget | Year-to-date 2011 | Annual Budget |
|---|---|---|---|---|---|---|---|
| W Wages & Benefits | 19,481 | 19,106 | 21,792 | 281,454 | 267,805 | 264,255 | 287,545 |
| W2 Contractors | 0 | 0 | 0 | 0 | 0 | 552 | 0 |
| B Medical | 757 | 1,300 | 1,147 | 14,936 | 14,300 | 13,101 | 15,600 |
| M1 Cost of Goods Sold | 0 | 375 | 0 | 170 | 4,125 | 556 | 4,500 |
| C Transport | 1,035 | 1,765 | 887 | 10,838 | 19,510 | 10,702 | 21,260 |
| D Shelter & Pound | 1,265 | 2,150 | 2,067 | 27,027 | 23,646 | 25,102 | 25,796 |
| E Premises | 5,922 | 5,408 | 3,753 | 59,986 | 55,242 | 59,711 | 61,500 |
| G Communications | 575 | 354 | 418 | 4,146 | 3,894 | 4,764 | 4,248 |
| H Office | 833 | 324 | 530 | 7,524 | 3,051 | 5,543 | 3,404 |
| M2 Fundraising Expenses | 8,778 | 1,667 | 4,346 | 14,082 | 18,337 | 15,267 | 20,004 |
| M3 Walkathon Expenses | 0 | 0 | 14 | 396 | 0 | 639 | 0 |
| Q Training | 0 | 0 | 0 | 411 | 0 | 3,583 | 0 |
| R Directors' Governance | 0 | 13 | 0 | 310 | 138 | 0 | 150 |
| S Public Awareness | 0 | 0 | 0 | 0 | 0 | 175 | 0 |
| Total direct operating expenses before allocation | 38,645 | 32,461 | 34,954 | 421,281 | 410,048 | 403,949 | 444,007 |
| Y Provincial Office Expense Allocation | 7,342 | 9,236 | 9,236 | 88,136 | 88,136 | 74,562 | 94,065 |
| Total direct operating expenses | 45,987 | 41,696 | 44,190 | 509,417 | 498,184 | 478,511 | 538,071 |
| Net Operating Surplus (Deficiency) Before Undernoted | (1,255) | 5,429 | 8,056 | 74,462 | 35,323 | (42,494) | 32,935 |
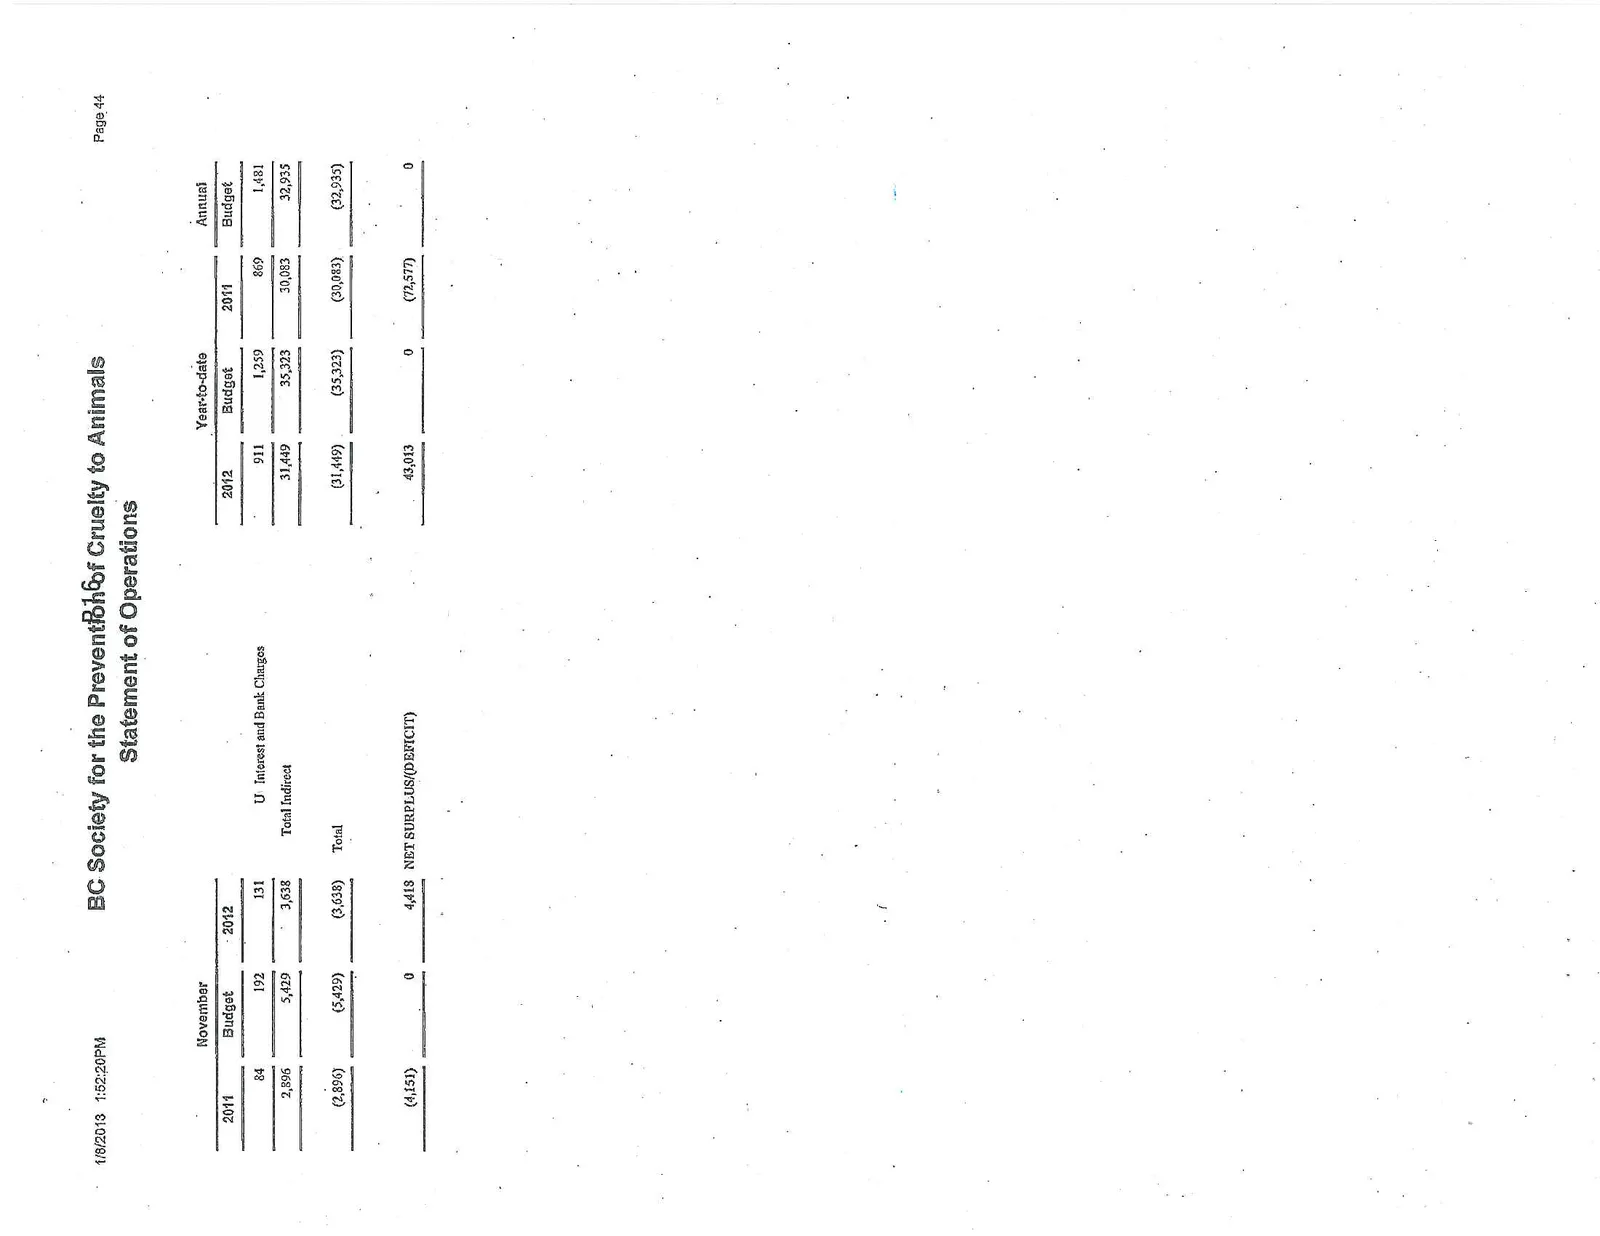
Indirect Items
| Description | November 2011 | November Budget | November 2012 | Year-to-date 2012 | Year-to-date Budget | Year-to-date 2011 | Annual Budget |
|---|---|---|---|---|---|---|---|
| X Amortization | 2,812 | 5,237 | 3,507 | 30,538 | 34,064 | 29,214 | 31,454 |
| U Interest and Bank Charges | 84 | 192 | 131 | 911 | 1,259 | 869 | 1,481 |
| Total Indirect | 2,896 | 5,429 | 3,638 | 31,449 | 35,323 | 30,083 | 32,935 |
| Total | (2,896) | (5,429) | (3,638) | (31,449) | (35,323) | (30,083) | (32,935) |
| NET SURPLUS/(DEFICIT) | (4,151) | 0 | 4,418 | 43,013 | 0 | (72,577) | 0 |
Page 16–17
Extracted from: 2013 03 11 Committee of the Whole Agenda