Committee of the Whole/Documents/BC Society for the Prevention of Cruelty to Animals Statement of Operations - Consolidated
Appendix
BC Society for the Prevention of Cruelty to Animals Statement of Operations - Consolidated
March 11, 2013Pages 18–191 section
Consolidated financial statement of operations for the entire BC SPCA society.
2012 Year-to-date total revenue: $25,381,3002012 Year-to-date net surplus: $1,700,490
BC Society for the Prevention of Cruelty to Animals
Statement of Operations
Consolidated
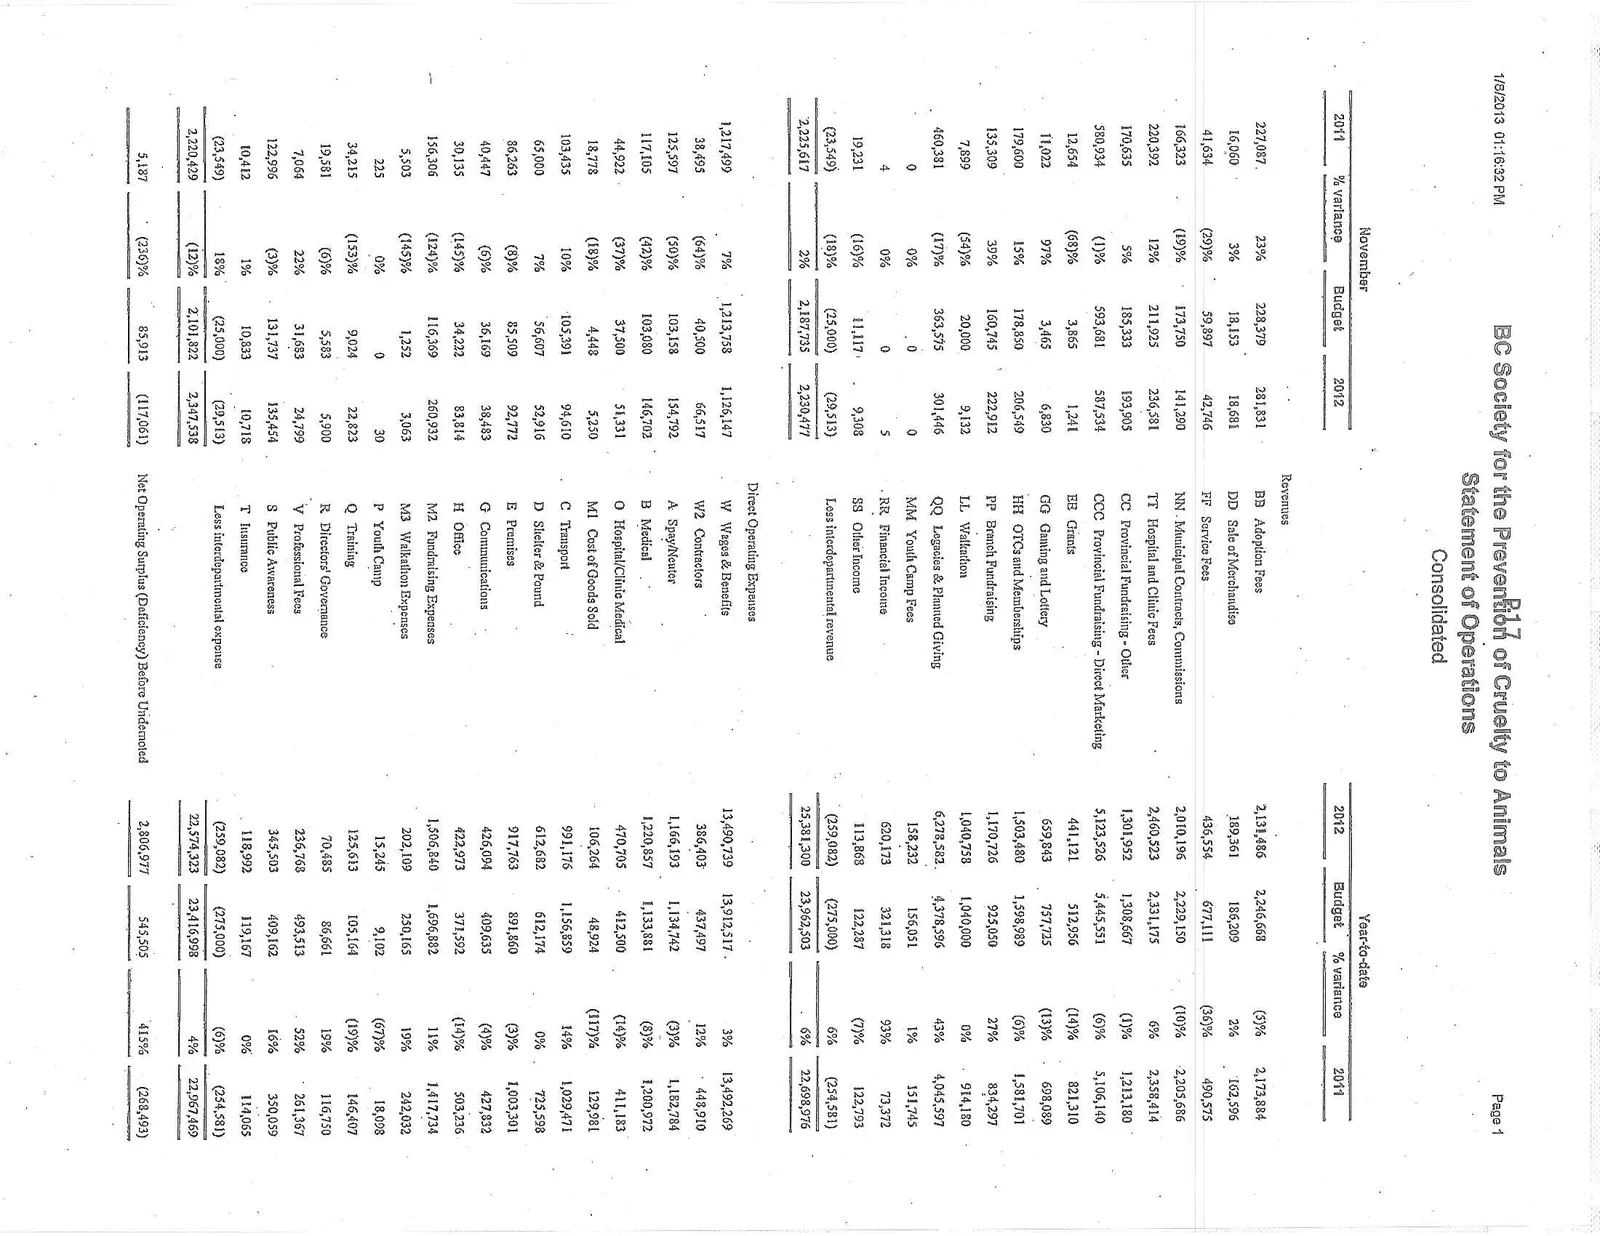
Revenues
| November 2011 | % variance | Budget | November 2012 | Revenues | Year-to-date 2012 | Budget | % variance | Year-to-date 2011 |
|---|---|---|---|---|---|---|---|---|
| 227,087 | 23% | 228,379 | 281,831 | BB Adoption Fees | 2,131,486 | 2,246,668 | (5)% | 2,173,884 |
| 16,060 | 3% | 18,153 | 18,681 | DD Sale of Merchandise | 189,361 | 186,209 | 2% | 162,596 |
| 41,634 | (29)% | 59,897 | 42,746 | FF Service Fees | 436,554 | 677,111 | (36)% | 490,575 |
| 166,323 | (19)% | 173,750 | 141,290 | NN Municipal Contracts, Commissions | 2,010,196 | 2,229,150 | (10)% | 2,205,686 |
| 220,392 | 12% | 211,925 | 236,581 | TT Hospital and Clinic Fees | 2,460,523 | 2,331,175 | 6% | 2,358,414 |
| 170,635 | 5% | 185,333 | 193,905 | CC Provincial Fundraising - Other | 1,301,952 | 1,308,667 | (1)% | 1,213,180 |
| 580,934 | (1)% | 593,681 | 587,534 | CCC Provincial Fundraising - Direct Marketing | 5,123,526 | 5,445,551 | (6)% | 5,106,140 |
| 12,654 | (68)% | 3,865 | 1,241 | BB Grants | 441,121 | 512,956 | (14)% | 821,310 |
| 11,022 | 97% | 3,465 | 6,830 | GG Gaming and Lottery | 659,843 | 757,725 | (13)% | 698,089 |
| 179,600 | 15% | 178,850 | 206,549 | HH OTCs and Memberships | 1,503,480 | 1,598,989 | (6)% | 1,581,701 |
| 135,309 | 39% | 160,745 | 222,912 | PP Branch Fundraising | 1,170,726 | 925,050 | 27% | 834,297 |
| 7,899 | (54)% | 20,000 | 9,132 | LL Walkathon | 1,040,758 | 1,040,000 | 0% | 914,180 |
| 460,381 | (17)% | 363,575 | 301,446 | QQ Legacies & Planned Giving | 6,278,582 | 4,378,596 | 43% | 4,045,597 |
| 0 | 0% | 0 | 0 | MM Youth Camp Fees | 158,232 | 156,051 | 1% | 151,745 |
| 4 | 0% | 0 | 5 | RR Financial Income | 620,173 | 321,318 | 93% | 73,372 |
| 19,231 | (16)% | 11,117 | 9,308 | SS Other Income | 113,868 | 122,287 | (7)% | 122,793 |
| (23,549) | (18)% | (25,000) | (29,513) | Loss interdepartmental revenue | (259,082) | (275,000) | 6% | (254,581) |
| 2,225,617 | 2% | 2,187,735 | 2,230,477 | 25,381,300 | 23,962,503 | 6% | 22,698,976 |
Direct Operating Expenses
| November 2011 | % variance | Budget | November 2012 | Direct Operating Expenses | Year-to-date 2012 | Budget | % variance | Year-to-date 2011 |
|---|---|---|---|---|---|---|---|---|
| 1,217,499 | 7% | 1,213,758 | 1,126,147 | W Wages & Benefits | 13,490,739 | 13,912,517 | 3% | 13,492,269 |
| 38,495 | (64)% | 40,500 | 66,517 | W2 Contractors | 386,403 | 437,497 | 12% | 448,910 |
| 125,597 | (50)% | 103,158 | 154,792 | A Spay/Neuter | 1,166,193 | 1,134,742 | (3)% | 1,182,784 |
| 117,105 | (42)% | 103,080 | 146,702 | B Medical | 1,220,857 | 1,133,881 | (8)% | 1,200,972 |
| 44,922 | (37)% | 37,500 | 51,331 | O Hospital/Clinic Medical | 470,705 | 412,500 | (14)% | 411,183 |
| 18,778 | (18)% | 4,448 | 5,250 | M1 Cost of Goods Sold | 106,264 | 48,924 | (117)% | 129,981 |
| 103,435 | 10% | 105,391 | 94,610 | C Transport | 991,176 | 1,156,859 | 14% | 1,029,471 |
| 65,000 | 7% | 56,607 | 52,916 | D Shelter & Pound | 612,682 | 612,174 | 0% | 725,598 |
| 86,263 | (8)% | 85,509 | 92,772 | E Premises | 917,763 | 891,860 | (3)% | 1,003,301 |
| 40,447 | (6)% | 36,169 | 38,483 | G Communications | 426,094 | 409,635 | (4)% | 427,832 |
| 30,135 | (145)% | 34,222 | 83,814 | H Office | 422,973 | 371,592 | (14)% | 503,236 |
| 156,306 | (124)% | 116,369 | 260,932 | M2 Fundraising Expenses | 1,506,840 | 1,696,882 | 11% | 1,417,734 |
| 5,503 | (145)% | 1,252 | 3,063 | M3 Walkathon Expenses | 202,109 | 250,165 | 19% | 242,032 |
| 225 | 0% | 0 | 30 | P Youth Camp | 15,245 | 9,102 | (67)% | 18,098 |
| 34,215 | (153)% | 9,024 | 22,823 | Q Training | 125,613 | 105,164 | (19)% | 146,407 |
| 19,581 | (6)% | 5,583 | 5,900 | R Directors' Governance | 70,485 | 86,661 | 19% | 116,750 |
| 7,064 | 22% | 31,683 | 24,799 | V Professional Fees | 236,768 | 493,513 | 52% | 261,367 |
| 122,996 | (3)% | 131,737 | 135,454 | S Public Awareness | 345,503 | 409,162 | 16% | 350,059 |
| 10,412 | 1% | 10,833 | 10,718 | T Insurance | 118,992 | 119,167 | 0% | 114,065 |
| (23,549) | 18% | (25,000) | (29,513) | Less interdepartmental expense | (259,082) | (275,000) | (6)% | (254,581) |
| 2,220,429 | (12)% | 2,101,822 | 2,347,538 | 22,574,323 | 23,416,998 | 4% | 22,967,469 |
| November 2011 | % variance | Budget | November 2012 | Summary | Year-to-date 2012 | Budget | % variance | Year-to-date 2011 |
|---|---|---|---|---|---|---|---|---|
| 5,187 | (236)% | 85,913 | (117,061) | Net Operating Surplus (Deficiency) Before Undernoted | 2,806,977 | 545,505 | 415% | (268,493) |
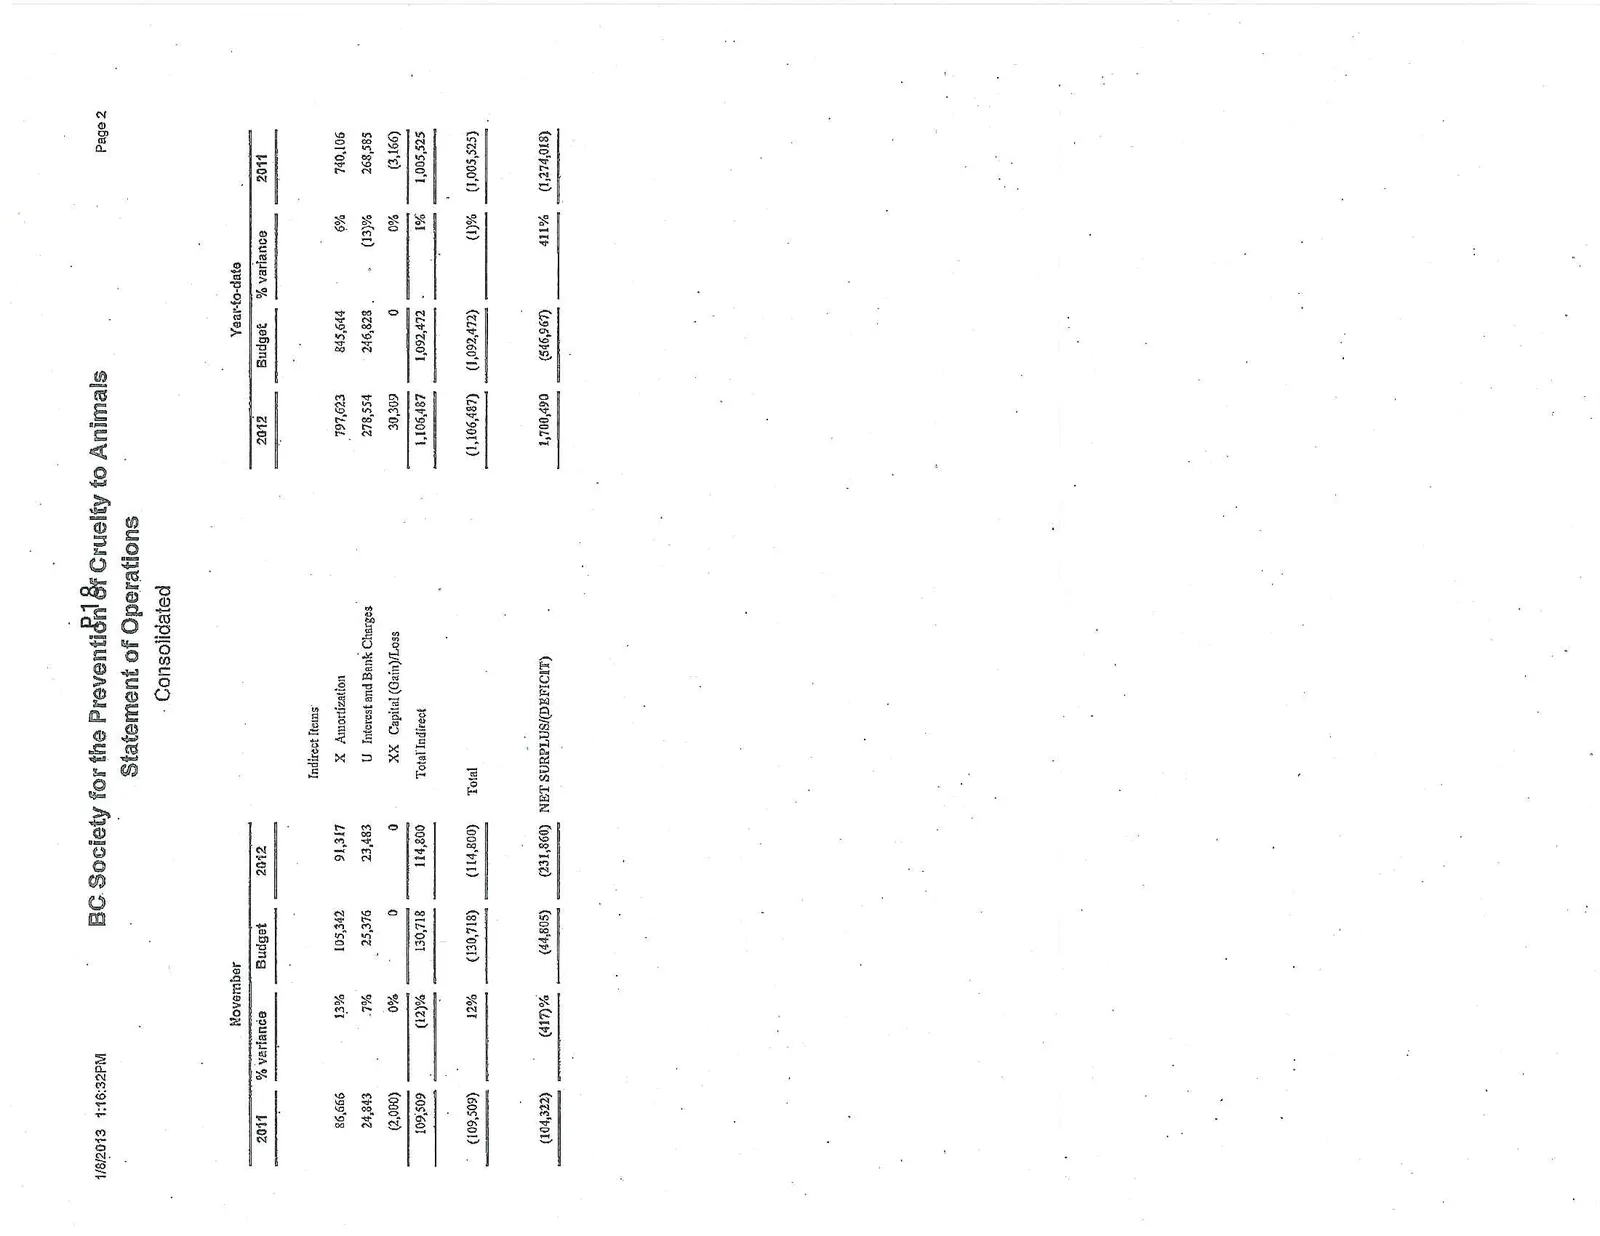
Indirect Items
| November 2011 | % variance | Budget | November 2012 | Indirect Items | Year-to-date 2012 | Budget | % variance | Year-to-date 2011 |
|---|---|---|---|---|---|---|---|---|
| 86,666 | 13% | 105,342 | 91,317 | X Amortization | 797,623 | 845,644 | 6% | 740,106 |
| 24,843 | 7% | 25,376 | 23,483 | U Interest and Bank Charges | 278,554 | 246,828 | (13)% | 268,585 |
| (2,000) | 0% | 0 | 0 | XX Capital (Gain)/Loss | 30,309 | 0 | 0% | (3,166) |
| 109,509 | (12)% | 130,718 | 114,800 | Total Indirect | 1,106,487 | 1,092,472 | 1% | 1,005,525 |
| November 2011 | % variance | Budget | November 2012 | Summary | Year-to-date 2012 | Budget | % variance | Year-to-date 2011 |
|---|---|---|---|---|---|---|---|---|
| (109,509) | 12% | (130,718) | (114,800) | Total | (1,106,487) | (1,092,472) | (1)% | (1,005,525) |
| (104,322) | (417)% | (44,805) | (231,860) | NET SURPLUS/(DEFICIT) | 1,700,490 | (546,967) | 411% | (1,274,018) |
Page 18–19
Extracted from: 2013 03 11 Committee of the Whole Agenda