Appendix
BC SPCA Wild ARC Budget For Period Ending September-Fy2013
March 11, 2013Page 201 section
Detailed revenue and expense budget for Wild ARC for the 2013 fiscal year.
Budgeted total revenues: $624,882Budgeted net surplus: $22,036
P19 BC SPCA Wild Arc Budget
For Period Ending September-Fy2013
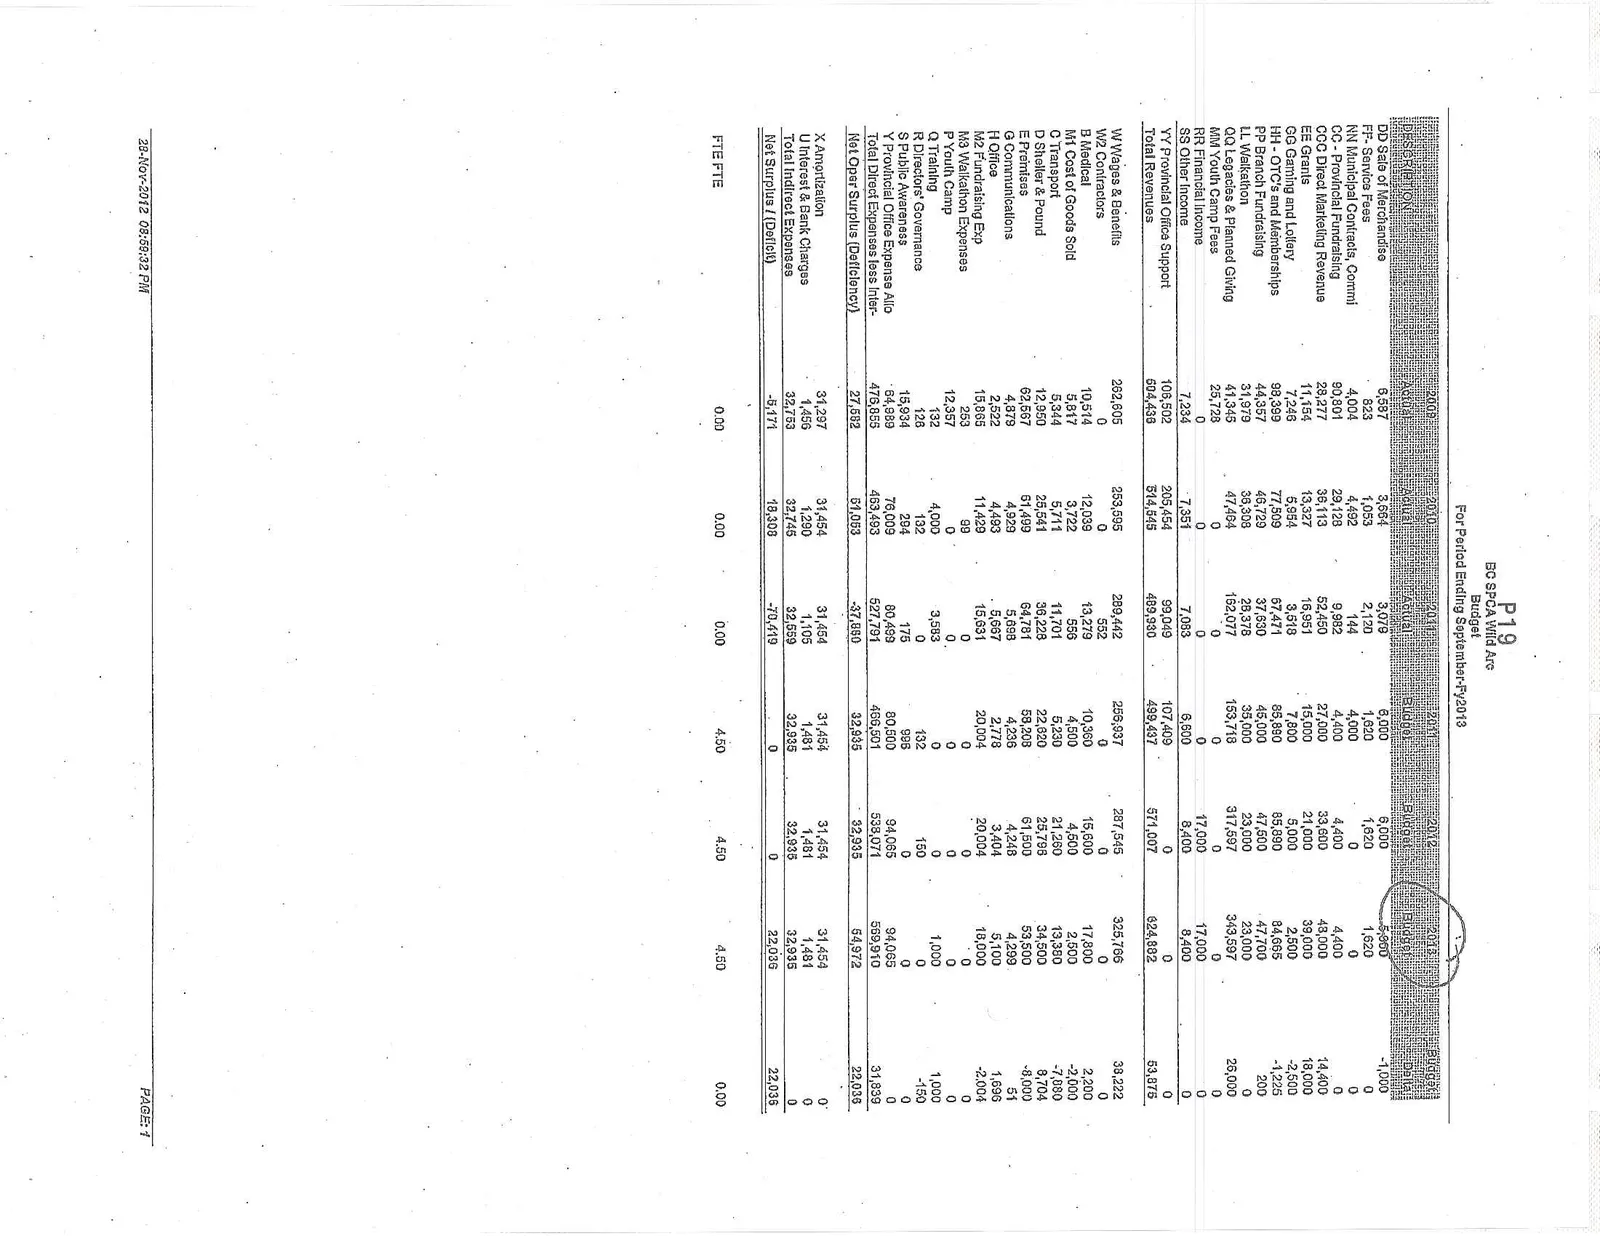
| DESCRIPTION | 2009 Actual | 2010 Actual | 2011 Actual | 2012 Budget | 2012 Budget | 2013 Budget | Budget Delta |
|---|---|---|---|---|---|---|---|
| DD Sale of Merchandise | 6,597 | 3,664 | 3,079 | 6,000 | 6,000 | 5,000 | -1,000 |
| FF- Service Fees | 823 | 1,053 | 2,120 | 1,620 | 1,620 | 1,620 | 0 |
| NN Municipal Contracts, Comm | 4,004 | 4,492 | 144 | 4,000 | 0 | 0 | 0 |
| CC - Provincial Fundraising | 90,801 | 29,128 | 9,982 | 4,400 | 4,400 | 4,400 | 0 |
| CCC Direct Marketing Revenue | 28,277 | 39,113 | 52,450 | 27,000 | 33,600 | 48,000 | 14,400 |
| EE Grants | 11,154 | 13,327 | 16,951 | 15,000 | 21,000 | 39,000 | 18,000 |
| GG Gaming and Lottery | 7,246 | 5,954 | 3,518 | 7,800 | 5,000 | 2,500 | -2,500 |
| HH - OTC's and Memberships | 98,399 | 77,509 | 67,471 | 85,890 | 85,890 | 84,665 | -1,225 |
| PP Branch Fundraising | 44,357 | 46,729 | 37,630 | 45,000 | 47,500 | 47,700 | 200 |
| LL Walkathon | 31,979 | 38,308 | 25,378 | 35,000 | 23,000 | 23,000 | 0 |
| QQ Legacies & Planned Giving | 41,345 | 47,464 | 152,077 | 153,718 | 317,597 | 343,597 | 26,000 |
| MM Youth Camp Fees | 25,728 | 0 | 0 | 0 | 0 | 0 | 0 |
| RR Financial Income | 0 | 0 | 0 | 0 | 17,000 | 17,000 | 0 |
| SS Other Income | 7,234 | 7,351 | 7,053 | 8,600 | 8,400 | 8,400 | 0 |
| YY Provincial Office Support | 106,502 | 205,454 | 99,049 | 107,409 | 0 | 0 | 0 |
| Total Revenues | 504,439 | 514,545 | 484,930 | 499,437 | 571,007 | 624,882 | 53,875 |
| W Wages & Benefits | 262,605 | 253,595 | 289,442 | 258,937 | 287,545 | 325,766 | 39,222 |
| W2 Contractors | 0 | 0 | 552 | 0 | 0 | 0 | 0 |
| B Medical | 10,514 | 12,039 | 13,279 | 10,360 | 15,600 | 17,800 | 2,200 |
| M1 Cost of Goods Sold | 5,817 | 3,722 | 556 | 4,500 | 4,500 | 2,500 | -2,000 |
| C Transport | 5,344 | 5,711 | 11,701 | 5,230 | 21,260 | 13,380 | -7,880 |
| D Shelter & Pound | 12,950 | 25,541 | 36,223 | 22,620 | 25,796 | 34,500 | 8,704 |
| E Premises | 62,567 | 61,499 | 64,781 | 59,208 | 61,500 | 53,500 | -8,000 |
| G Communications | 4,879 | 4,929 | 5,698 | 4,236 | 4,248 | 4,299 | 51 |
| H Office | 2,522 | 4,493 | 5,667 | 2,778 | 3,404 | 5,100 | 1,696 |
| M2 Fundraising Exp | 15,865 | 11,429 | 15,631 | 20,004 | 20,004 | 18,000 | -2,004 |
| M3 Walkathon Expenses | 253 | 99 | 0 | 0 | 0 | 0 | 0 |
| P Youth Camp | 12,357 | 0 | 0 | 0 | 0 | 0 | 0 |
| Q Training | 132 | 4,000 | 3,583 | 0 | 0 | 1,000 | 1,000 |
| R Directors' Governance | 126 | 132 | 0 | 132 | 150 | 0 | -150 |
| S Public Awareness | 15,934 | 294 | 175 | 996 | 0 | 0 | 0 |
| Y Provincial Office Expense Allo | 64,889 | 76,009 | 80,499 | 80,500 | 94,065 | 94,065 | 0 |
| Total Direct Expenses less Inter- | 476,855 | 463,493 | 527,791 | 466,501 | 538,071 | 569,910 | 31,839 |
| Net Oper Surplus (Deficiency) | 27,582 | 51,053 | -37,880 | 32,935 | 32,935 | 54,972 | 22,036 |
| X Amortization | 31,297 | 31,454 | 31,454 | 31,454 | 31,454 | 31,454 | 0 |
| U Interest & Bank Charges | 1,456 | 1,290 | 1,105 | 1,481 | 1,481 | 1,481 | 0 |
| Total Indirect Expenses | 32,753 | 32,745 | 32,559 | 32,935 | 32,935 | 32,935 | 0 |
| Net Surplus / (Deficit) | -5,171 | 18,308 | -70,419 | 0 | 0 | 22,036 | 22,036 |
| FTE FTE | 0.00 | 0.00 | 0.00 | 4.50 | 4.50 | 4.50 | 0.00 |
Page 20
Extracted from: 2013 03 11 Committee of the Whole Agenda