British Columbia Society for the Prevention of Cruelty to Animals Financial Statements December 31, 2011
Audited annual financial statements and notes for the BC SPCA for the fiscal year ending December 31, 2011.
British Columbia Society for the Prevention of Cruelty to Animals
Financial Statements December 31, 2011
Independent Auditor's Report
April 21, 2012
To the Members of British Columbia Society for the Prevention of Cruelty to Animals
We have audited the accompanying financial statements of British Columbia Society for the Prevention of Cruelty to Animals (the "Society"), which comprise the statement of financial position as at December 31, 2011 and the statements of operations, changes in net assets and cash flows for the year then ended, and the related notes, which comprise a summary of significant accounting policies and other explanatory information.
Management’s responsibility for the financial statements
Management is responsible for the preparation and fair presentation of these financial statements in accordance with Canadian generally accepted accounting principles, and for such internal control as management determines is necessary to enable the preparation of financial statements that are free from material misstatement, whether due to fraud or error.
Auditor’s responsibility
Our responsibility is to express an opinion on these financial statements based on our audit. We conducted our audit in accordance with Canadian generally accepted auditing standards. Those standards require that we comply with ethical requirements and plan and perform the audit to obtain reasonable assurance about whether the financial statements are free from material misstatement.
An audit involves performing procedures to obtain audit evidence about the amounts and disclosures in the financial statements. The procedures selected depend on the auditor’s judgment, including the assessment of the risks of material misstatement of the financial statements, whether due to fraud or error. In making those risk assessments, the auditor considers internal control relevant to the entity’s preparation and fair presentation of the financial statements in order to design audit procedures that are appropriate in the circumstances, but not for the purpose of expressing an opinion on the effectiveness of the entity’s internal control. An audit also includes evaluating the appropriateness of accounting policies used and the reasonableness of accounting estimates made by management, as well as evaluating the overall presentation of the financial statements.
We believe that the audit evidence we have obtained is sufficient and appropriate to provide a basis for our qualified audit opinion.
Basis for qualified opinion
In common with many charitable organizations, the Society derives revenue from donations and fundraising often received in the form of cash, the completeness of which is not susceptible of satisfactory audit verification. Accordingly, our verification of these revenues was limited to the amounts recorded in the records of the Society and we were not able to determine whether any adjustments might be necessary relating to the amount of cash donations included in donation and fundraising revenue, net operating (deficiency) surplus for the year, current assets and net assets.
In addition, the Society is unable to provide adequate information with respect to the historical costs of the property, buildings and equipment that have been acquired over many years. Without this information, we were unable to satisfy ourselves that all of the property, buildings and equipment that the Society had acquired prior to January 1, 2003 were recorded, and that all recorded amounts are accurate and relate to property, buildings and equipment that exist and are owned by the Society. As a result, we were unable to determine whether any adjustments might be necessary to property, buildings and equipment, deferred capital contributions, amortization for the year, net operating (deficiency) surplus for the year and net assets relating to pre-January 1, 2003 acquisitions.
Qualified opinion
In our opinion, except for the possible effects of the matters described in the basis for qualified opinion paragraphs, the financial statements present fairly, in all material respects, the financial position of the Society as at December 31, 2011 and the results of its operations and its cash flows for the year then ended in accordance with Canadian generally accepted accounting principles.
PricewaterhouseCoopers LLP Chartered Accountants PricewaterhouseCoopers Place, 250 Howe Street, Suite 700, Vancouver, British Columbia, Canada V6C 3S7 T: +1 604 806 7000, F: +1 604 806 7806
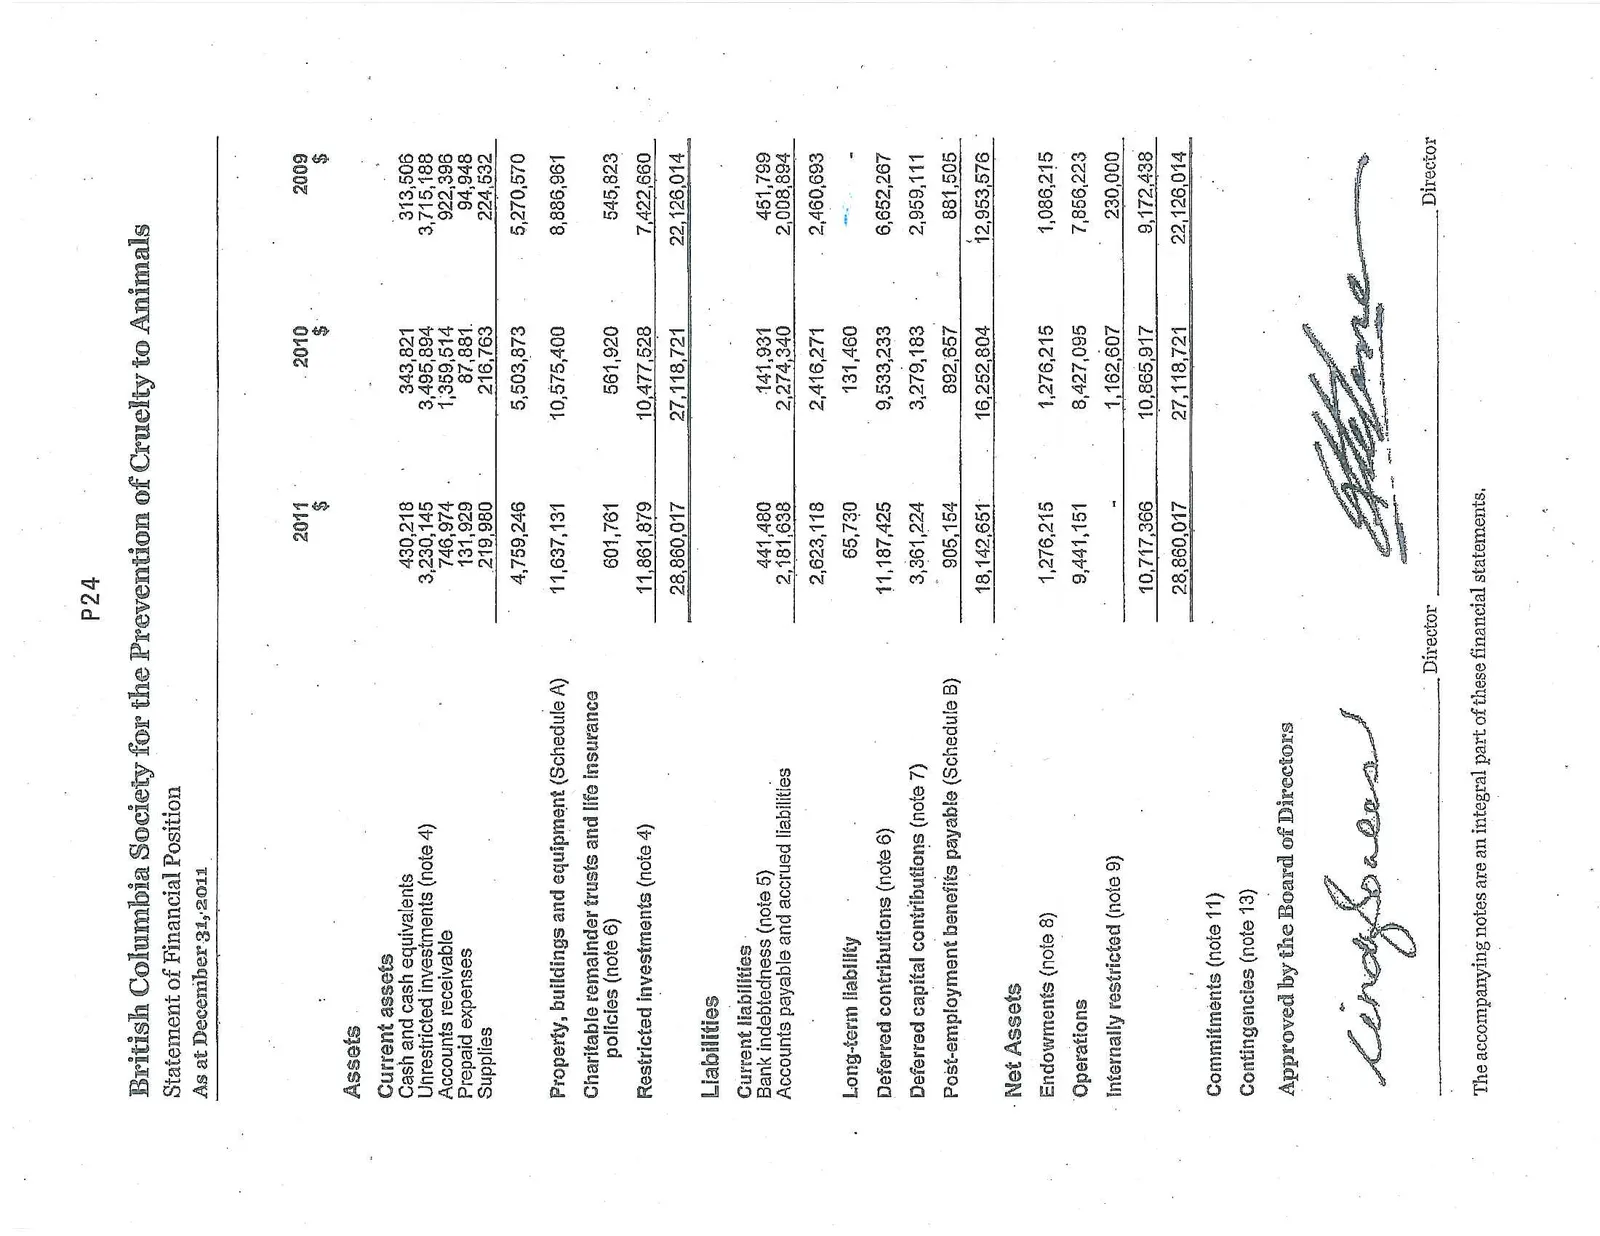
British Columbia Society for the Prevention of Cruelty to Animals
Statement of Financial Position As at December 31, 2011
| 2011 $ | 2010 $ | 2009 $ | |
|---|---|---|---|
| Assets | |||
| Current assets | |||
| Cash and cash equivalents | 430,218 | 343,821 | 313,506 |
| Unrestricted investments (note 4) | 3,230,145 | 3,495,894 | 3,715,188 |
| Accounts receivable | 746,974 | 1,359,514 | 922,396 |
| Prepaid expenses | 131,929 | 87,881 | 94,348 |
| Supplies | 219,980 | 216,763 | 224,532 |
| 4,759,246 | 5,503,873 | 5,270,570 | |
| Property, buildings and equipment (Schedule A) | 11,637,131 | 10,575,400 | 8,886,961 |
| Charitable remainder trusts and life insurance policies (note 6) | 601,761 | 561,920 | 545,823 |
| Restricted investments (note 4) | 11,861,879 | 10,477,528 | 7,422,660 |
| 28,860,017 | 27,118,721 | 22,126,014 | |
| Liabilities | |||
| Current liabilities | |||
| Bank indebtedness (note 5) | 441,480 | 141,931 | 451,799 |
| Accounts payable and accrued liabilities | 2,181,638 | 2,274,340 | 2,008,894 |
| 2,623,118 | 2,416,271 | 2,460,693 | |
| Long-term liability | 65,730 | 131,460 | — |
| Deferred contributions (note 6) | 11,187,425 | 9,533,233 | 6,652,267 |
| Deferred capital contributions (note 7) | 3,361,224 | 3,279,183 | 2,959,111 |
| Post-employment benefits payable (Schedule B) | 905,154 | 892,657 | 881,505 |
| 18,142,651 | 16,252,804 | 12,953,576 | |
| Net Assets | |||
| Endowments (note 8) | 1,276,215 | 1,276,215 | 1,086,215 |
| Operations | 9,441,151 | 8,427,095 | 7,856,223 |
| Internally restricted (note 9) | — | 1,162,607 | 230,000 |
| 10,717,366 | 10,865,917 | 9,172,438 | |
| 28,860,017 | 27,118,721 | 22,126,014 |
Commitments (note 11) Contingencies (note 13)
British Columbia Society for the Prevention of Cruelty to Animals
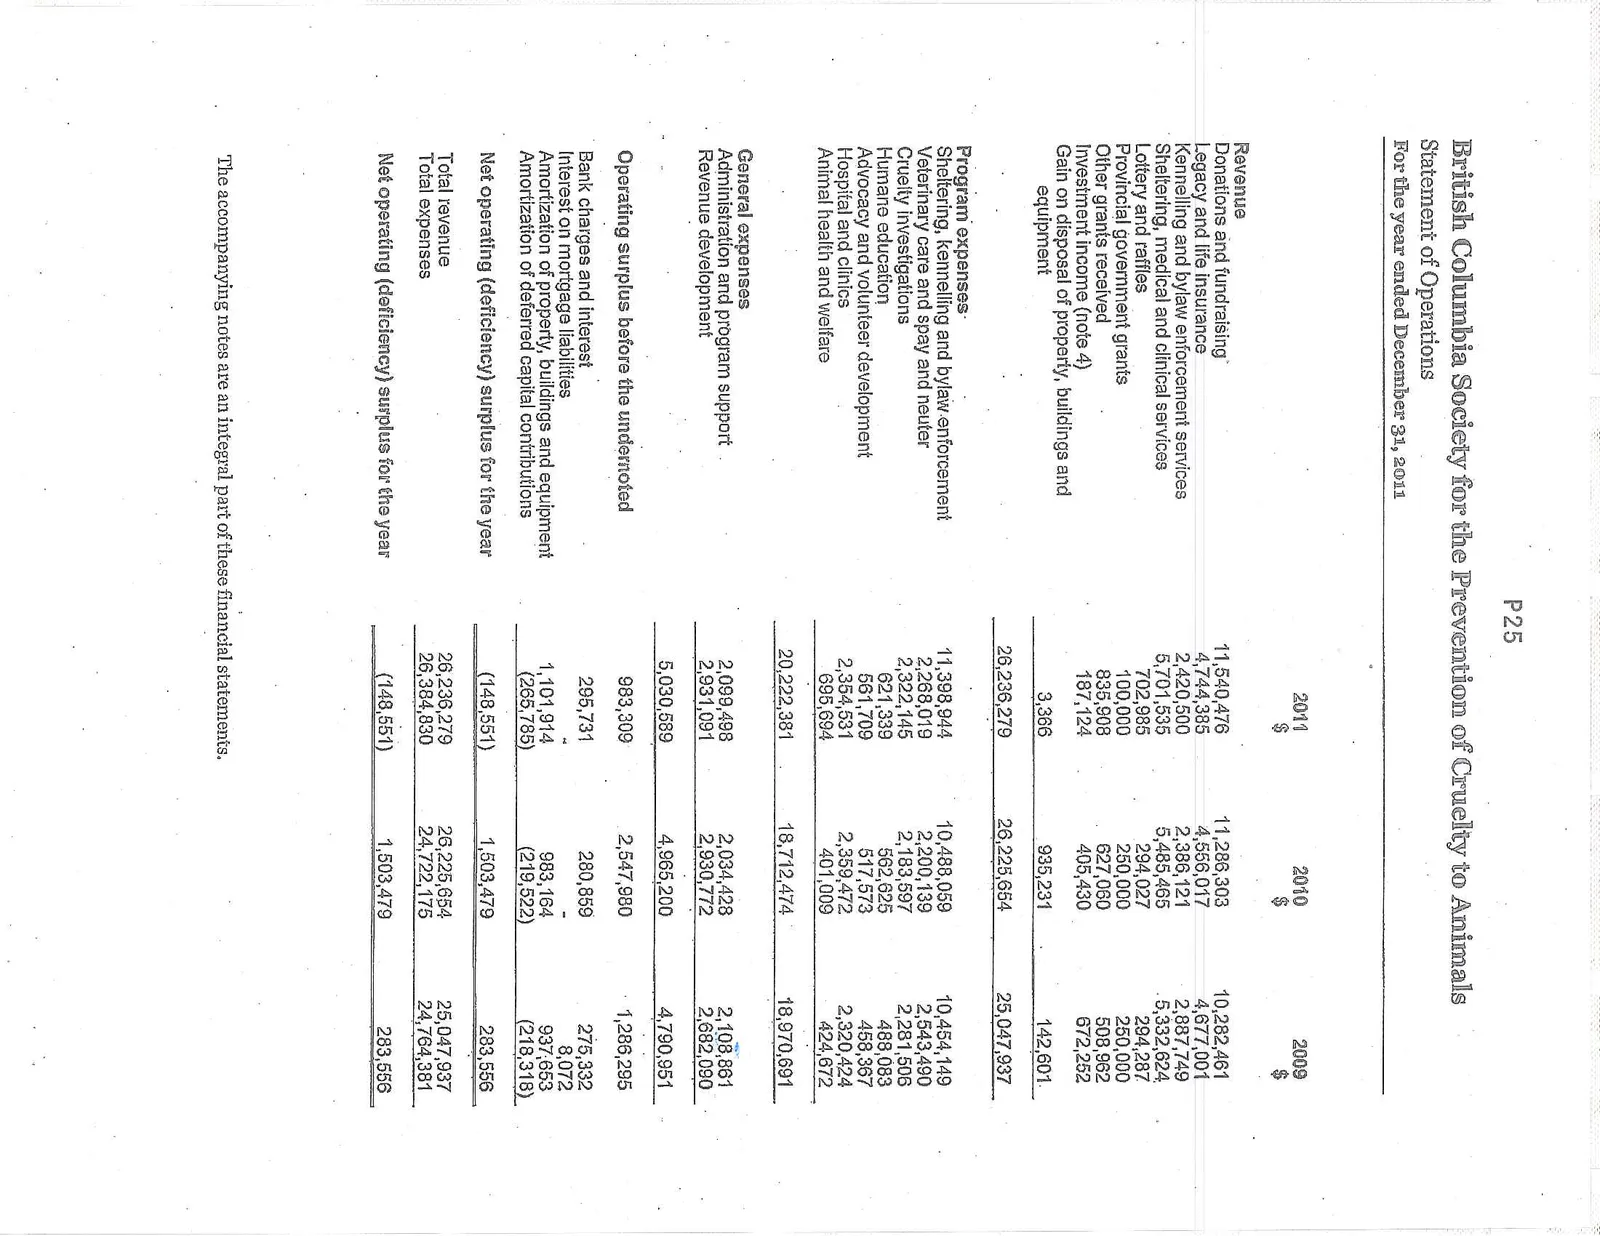
Statement of Operations For the year ended December 31, 2011
| 2011 $ | 2010 $ | 2009 $ | |
|---|---|---|---|
| Revenue | |||
| Donations and fundraising | 11,540,476 | 11,286,303 | 10,282,461 |
| Legacy and life insurance | 4,744,385 | 4,556,017 | 4,677,001 |
| Kennelling and bylaw enforcement services | 2,420,500 | 2,386,121 | 2,887,749 |
| Sheltering, medical and clinical services | 5,701,535 | 5,485,465 | 5,332,624 |
| Lottery and raffles | 702,985 | 294,027 | 294,287 |
| Provincial government grants | 100,000 | 250,000 | 250,000 |
| Other grants received | 835,908 | 627,060 | 508,962 |
| Investment income (note 4) | 187,124 | 405,430 | 672,252 |
| Gain on disposal of property, buildings and equipment | 3,366 | 935,231 | 142,601 |
| 26,236,279 | 26,225,654 | 25,047,937 | |
| Program expenses | |||
| Sheltering, kennelling and bylaw enforcement | 11,398,944 | 10,488,059 | 10,454,149 |
| Veterinary care and spay and neuter | 2,268,019 | 2,200,139 | 2,543,490 |
| Cruelty investigations | 2,322,145 | 2,183,597 | 2,281,506 |
| Humane education | 621,339 | 562,625 | 488,083 |
| Advocacy and volunteer development | 561,709 | 517,573 | 458,367 |
| Hospital and clinics | 2,354,531 | 2,359,472 | 2,320,424 |
| Animal health and welfare | 695,694 | 401,009 | 424,672 |
| 20,222,381 | 18,712,474 | 18,970,691 | |
| General expenses | |||
| Administration and program support | 2,099,498 | 2,034,428 | 2,108,861 |
| Revenue development | 2,931,091 | 2,930,772 | 2,682,090 |
| 5,030,589 | 4,965,200 | 4,790,951 | |
| Operating surplus before the undernoted | 983,309 | 2,547,980 | 1,286,295 |
| Bank charges and interest | 295,731 | 280,859 | 275,332 |
| Interest on mortgage liabilities | — | — | 8,072 |
| Amortization of property, buildings and equipment | 1,101,914 | 983,164 | 937,653 |
| Amortization of deferred capital contributions | (265,785) | (219,522) | (218,318) |
| Net operating (deficiency) surplus for the year | (148,551) | 1,503,479 | 283,556 |
| Total revenue | 26,236,279 | 26,225,654 | 25,047,937 |
| Total expenses | 26,384,830 | 24,722,175 | 24,764,381 |
| Net operating (deficiency) surplus for the year | (148,551) | 1,503,479 | 283,556 |
British Columbia Society for the Prevention of Cruelty to Animals
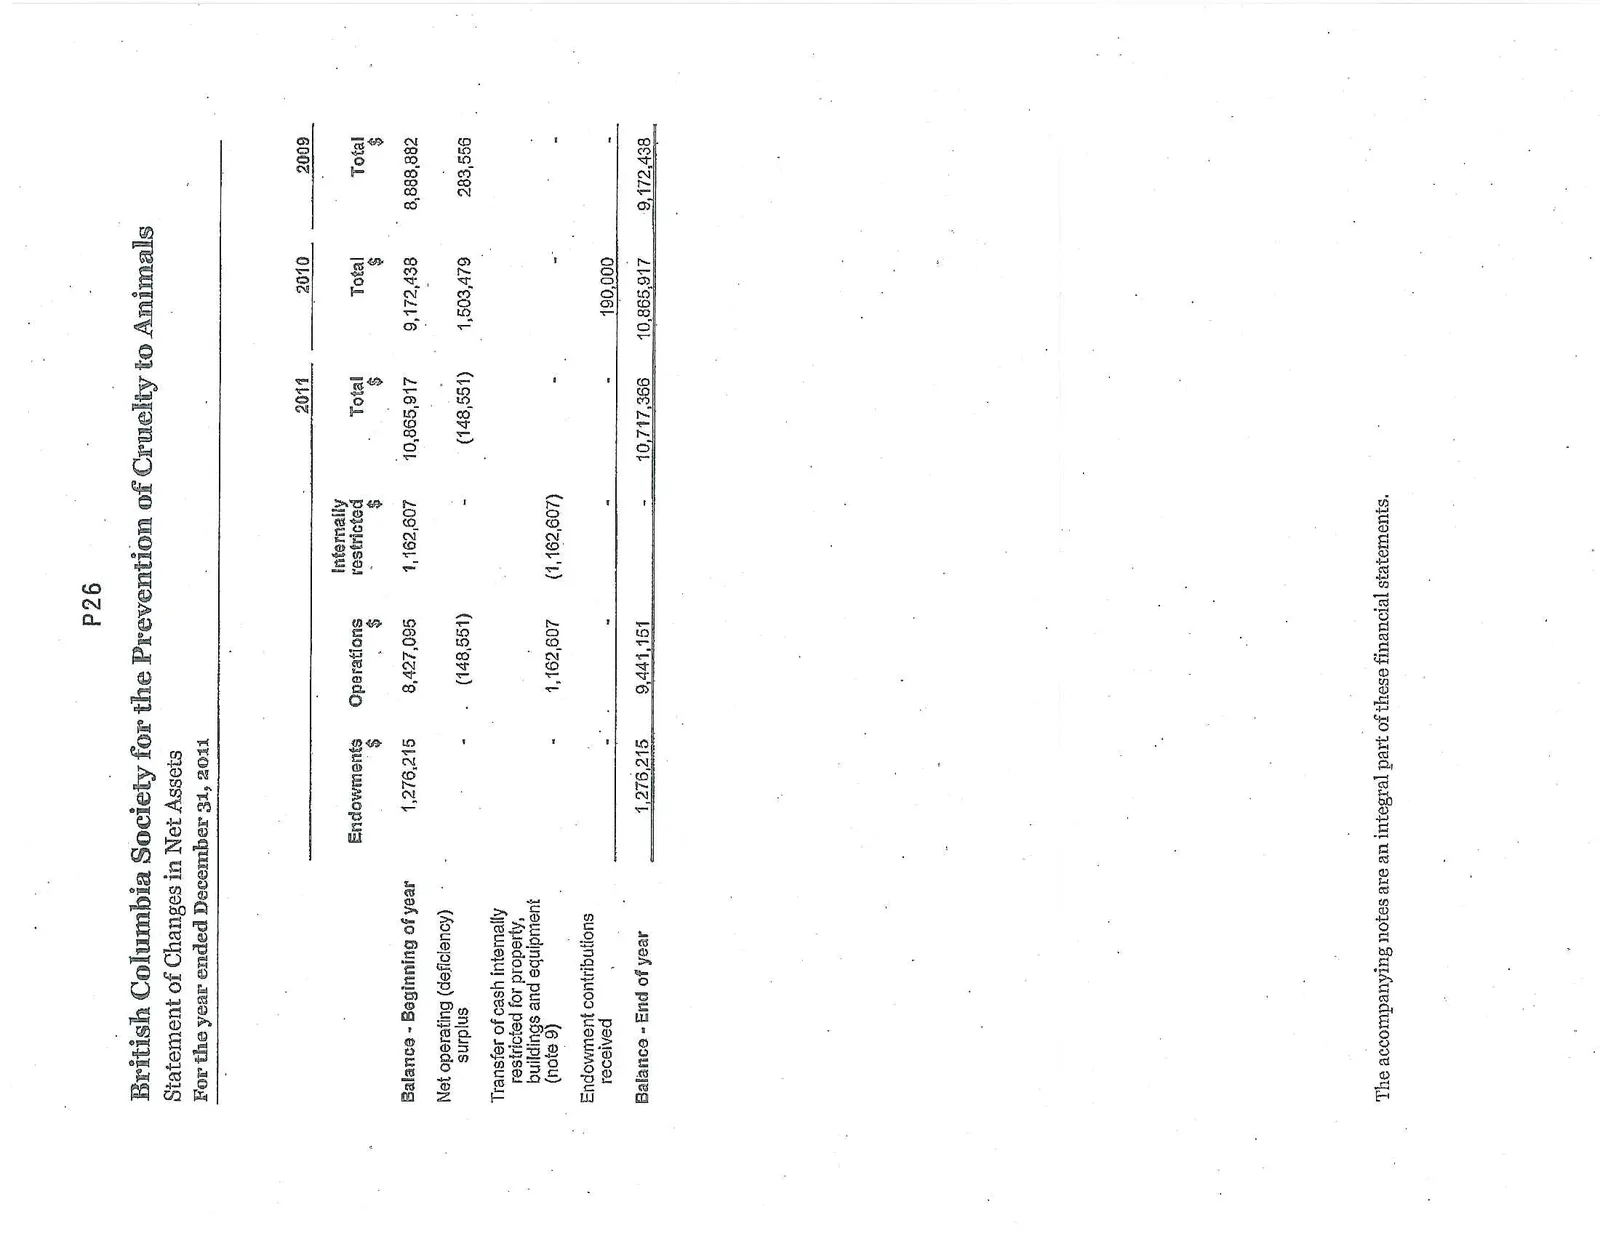
Statement of Changes in Net Assets For the year ended December 31, 2011
| Endowments $ | Operations $ | Internally restricted $ | Total 2011 $ | Total 2010 $ | Total 2009 $ | |
|---|---|---|---|---|---|---|
| Balance - Beginning of year | 1,276,215 | 8,427,095 | 1,162,607 | 10,865,917 | 9,172,438 | 8,888,882 |
| Net operating (deficiency) surplus | — | (148,551) | — | (148,551) | 1,503,479 | 283,556 |
| Transfer of cash internally restricted for property, buildings and equipment (note 9) | — | 1,162,607 | (1,162,607) | — | — | — |
| Endowment contributions received | — | — | — | — | 190,000 | — |
| Balance - End of year | 1,276,215 | 9,441,151 | — | 10,717,366 | 10,865,917 | 9,172,438 |
British Columbia Society for the Prevention of Cruelty to Animals
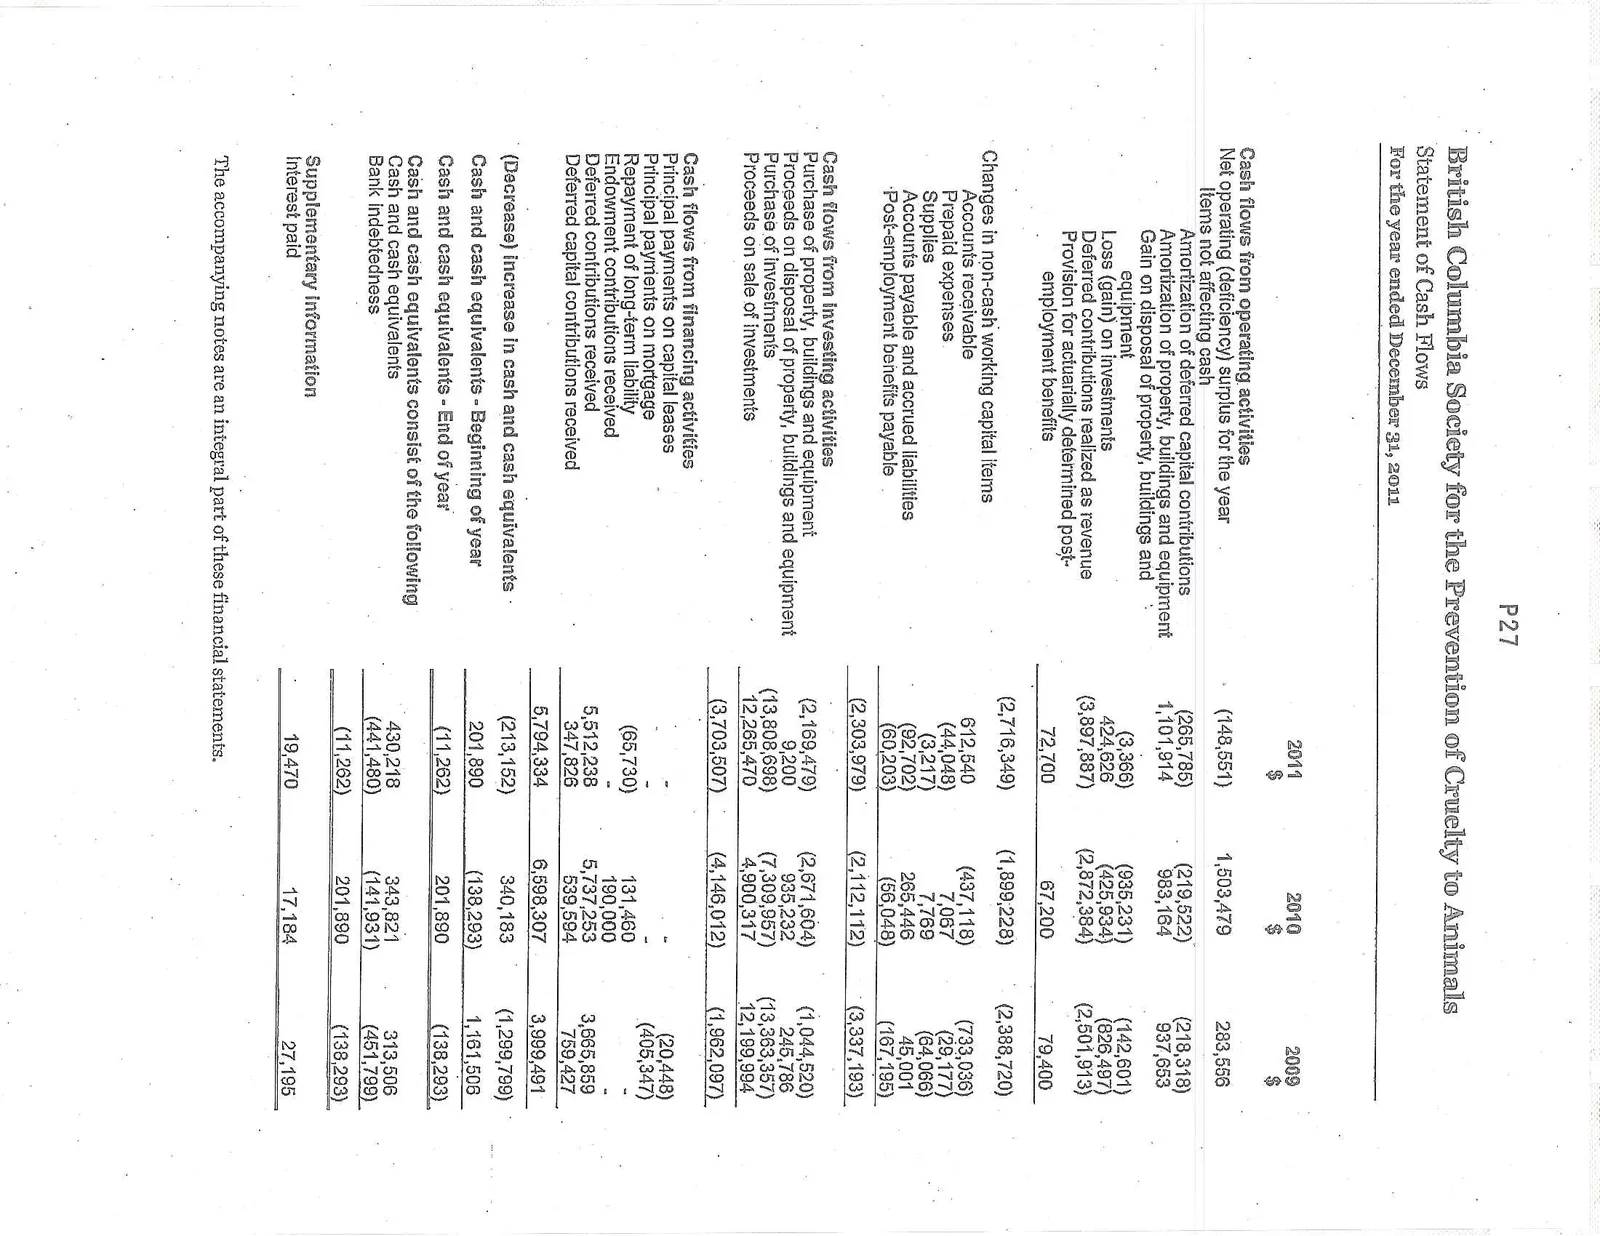
Statement of Cash Flows For the year ended December 31, 2011
| 2011 $ | 2010 $ | 2009 $ | |
|---|---|---|---|
| Cash flows from operating activities | |||
| Net operating (deficiency) surplus for the year | (148,551) | 1,503,479 | 283,556 |
| Items not affecting cash | |||
| Amortization of deferred capital contributions | (265,785) | (219,522) | (218,318) |
| Amortization of property, buildings and equipment | 1,101,914 | 983,164 | 937,653 |
| Gain on disposal of property, buildings and equipment | (3,366) | (935,231) | (142,601) |
| Loss (gain) on investments | 424,626 | (425,934) | (826,497) |
| Deferred contributions realized as revenue | (3,897,887) | (2,872,384) | (2,501,913) |
| Provision for actuarially determined post-employment benefits | 72,700 | 67,200 | 79,400 |
| (2,716,349) | (1,899,228) | (2,388,720) | |
| Changes in non-cash working capital items | |||
| Accounts receivable | 612,540 | (437,118) | (733,036) |
| Prepaid expenses | (44,048) | 7,067 | (29,177) |
| Supplies | (3,217) | 7,769 | (64,066) |
| Accounts payable and accrued liabilities | (92,702) | 265,446 | 45,001 |
| Post-employment benefits payable | (60,203) | (56,048) | (167,195) |
| (2,303,979) | (2,112,112) | (3,337,193) | |
| Cash flows from investing activities | |||
| Purchase of property, buildings and equipment | (2,169,479) | (2,671,604) | (1,044,520) |
| Proceeds on disposal of property, buildings and equipment | 9,200 | 935,232 | 245,786 |
| Purchase of investments | (13,808,698) | (7,309,957) | (13,363,357) |
| Proceeds on sale of investments | 12,265,470 | 4,900,317 | 12,199,994 |
| (3,703,507) | (4,146,012) | (1,962,097) | |
| Cash flows from financing activities | |||
| Principal payments on capital leases | — | — | (20,448) |
| Principal payments on mortgage | — | — | (405,347) |
| Repayment of long-term liability | (65,730) | 131,460 | — |
| Endowment contributions received | — | 190,000 | — |
| Deferred contributions received | 5,512,238 | 5,737,253 | 3,665,859 |
| Deferred capital contributions received | 347,826 | 539,594 | 759,427 |
| 5,794,334 | 6,598,307 | 3,999,491 | |
| (Decrease) increase in cash and cash equivalents | (213,152) | 340,183 | (1,299,799) |
| Cash and cash equivalents - Beginning of year | 201,890 | (138,293) | 1,161,506 |
| Cash and cash equivalents - End of year | (11,262) | 201,890 | (138,293) |
| Cash and cash equivalents consist of the following | |||
| Cash and cash equivalents | 430,218 | 343,821 | 313,506 |
| Bank indebtedness | (441,480) | (141,931) | (451,799) |
| (11,262) | 201,890 | (138,293) | |
| Supplementary Information | |||
| Interest paid | 19,470 | 17,184 | 27,195 |
British Columbia Society for the Prevention of Cruelty to Animals
Notes to Financial Statements December 31, 2011
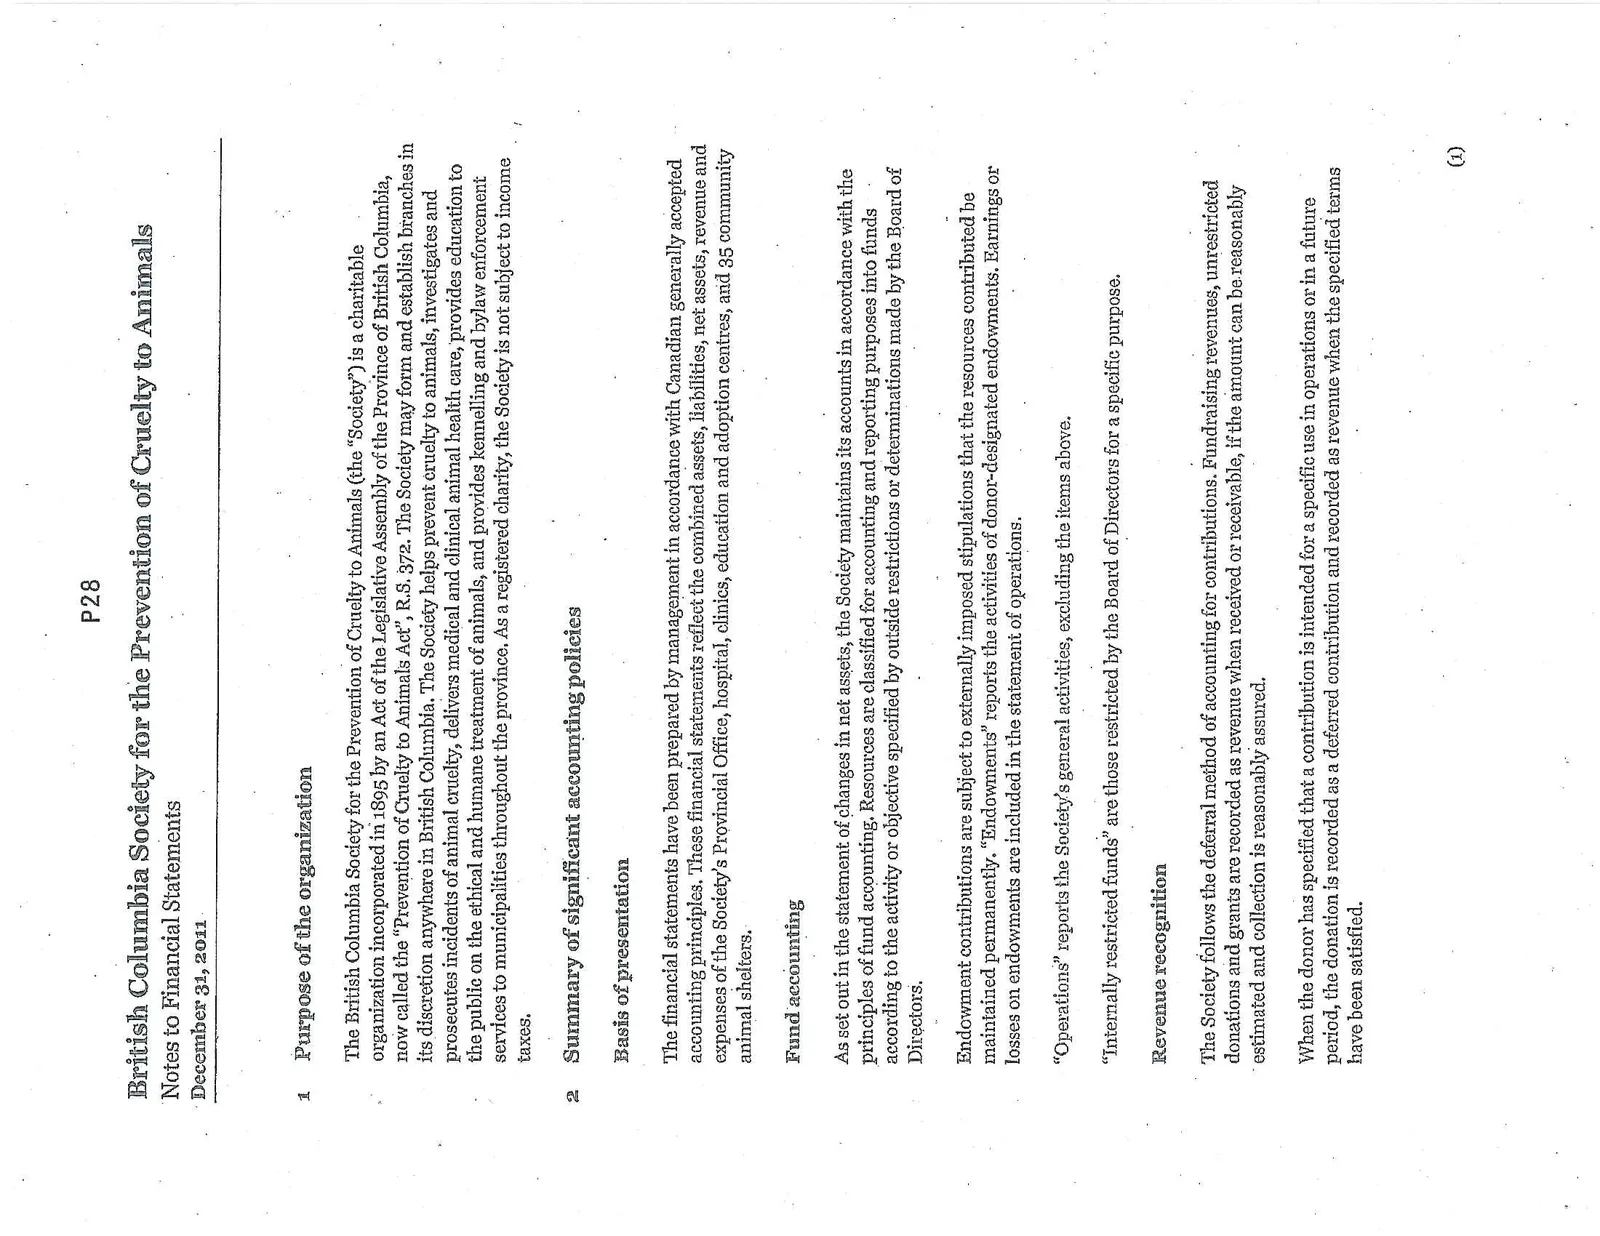
1 Purpose of the organization
The British Columbia Society for the Prevention of Cruelty to Animals (the “Society”) is a charitable organization incorporated in 1895 by an Act of the Legislative Assembly of the Province of British Columbia, now called the “Prevention of Cruelty to Animals Act”, R.S. 372. The Society may form and establish branches in its discretion anywhere in British Columbia. The Society helps prevent cruelty to animals, investigates and prosecutes incidents of animal cruelty, delivers medical and clinical animal health care, provides education to the public on the ethical and humane treatment of animals, and provides kennelling and bylaw enforcement services to municipalities throughout the province. As a registered charity, the Society is not subject to income taxes.
2 Summary of significant accounting policies
Basis of presentation The financial statements have been prepared by management in accordance with Canadian generally accepted accounting principles. These financial statements reflect the combined assets, liabilities, net assets, revenue and expenses of the Society’s Provincial Office, hospital, clinics, education and adoption centres, and 35 community animal shelters.
Fund accounting As set out in the statement of changes in net assets, the Society maintains its accounts in accordance with the principles of fund accounting. Resources are classified for accounting and reporting purposes into funds according to the activity or objective specified by outside restrictions or determinations made by the Board of Directors.
Endowment contributions are subject to externally imposed stipulations that the resources contributed be maintained permanently. “Endowments” reports the activities of donor-designated endowments. Earnings or losses on endowments are included in the statement of operations.
“Operations” reports the Society’s general activities, excluding the items above.
“Internally restricted funds” are those restricted by the Board of Directors for a specific purpose.
Revenue recognition The Society follows the deferral method of accounting for contributions. Fundraising revenues, unrestricted donations and grants are recorded as revenue when received or receivable, if the amount can be reasonably estimated and collection is reasonably assured.
When the donor has specified that a contribution is intended for a specific use in operations or in a future period, the donation is recorded as a deferred contribution and recorded as revenue when the specified terms have been satisfied.
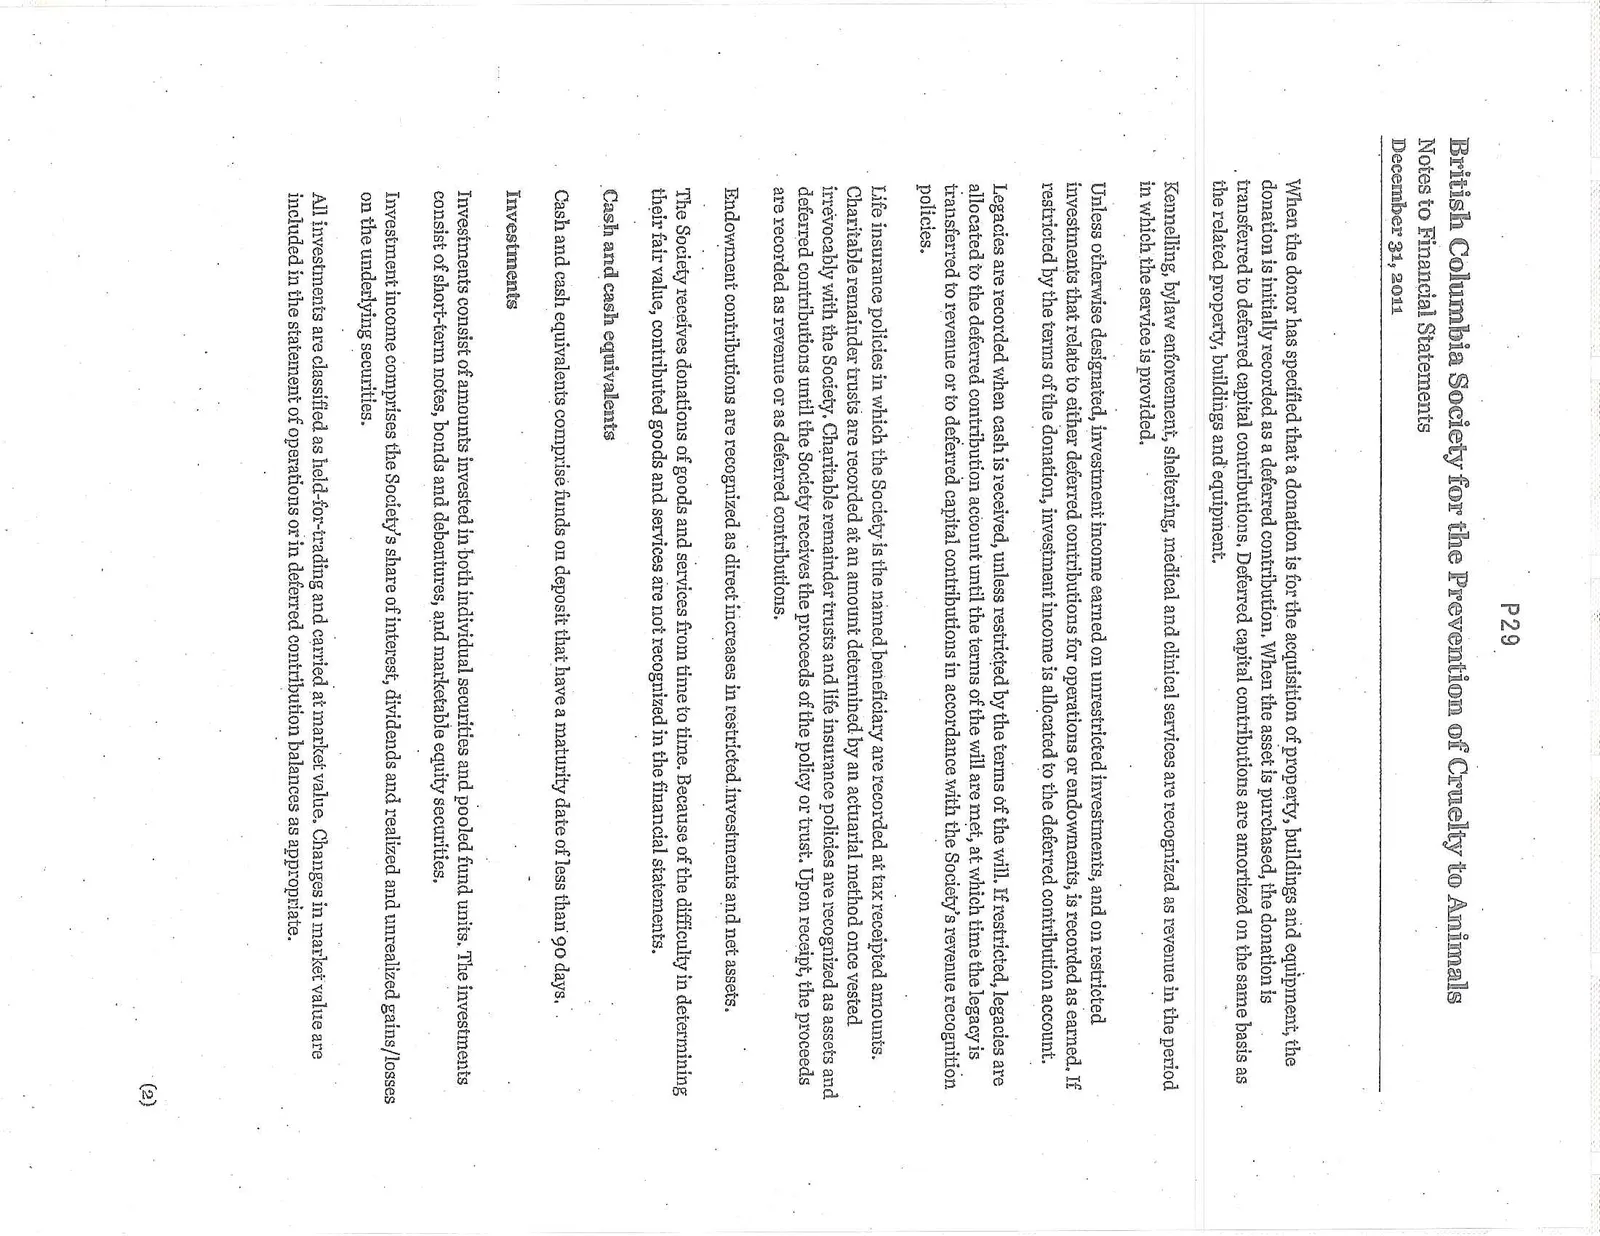
When the donor has specified that a donation is for the acquisition of property, buildings and equipment, the donation is initially recorded as a deferred contribution. When the asset is purchased, the donation is transferred to deferred capital contributions. Deferred capital contributions are amortized on the same basis as the related property, buildings and equipment.
Kennelling, bylaw enforcement, sheltering, medical and clinical services are recognized as revenue in the period in which the service is provided.
Unless otherwise designated, investment income earned on unrestricted investments, and on restricted investments that relate to either deferred contributions for operations or endowments, is recorded as earned. If restricted by the terms of the donation, investment income is allocated to the deferred contribution account.
Legacies are recorded when cash is received, unless restricted by the terms of the will. If restricted, legacies are allocated to the deferred contribution account until the terms of the will are met, at which time the legacy is transferred to revenue or to deferred capital contributions in accordance with the Society’s revenue recognition policies.
Life insurance policies in which the Society is the named beneficiary are recorded at tax receipted amounts. Charitable remainder trusts are recorded at an amount determined by an actuarial method once vested irrevocably with the Society. Charitable remainder trusts and life insurance policies are recognized as assets and deferred contributions until the Society receives the proceeds of the policy or trust. Upon receipt, the proceeds are recorded as revenue or as deferred contributions.
Endowment contributions are recognized as direct increases in restricted investments and net assets.
The Society receives donations of goods and services from time to time. Because of the difficulty in determining their fair value, contributed goods and services are not recognized in the financial statements.
Cash and cash equivalents Cash and cash equivalents comprise funds on deposit that have a maturity date of less than 90 days.
Investments Investments consist of amounts invested in both individual securities and pooled fund units. The investments consist of short-term notes, bonds and debentures, and marketable equity securities.
Investment income comprises the Society’s share of interest, dividends and realized and unrealized gains/losses on the underlying securities.
All investments are classified as held-for-trading and carried at market value. Changes in market value are included in the statement of operations or in deferred contribution balances as appropriate.
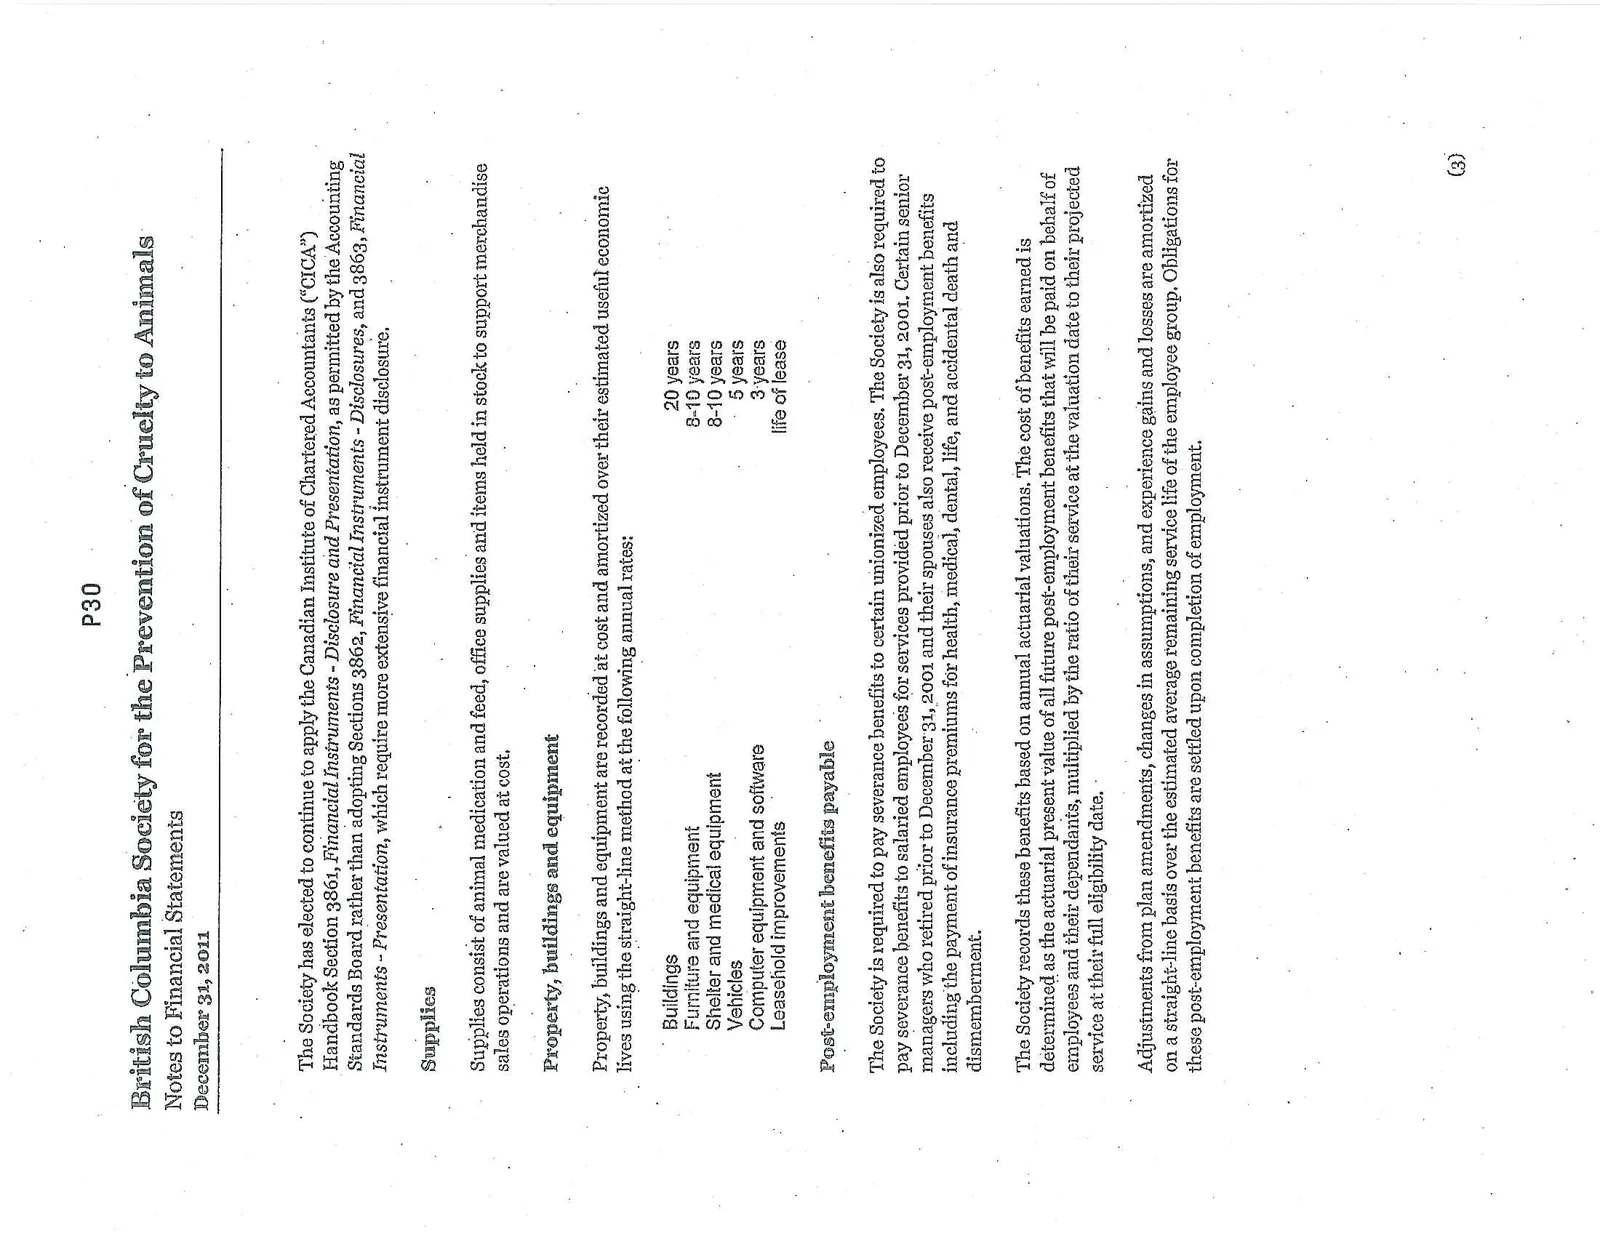
The Society has elected to continue to apply the Canadian Institute of Chartered Accountants (“CICA”) Handbook Section 3861, Financial Instruments - Disclosure and Presentation, as permitted by the Accounting Standards Board rather than adopting Sections 3862, Financial Instruments - Disclosures, and 3863, Financial Instruments - Presentation, which require more extensive financial instrument disclosure.
Supplies Supplies consist of animal medication and feed, office supplies and items held in stock to support merchandise sales operations and are valued at cost.
Property, buildings and equipment Property, buildings and equipment are recorded at cost and amortized over their estimated useful economic lives using the straight-line method at the following annual rates:
- Buildings: 20 years
- Furniture and equipment: 8-10 years
- Shelter and medical equipment: 8-10 years
- Vehicles: 5 years
- Computer equipment and software: 3 years
- Leasehold improvements: life of lease
Post-employment benefits payable The Society is required to pay severance benefits to certain unionized employees. The Society is also required to pay severance benefits to salaried employees for services provided prior to December 31, 2001. Certain senior managers who retired prior to December 31, 2001 and their spouses also receive post-employment benefits including the payment of insurance premiums for health, medical, dental, life, and accidental death and dismemberment.
The Society records these benefits based on annual actuarial valuations. The cost of benefits earned is determined as the actuarial present value of all future post-employment benefits that will be paid on behalf of employees and their dependants, multiplied by the ratio of their service at the valuation date to their projected service at their full eligibility date.
Adjustments from plan amendments, changes in assumptions, and experience gains and losses are amortized on a straight-line basis over the estimated average remaining service life of the employee group. Obligations for these post-employment benefits are settled upon completion of employment.
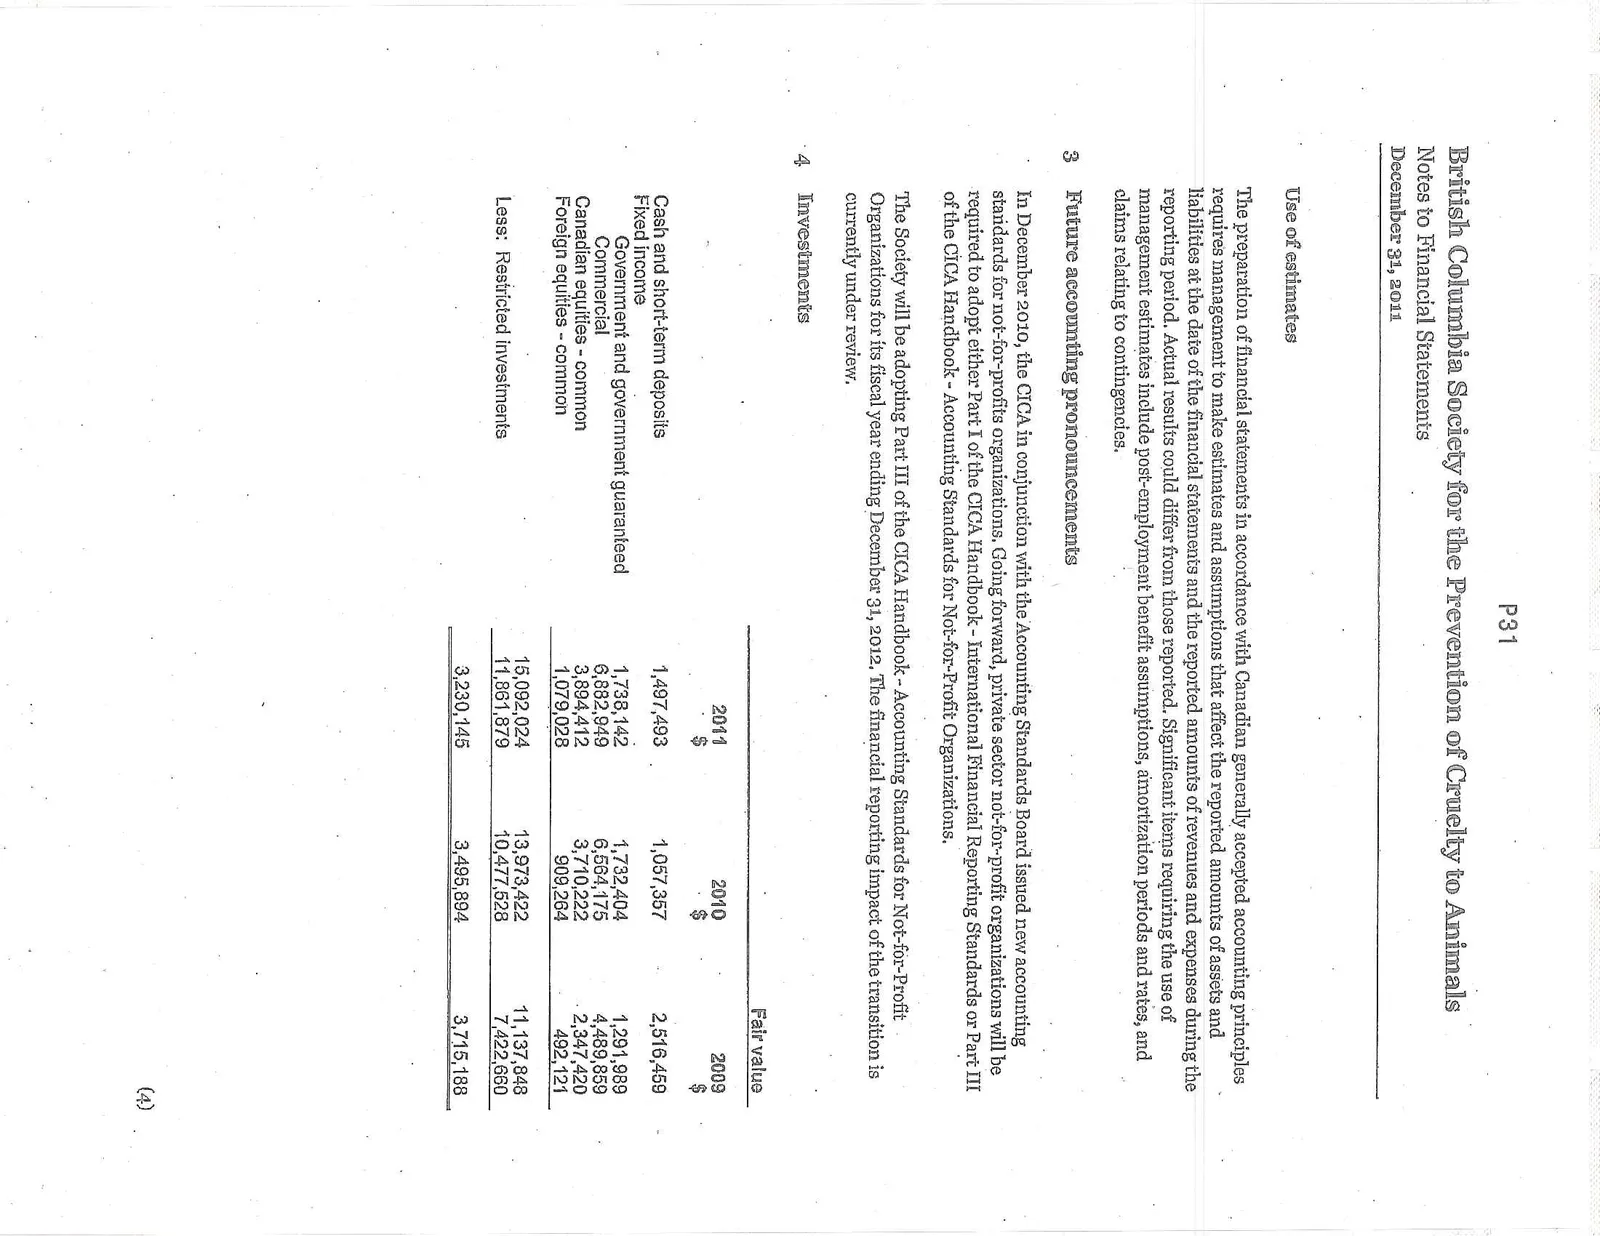
Use of estimates The preparation of financial statements in accordance with Canadian generally accepted accounting principles requires management to make estimates and assumptions that affect the reported amounts of assets and liabilities at the date of the financial statements and the reported amounts of revenues and expenses during the reporting period. Actual results could differ from those reported. Significant items requiring the use of management estimates include post-employment benefit assumptions, amortization periods and rates, and claims relating to contingencies.
3 Future accounting pronouncements
In December 2010, the CICA in conjunction with the Accounting Standards Board issued new accounting standards for not-for-profits organizations. Going forward, private sector not-for-profit organizations will be required to adopt either Part I of the CICA Handbook - International Financial Reporting Standards or Part III of the CICA Handbook - Accounting Standards for Not-for-Profit Organizations.
The Society will be adopting Part III of the CICA Handbook - Accounting Standards for Not-for-Profit Organizations for its fiscal year ending December 31, 2012. The financial reporting impact of the transition is currently under review.
4 Investments
Fair value
| 2011 $ | 2010 $ | 2009 $ | |
|---|---|---|---|
| Cash and short-term deposits | 1,497,493 | 1,057,357 | 2,516,459 |
| Fixed income | |||
| Government and government guaranteed | 1,738,142 | 1,732,404 | 1,291,989 |
| Commercial | 6,882,949 | 6,564,175 | 4,489,859 |
| Canadian equities - common | 3,894,412 | 3,710,222 | 2,347,420 |
| Foreign equities - common | 1,079,028 | 909,264 | 492,121 |
| 15,092,024 | 13,973,422 | 11,137,848 | |
| Less: Restricted investments | 11,861,879 | 10,477,528 | 7,422,660 |
| 3,230,145 | 3,495,894 | 3,715,188 |
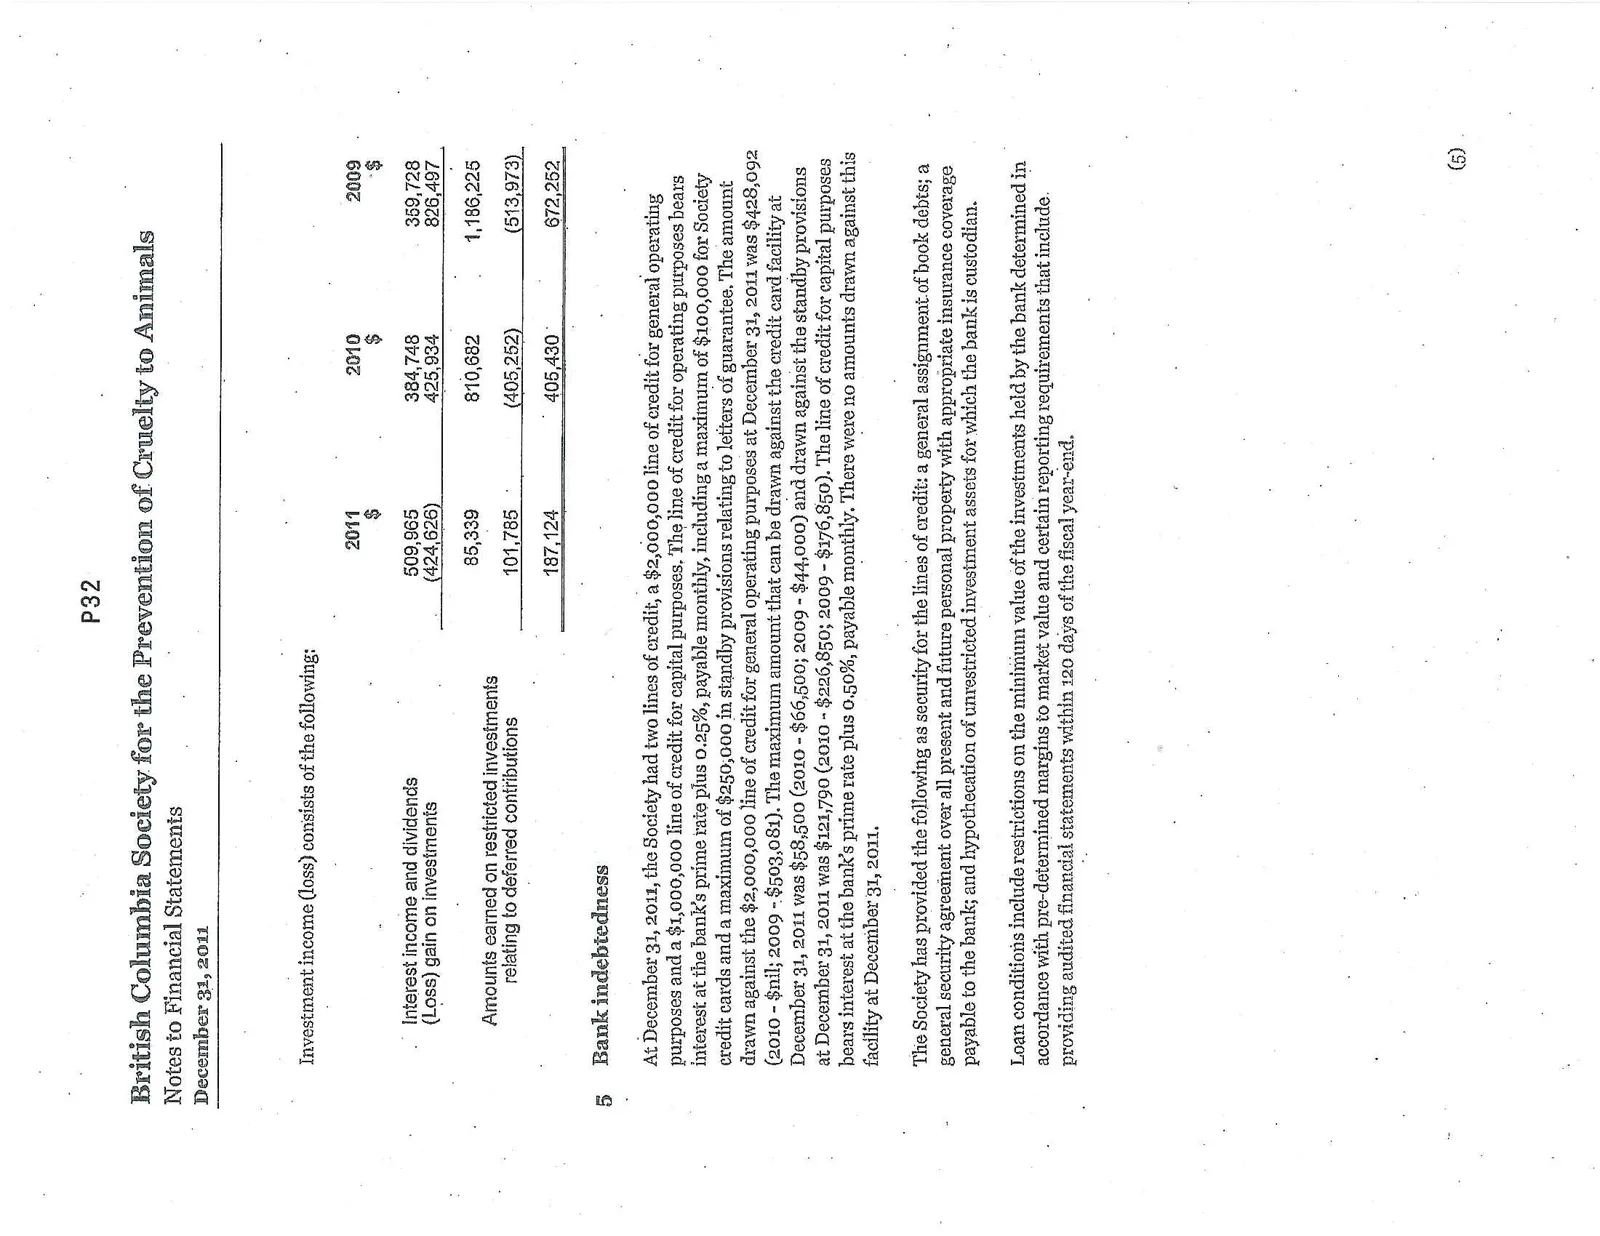
Investment income (loss) consists of the following:
| 2011 $ | 2010 $ | 2009 $ | |
|---|---|---|---|
| Interest income and dividends | 509,965 | 384,748 | 359,728 |
| (Loss) gain on investments | (424,626) | 425,934 | 826,497 |
| 85,339 | 810,682 | 1,186,225 | |
| Amounts earned on restricted investments relating to deferred contributions | 101,785 | (405,252) | (513,973) |
| 187,124 | 405,430 | 672,252 |
5 Bank indebtedness
At December 31, 2011, the Society had two lines of credit, a $2,000,000 line of credit for general operating purposes and a $1,000,000 line of credit for capital purposes. The line of credit for operating purposes bears interest at the bank’s prime rate plus 0.25%, payable monthly, including a maximum of $100,000 for Society credit cards and a maximum of $250,000 in standby provisions relating to letters of guarantee. The amount drawn against the $2,000,000 line of credit for general operating purposes at December 31, 2011 was $428,092 (2010 - $nil; 2009 - $503,081). The maximum amount that can be drawn against the credit card facility at December 31, 2011 was $58,500 (2010 - $66,500; 2009 - $44,000) and drawn against the standby provisions at December 31, 2011 was $121,790 (2010 - $226,850; 2009 - $176,850). The line of credit for capital purposes bears interest at the bank’s prime rate plus 0.50%, payable monthly. There were no amounts drawn against this facility at December 31, 2011.
The Society has provided the following as security for the lines of credit: a general assignment of book debts; a general security agreement over all present and future personal property with appropriate insurance coverage payable to the bank; and hypothecation of unrestricted investment assets for which the bank is custodian.
Loan conditions include restrictions on the minimum value of the investments held by the bank determined in accordance with pre-determined margins to market value and certain reporting requirements that include providing audited financial statements within 120 days of the fiscal year-end.
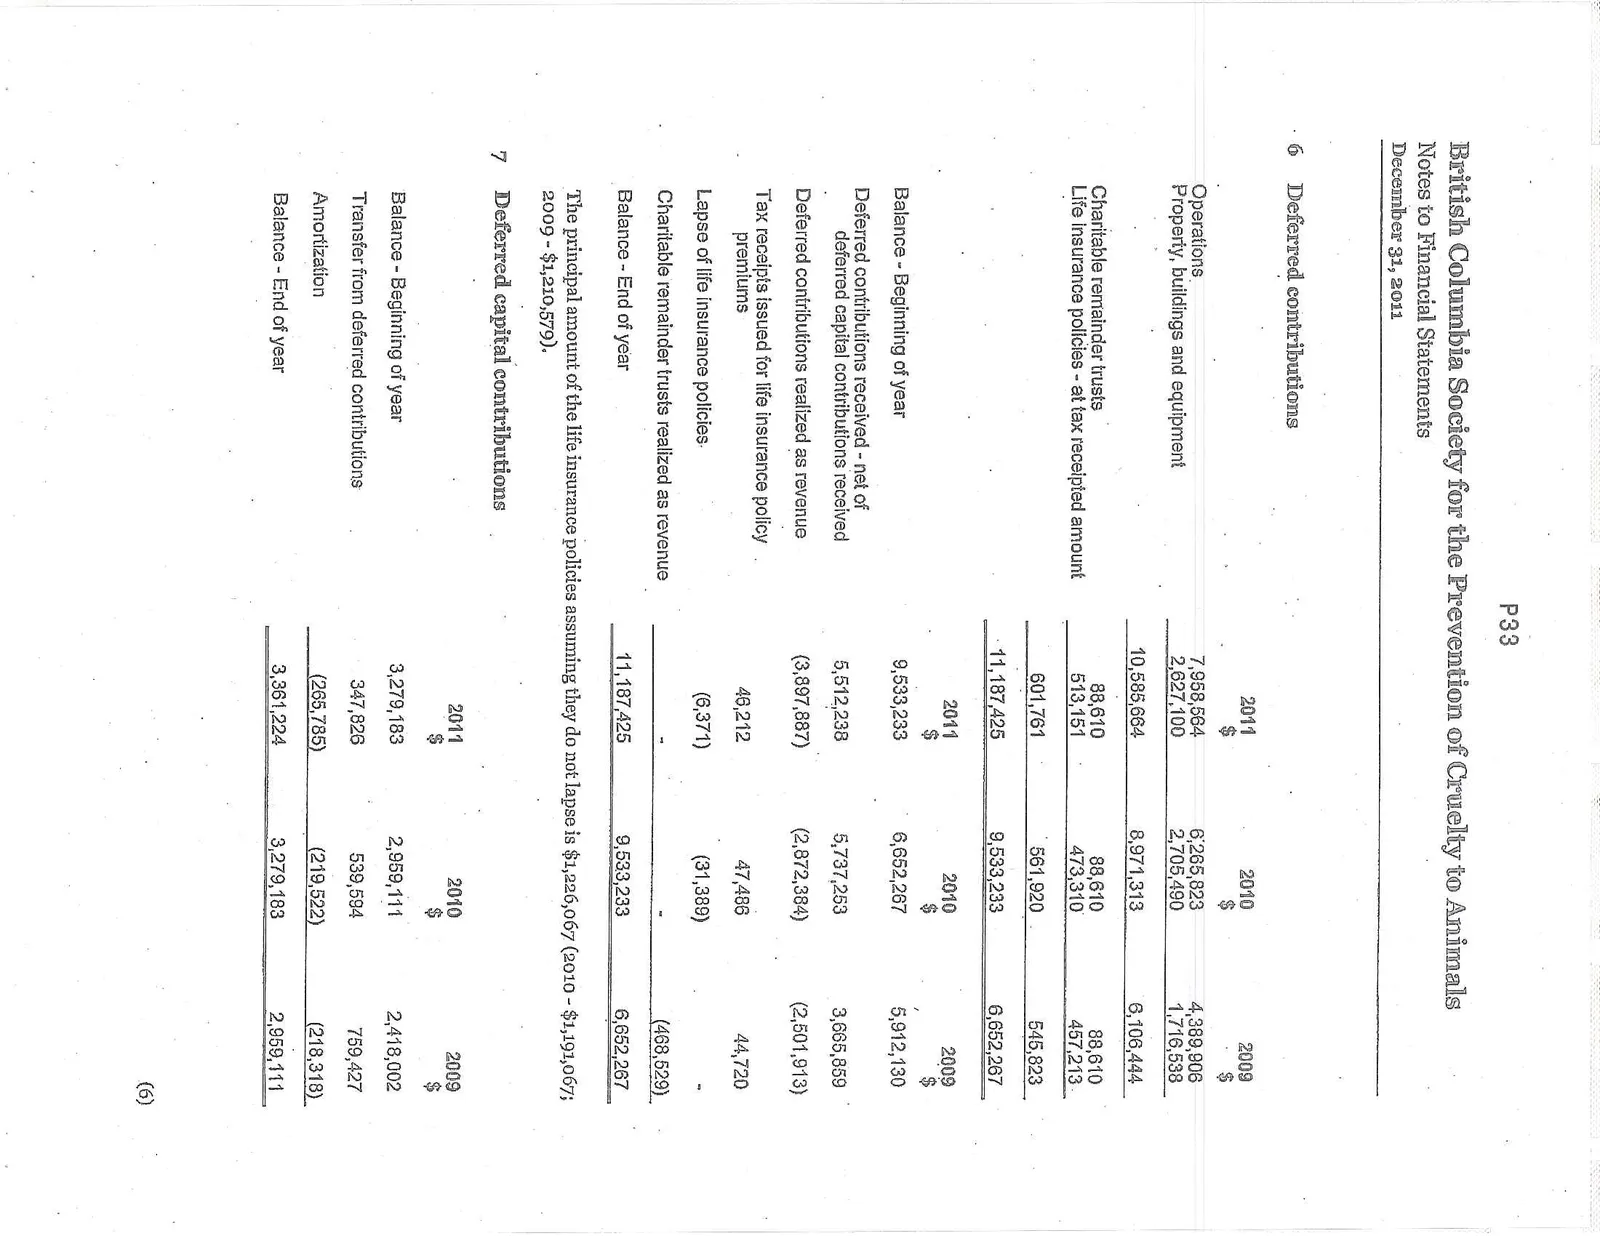
6 Deferred contributions
| 2011 $ | 2010 $ | 2009 $ | |
|---|---|---|---|
| Operations | 7,958,564 | 6,265,823 | 4,389,906 |
| Property, buildings and equipment | 2,627,100 | 2,705,490 | 1,716,538 |
| 10,585,664 | 8,971,313 | 6,106,444 | |
| Charitable remainder trusts | 88,610 | 88,610 | 88,610 |
| Life insurance policies - at tax receipted amount | 513,151 | 473,310 | 457,213 |
| 601,761 | 561,920 | 545,823 | |
| 11,187,425 | 9,533,233 | 6,652,267 |
| 2011 $ | 2010 $ | 2009 $ | |
|---|---|---|---|
| Balance - Beginning of year | 9,533,233 | 6,652,267 | 5,912,130 |
| Deferred contributions received - net of deferred capital contributions received | 5,512,238 | 5,737,253 | 3,665,859 |
| Deferred contributions realized as revenue | (3,897,887) | (2,872,384) | (2,501,913) |
| Tax receipts issued for life insurance policy premiums | 46,212 | 47,486 | 44,720 |
| Lapse of life insurance policies | (6,371) | (31,389) | — |
| Charitable remainder trusts realized as revenue | — | — | (468,529) |
| Balance - End of year | 11,187,425 | 9,533,233 | 6,652,267 |
The principal amount of the life insurance policies assuming they do not lapse is $1,226,067 (2010 - $1,191,067; 2009 - $1,210,579).
7 Deferred capital contributions
| 2011 $ | 2010 $ | 2009 $ | |
|---|---|---|---|
| Balance - Beginning of year | 3,279,183 | 2,959,111 | 2,418,002 |
| Transfer from deferred contributions | 347,826 | 539,594 | 759,427 |
| Amortization | (265,785) | (219,522) | (218,318) |
| Balance - End of year | 3,361,224 | 3,279,183 | 2,959,111 |
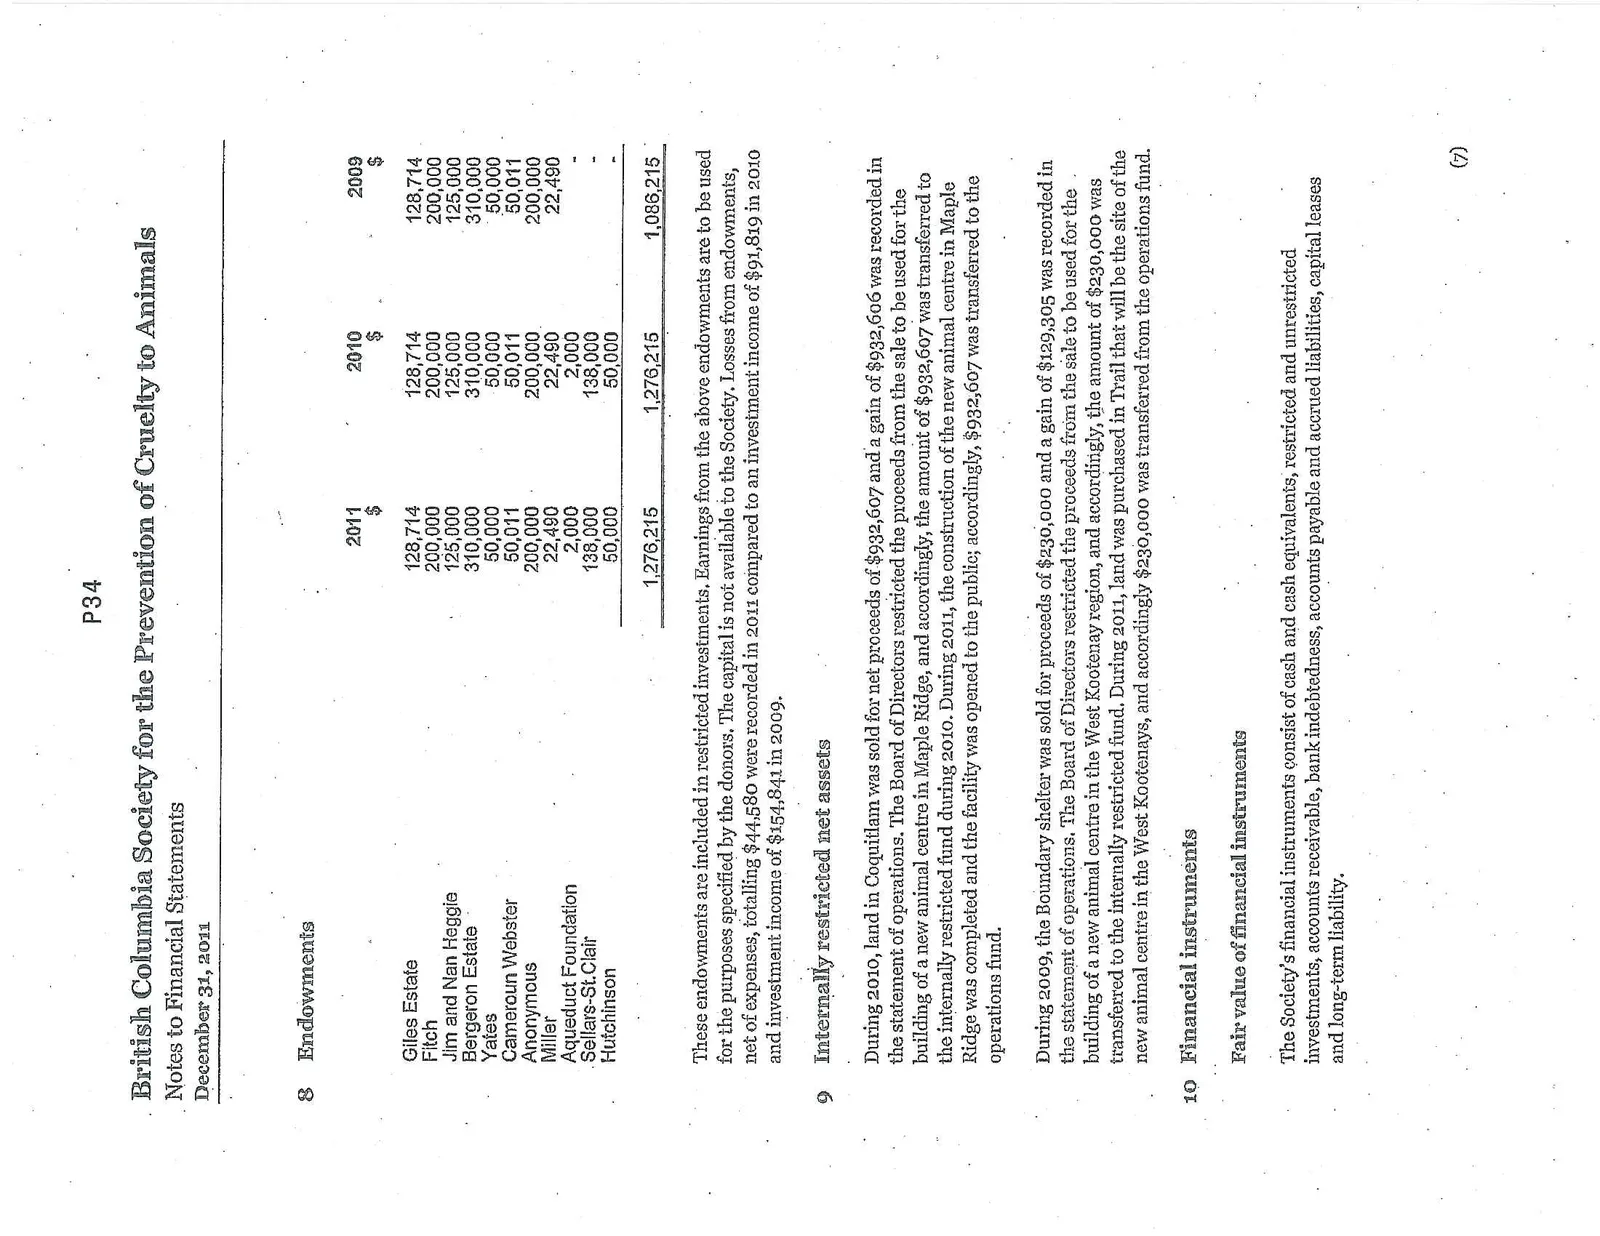
8 Endowments
| 2011 $ | 2010 $ | 2009 $ | |
|---|---|---|---|
| Giles Estate | 128,714 | 128,714 | 128,714 |
| Fitch | 200,000 | 200,000 | 200,000 |
| Jim and Nan Heggie | 125,000 | 125,000 | 125,000 |
| Bergeron Estate | 310,000 | 310,000 | 310,000 |
| Yates | 50,000 | 50,000 | 50,000 |
| Cameroun Webster | 50,011 | 50,011 | 50,011 |
| Anonymous | 200,000 | 200,000 | 200,000 |
| Miller | 22,490 | 22,490 | 22,490 |
| Aqueduct Foundation | 2,000 | 2,000 | — |
| Sellars-St. Clair | 138,000 | 138,000 | — |
| Hutchinson | 50,000 | 50,000 | — |
| 1,276,215 | 1,276,215 | 1,086,215 |
These endowments are included in restricted investments. Earnings from the above endowments are to be used for the purposes specified by the donors. The capital is not available to the Society. Losses from endowments, net of expenses, totalling $44,580 were recorded in 2011 compared to an investment income of $91,819 in 2010 and investment income of $154,841 in 2009.
9 Internally restricted net assets
During 2010, land in Coquitlam was sold for net proceeds of $932,607 and a gain of $932,606 was recorded in the statement of operations. The Board of Directors restricted the proceeds from the sale to be used for the building of a new animal centre in Maple Ridge, and accordingly, the amount of $932,607 was transferred to the internally restricted fund during 2010. During 2011, the construction of the new animal centre in Maple Ridge was completed and the facility was opened to the public; accordingly, $932,607 was transferred to the operations fund.
During 2009, the Boundary shelter was sold for proceeds of $230,000 and a gain of $129,305 was recorded in the statement of operations. The Board of Directors restricted the proceeds from the sale to be used for the building of a new animal centre in the West Kootenay region, and accordingly, the amount of $230,000 was transferred to the internally restricted fund. During 2011, land was purchased in Trail that will be the site of the new animal centre in the West Kootenays, and accordingly $230,000 was transferred from the operations fund.
10 Financial instruments
Fair value of financial instruments The Society’s financial instruments consist of cash and cash equivalents, restricted and unrestricted investments, accounts receivable, bank indebtedness, accounts payable and accrued liabilities, capital leases and long-term liability.
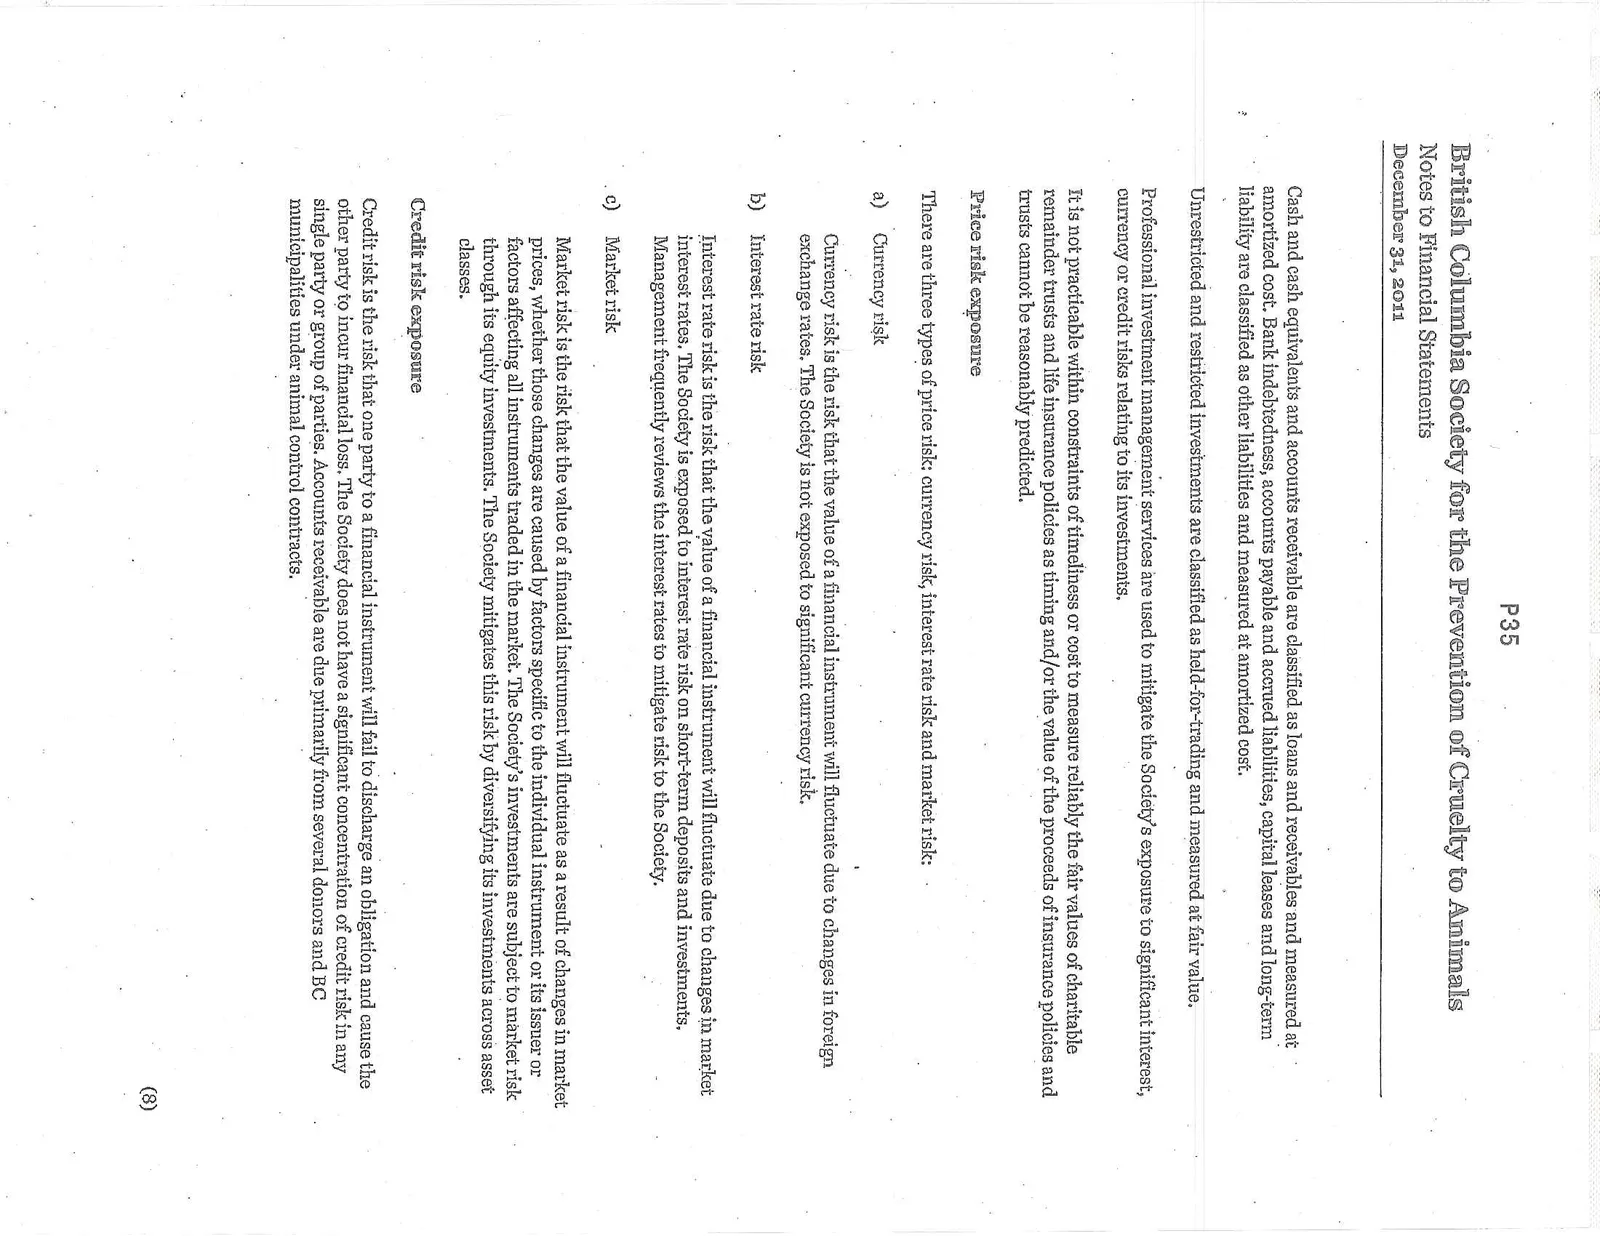
Cash and cash equivalents and accounts receivable are classified as loans and receivables and measured at amortized cost. Bank indebtedness, accounts payable and accrued liabilities, capital leases and long-term liability are classified as other liabilities and measured at amortized cost.
Unrestricted and restricted investments are classified as held-for-trading and measured at fair value.
Professional investment management services are used to mitigate the Society’s exposure to significant interest, currency or credit risks relating to its investments.
It is not practicable within constraints of timeliness or cost to measure reliably the fair values of charitable remainder trusts and life insurance policies as timing and/or the value of the proceeds of insurance policies and trusts cannot be reasonably predicted.
Price risk exposure There are three types of price risk: currency risk, interest rate risk and market risk:
- a) Currency risk Currency risk is the risk that the value of a financial instrument will fluctuate due to changes in foreign exchange rates. The Society is not exposed to significant currency risk.
- b) Interest rate risk Interest rate risk is the risk that the value of a financial instrument will fluctuate due to changes in market interest rates. The Society is exposed to interest rate risk on short-term deposits and investments. Management frequently reviews the interest rates to mitigate risk to the Society.
- c) Market risk Market risk is the risk that the value of a financial instrument will fluctuate as a result of changes in market prices, whether those changes are caused by factors specific to the individual instrument or its issuer or factors affecting all instruments traded in the market. The Society’s investments are subject to market risk through its equity investments. The Society mitigates this risk by diversifying its investments across asset classes.
Credit risk exposure Credit risk is the risk that one party to a financial instrument will fail to discharge an obligation and cause the other party to incur financial loss. The Society does not have a significant concentration of credit risk in any single party or group of parties. Accounts receivable are due primarily from several donors and BC municipalities under animal control contracts.
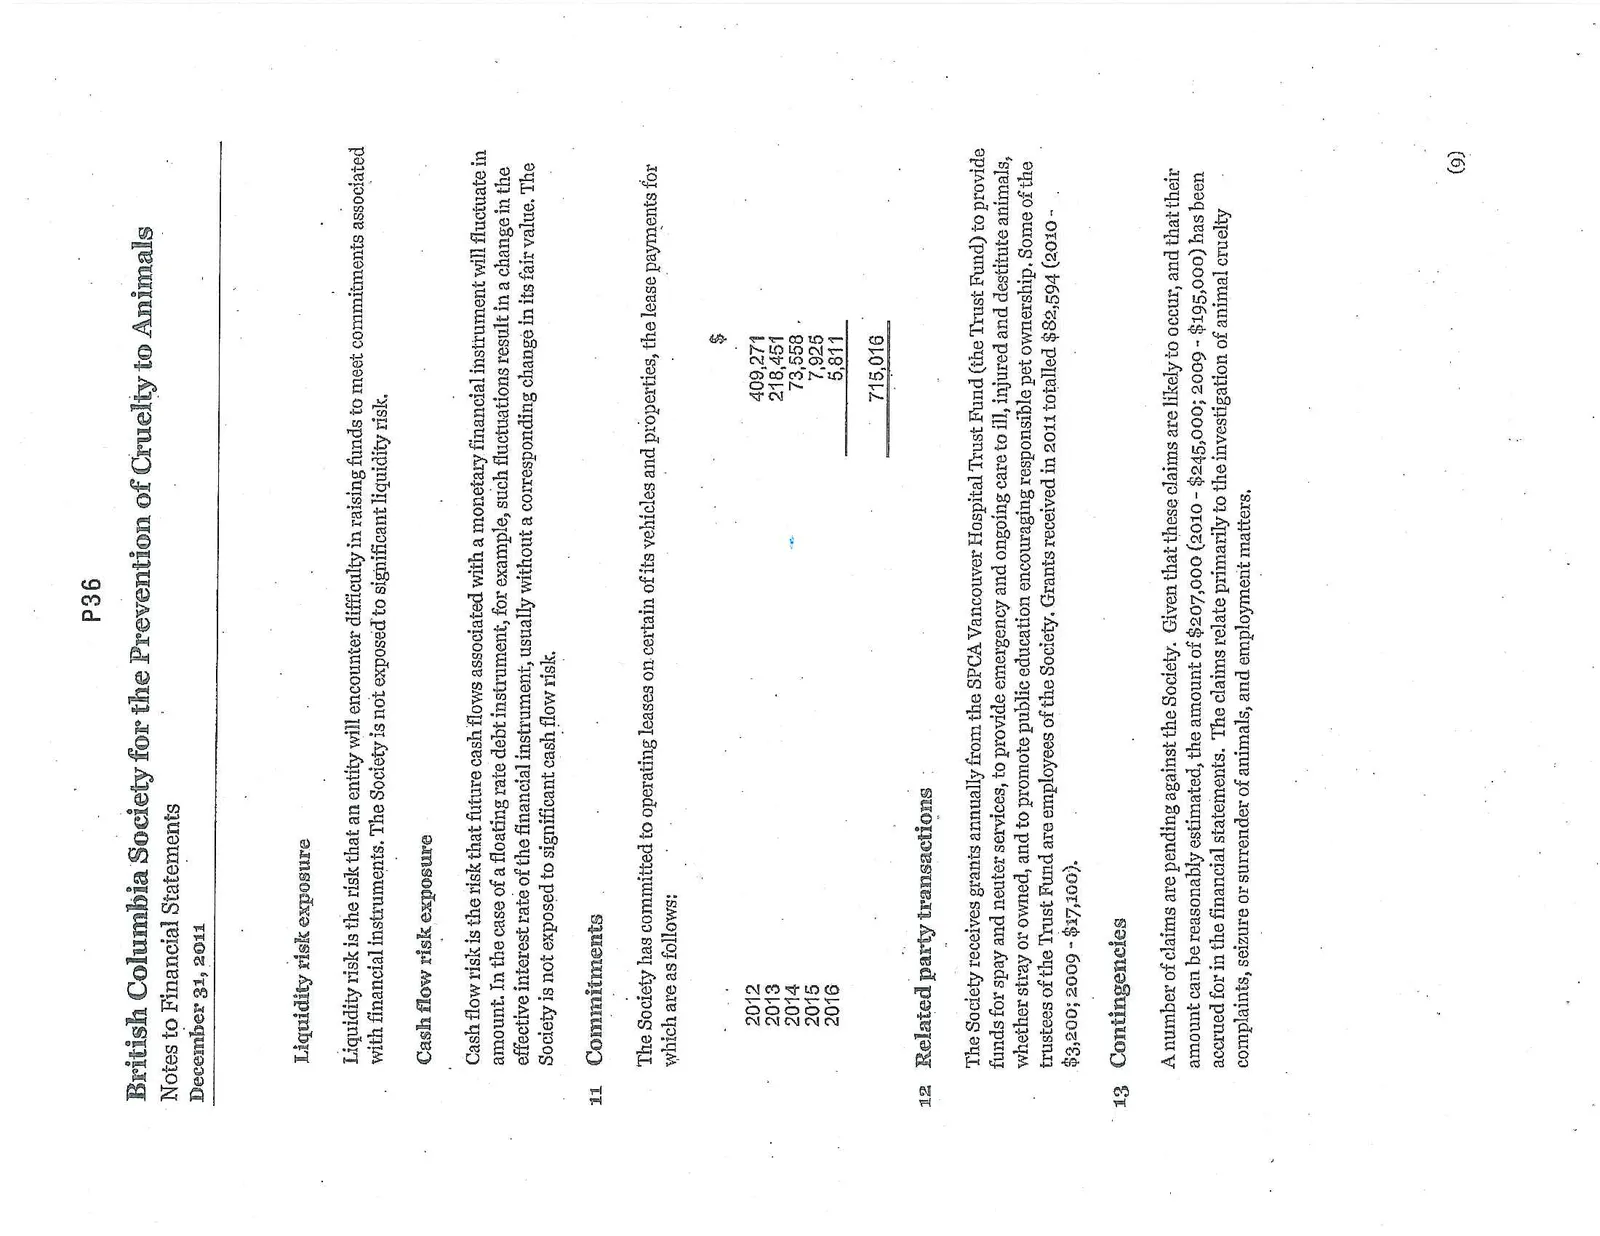
Liquidity risk exposure Liquidity risk is the risk that an entity will encounter difficulty in raising funds to meet commitments associated with financial instruments. The Society is not exposed to significant liquidity risk.
Cash flow risk exposure Cash flow risk is the risk that future cash flows associated with a monetary financial instrument will fluctuate in amount. In the case of a floating rate debt instrument, for example, such fluctuations result in a change in the effective interest rate of the financial instrument, usually without a corresponding change in its fair value. The Society is not exposed to significant cash flow risk.
11 Commitments
The Society has committed to operating leases on certain of its vehicles and properties, the lease payments for which are as follows:
| Year | $ |
|---|---|
| 2012 | 409,271 |
| 2013 | 218,451 |
| 2014 | 73,558 |
| 2015 | 7,925 |
| 2016 | 5,811 |
| Total | 715,016 |
12 Related party transactions
The Society receives grants annually from the SPCA Vancouver Hospital Trust Fund (the Trust Fund) to provide funds for spay and neuter services, to provide emergency and ongoing care to ill, injured and destitute animals, whether stray or owned, and to promote public education encouraging responsible pet ownership. Some of the trustees of the Trust Fund are employees of the Society. Grants received in 2011 totalled $82,594 (2010 - $3,200; 2009 - $17,100).
13 Contingencies
A number of claims are pending against the Society. Given that these claims are likely to occur, and that their amount can be reasonably estimated, the amount of $207,000 (2010 - $245,000; 2009 - $195,000) has been accrued for in the financial statements. The claims relate primarily to the investigation of animal cruelty complaints, seizure or surrender of animals, and employment matters.
14 Capital disclosures
The Society defines its capital as the amounts included in its net asset balances.
The Society’s objective when managing its capital is to safeguard the Society’s ability to continue as a going concern so that it can continue to provide the appropriate level of benefits and services to the animals and to the community as set out in note 1.
A portion of the Society’s capital is externally restricted in that the Society has to meet certain requirements in order to utilize this net asset balance as described in note 9. The Society has internal control processes to ensure that the restrictions are met prior to the utilization of these resources and it has been in compliance with these restrictions throughout the year.
The Society sets the amount of net assets for operations in proportion to risk to manage the net asset structure and makes adjustments to it in light of changes in economic conditions and its operating priorities.
See also note 5 with respect to covenants on bank indebtedness.
British Columbia Society for the Prevention of Cruelty to Animals
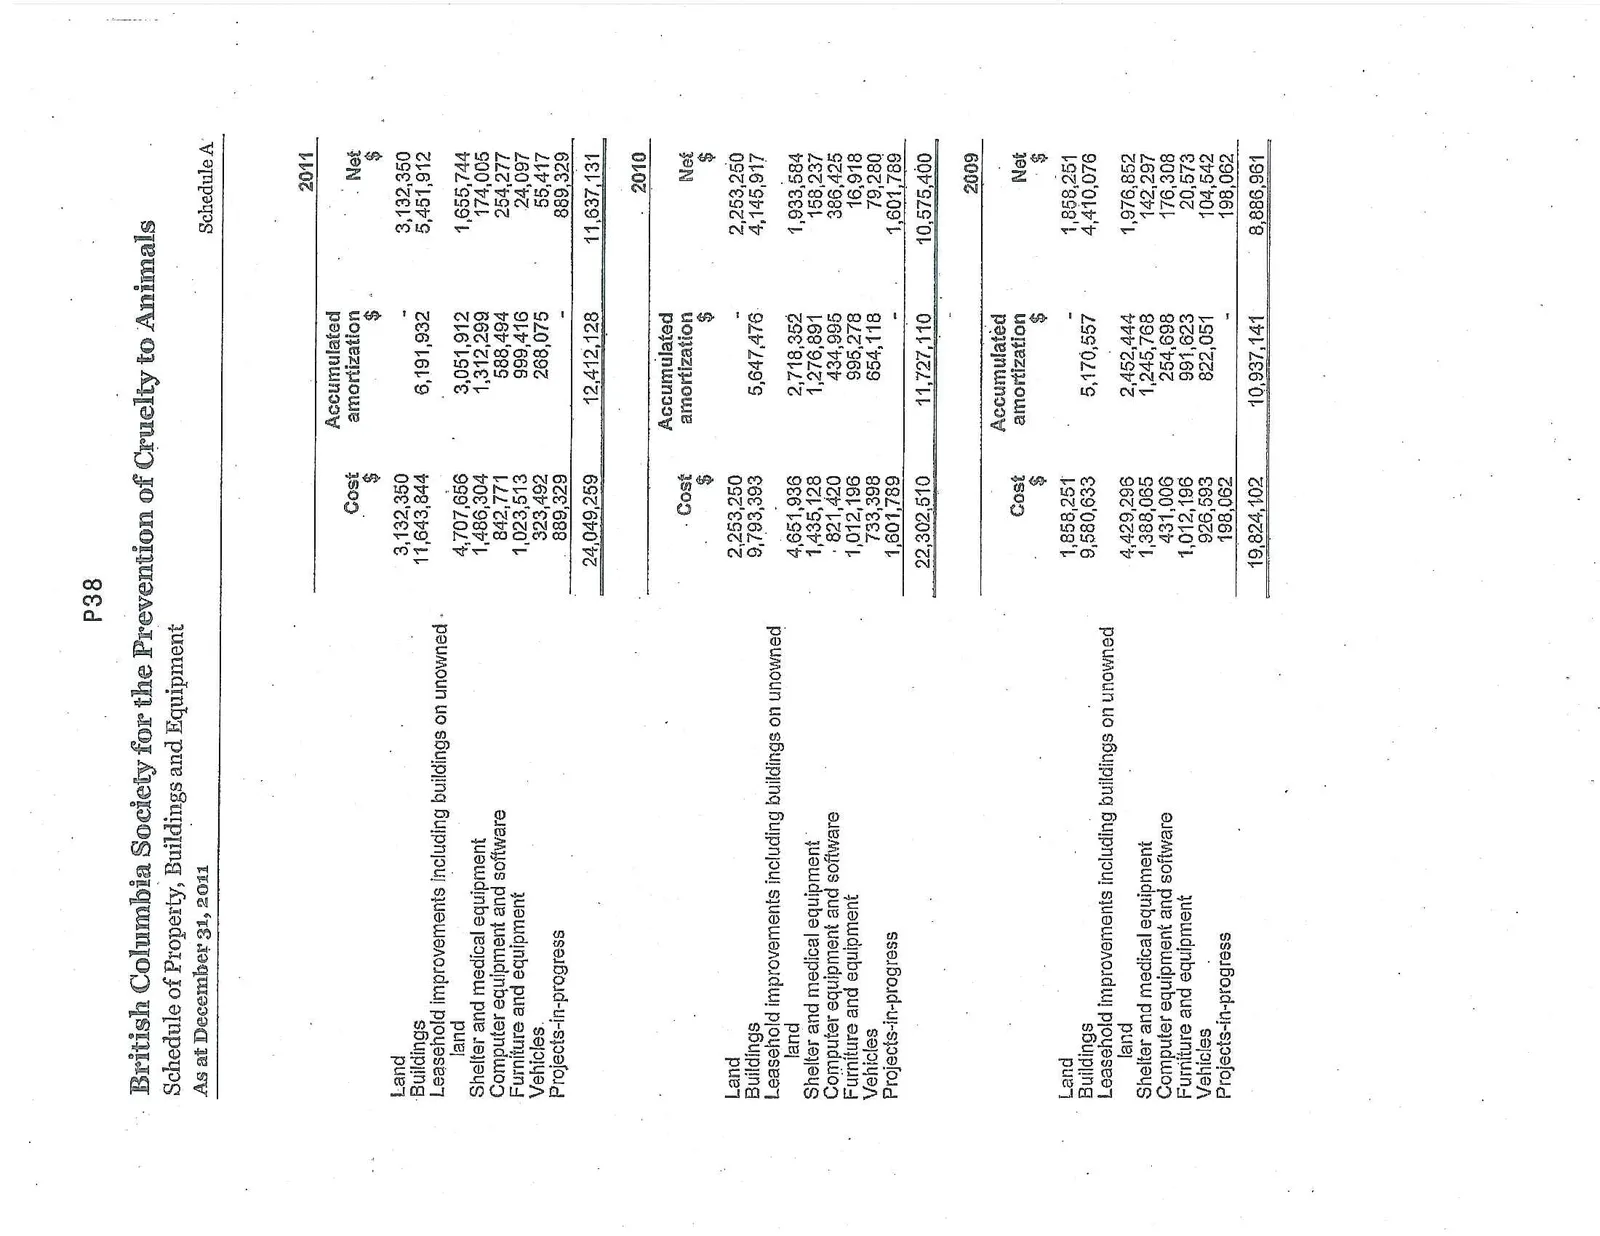
Schedule of Property, Buildings and Equipment As at December 31, 2011 Schedule A
| Cost $ | Accumulated amortization $ | Net $ | |
|---|---|---|---|
| 2011 | |||
| Land | 3,132,350 | — | 3,132,350 |
| Buildings | 11,643,844 | 6,191,932 | 5,451,912 |
| Leasehold improvements including buildings on unowned land | 4,707,656 | 3,051,912 | 1,655,744 |
| Shelter and medical equipment | 1,486,304 | 1,312,299 | 174,005 |
| Computer equipment and software | 842,771 | 588,494 | 254,277 |
| Furniture and equipment | 1,023,513 | 999,416 | 24,097 |
| Vehicles | 323,492 | 268,075 | 55,417 |
| Projects-in-progress | 889,329 | — | 889,329 |
| 24,049,259 | 12,412,128 | 11,637,131 | |
| 2010 | |||
| Land | 2,253,250 | — | 2,253,250 |
| Buildings | 9,793,393 | 5,647,476 | 4,145,917 |
| Leasehold improvements including buildings on unowned land | 4,651,936 | 2,718,352 | 1,933,584 |
| Shelter and medical equipment | 1,435,128 | 1,276,891 | 158,237 |
| Computer equipment and software | 821,420 | 434,995 | 386,425 |
| Furniture and equipment | 1,012,196 | 995,278 | 16,918 |
| Vehicles | 733,398 | 654,118 | 79,280 |
| Projects-in-progress | 1,601,789 | — | 1,601,789 |
| 22,302,510 | 11,727,110 | 10,575,400 | |
| 2009 | |||
| Land | 1,858,251 | — | 1,858,251 |
| Buildings | 9,580,633 | 5,170,557 | 4,410,076 |
| Leasehold improvements including buildings on unowned land | 4,429,296 | 2,452,444 | 1,976,852 |
| Shelter and medical equipment | 1,388,065 | 1,245,768 | 142,297 |
| Computer equipment and software | 431,006 | 254,698 | 176,308 |
| Furniture and equipment | 1,012,196 | 991,623 | 20,573 |
| Vehicles | 926,593 | 822,051 | 104,542 |
| Projects-in-progress | 198,062 | — | 198,062 |
| 19,824,102 | 10,937,141 | 8,886,961 |
British Columbia Society for the Prevention of Cruelty to Animals
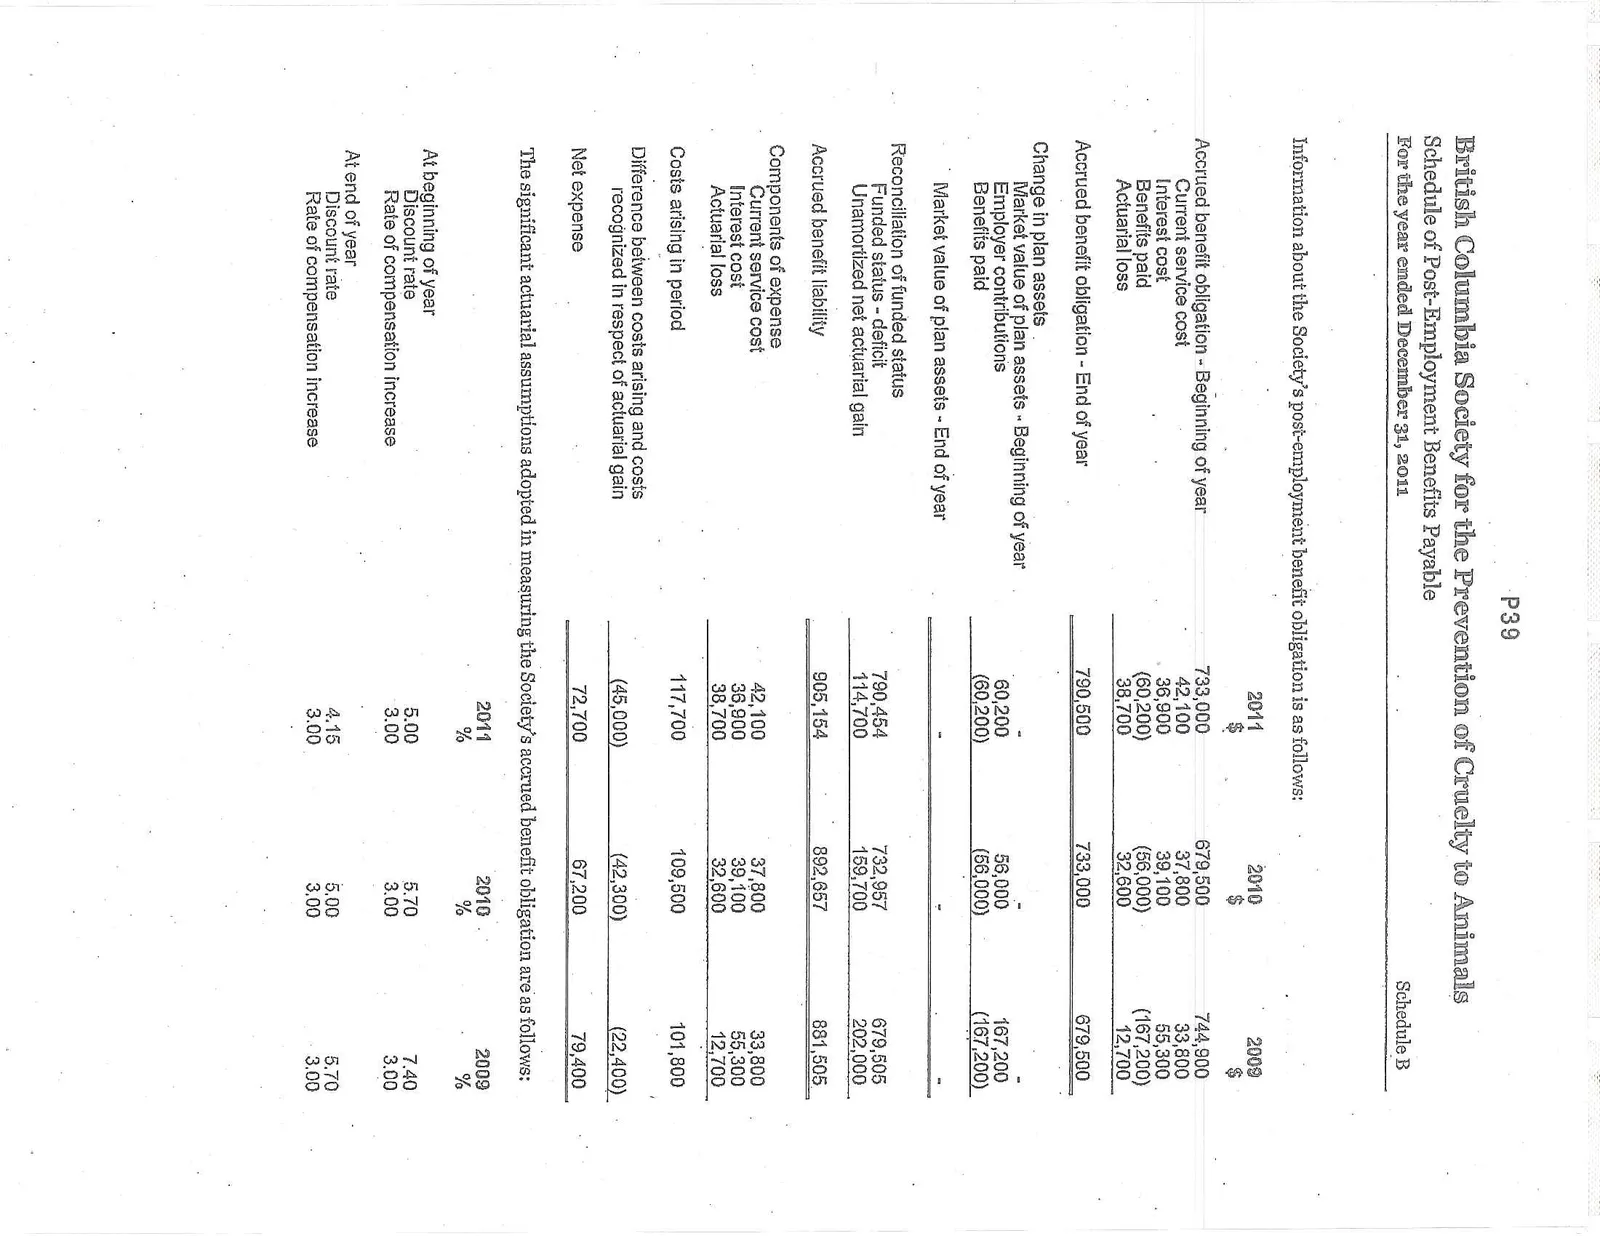
Schedule of Post-Employment Benefits Payable For the year ended December 31, 2011 Schedule B
Information about the Society’s post-employment benefit obligation is as follows:
| 2011 $ | 2010 $ | 2009 $ | |
|---|---|---|---|
| Accrued benefit obligation - Beginning of year | 733,000 | 679,500 | 744,900 |
| Current service cost | 42,100 | 37,800 | 33,800 |
| Interest cost | 36,900 | 39,100 | 55,300 |
| Benefits paid | (60,200) | (56,000) | (167,200) |
| Actuarial loss | 38,700 | 32,600 | 12,700 |
| Accrued benefit obligation - End of year | 790,500 | 733,000 | 679,500 |
| Change in plan assets | |||
| Market value of plan assets - Beginning of year | — | — | — |
| Employer contributions | 60,200 | 56,000 | 167,200 |
| Benefits paid | (60,200) | (56,000) | (167,200) |
| Market value of plan assets - End of year | — | — | — |
| Reconciliation of funded status | |||
| Funded status - deficit | 790,454 | 732,957 | 679,505 |
| Unamortized net actuarial gain | 114,700 | 159,700 | 202,000 |
| Accrued benefit liability | 905,154 | 892,657 | 881,505 |
| Components of expense | |||
| Current service cost | 42,100 | 37,800 | 33,800 |
| Interest cost | 36,900 | 39,100 | 55,300 |
| Actuarial loss | 38,700 | 32,600 | 12,700 |
| Costs arising in period | 117,700 | 109,500 | 101,800 |
| Difference between costs arising and costs recognized in respect of actuarial gain | (45,000) | (42,300) | (22,400) |
| Net expense | 72,700 | 67,200 | 79,400 |
The significant actuarial assumptions adopted in measuring the Society’s accrued benefit obligation are as follows:
| 2011 % | 2010 % | 2009 % | |
|---|---|---|---|
| At beginning of year | |||
| Discount rate | 5.00 | 5.70 | 7.40 |
| Rate of compensation increase | 3.00 | 3.00 | 3.00 |
| At end of year | |||
| Discount rate | 4.15 | 5.00 | 5.70 |
| Rate of compensation increase | 3.00 | 3.00 | 3.00 |
Document Images
(19)