Appendix
2026 BUILDING REPORT
A statistical summary of building permits, plumbing permits, and business licenses issued in February 2026, including comparisons to previous years.
February 2026Total permit fees for the month: $8,421.0014 Building Permits issued2 Plumbing Permits issued6 Business Licenses issued
2026 BUILDING REPORT
February
PART 9 PERMITS
| Permit Types | Constr. Value | Permit Fee | # of Permits |
|---|---|---|---|
| New Construction | |||
| Minor Projects - Residential | $300,000.00 | $3,338.00 | 1 |
| Minor Project - Commercial | |||
| Retaining Structures | |||
| Accessory Structures | |||
| Deck, Dock & Stairs | |||
| Woodburning Appliance | |||
| Pool | |||
| Building Move | |||
| Demolition | |||
| Renewals | |||
| Total | $300,000.00 | $3,338.00 | 1 |
PART 3 PERMITS
| Permit Types | Constr. Value | Permit Fee | # of Permits |
|---|---|---|---|
| New Construction | |||
| Minor Projects | $400,000.00 | $4,338.00 | 1 |
| Retaining Structures | |||
| Accessory Buildings | |||
| Deck, Dock & Stairs | |||
| Pool | |||
| Demolitons | |||
| Renewals | |||
| Total | $400,000.00 | $4,338.00 | 1 |

Building Month Totals
| Constr. Value | Permit Fee | # of Permits | |
|---|---|---|---|
| Part 9 Permits | $300,000.00 | $3,338.00 | 1 |
| Part 3 Permits | $400,000.00 | $4,338.00 | 1 |
| Total | $700,000.00 | $7,676.00 | 2 |
Plumbing
| Permit Fee | # of Permits | |
|---|---|---|
| Part 9 Plumbing | $360.00 | 2 |
| Part 3 Plumbing | ||
| Renewals | ||
| Total | $360.00 | 2 |
Totals to Date
| Constr. Value | Permit Fee | # of Permits | |
|---|---|---|---|
| Part 9 | 300,000.00 | 3,523.00 | 1 |
| Part 3 | 400,000.00 | 4,338.00 | 1 |
| Plumbing | 560.00 | 4 | |
| Building & Plumbing | $8,421.00 | $8,421.00 | 6 |
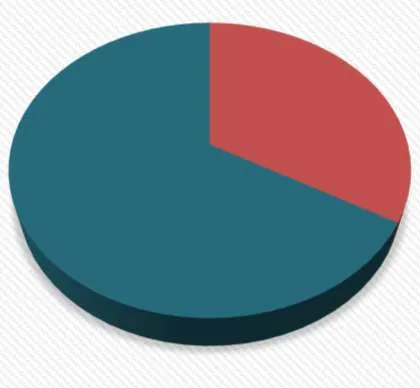
Monthly Permit Revenue Comparison
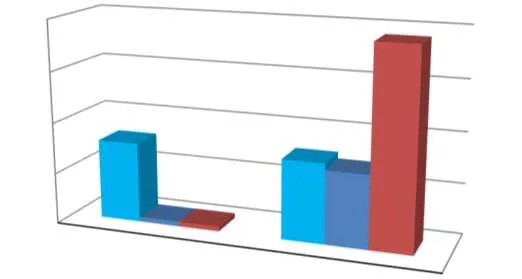
3yr Comparison of Issued Dwelling Units by Type
[Chart: 3yr Comparison of Issued Dwelling Units by Type bar chart showing units for 2024, 2025, and 2026 across various housing categories]
2026 Data Points:
- Single Family Dwelling: 2
- Secondary Suite: 3
- Garden Suite: 1
- Townhouse: 13
- Multifamily: 161
Annual Permit Revenue Comparison
[Chart: Annual Permit Revenue Comparison horizontal bar chart from 2017 to 2026]
- 2017: $481,464.92
- 2018: $509,006.90
- 2019: $196,640.36
- 2020: $202,756.46
- 2021: $312,343.91
- 2022: $497,721.15
- 2023: $1,092,708.50
- 2024: $538,965.50
- 2025: $60,545.05
- 2026: $8,421.00
Page 17
Extracted from: 2026 03 10 Committee of the Whole Meeting - Agenda - Pdf(18 pages total)