Bylaw
TOWN OF VIEW ROYAL BYLAW NO. 1168
Standalone copy of the Financial Plan Bylaw No. 1168 for its first, second, and third readings.
Bylaw No. 1168, 2026Authorizes the financial plan for the years 2026-2030
TOWN OF VIEW ROYAL BYLAW NO. 1168
A BYLAW TO AUTHORIZE THE FINANCIAL PLAN FOR THE YEARS 2026-2030
The Council of the Town of View Royal, in an open meeting assembled, enacts as follows:
- This Bylaw may be cited for all purposes as the “Financial Plan Bylaw No. 1168, 2026”.
- Schedule ‘A’, attached hereto and forming a part of this Bylaw, is hereby adopted as the Consolidated Financial Plan for the Town of View Royal for 2026 to 2030.
- Schedule ‘B’, attached hereto and forming a part of this Bylaw, is hereby adopted as the Consolidated Capital Plan for the Town of View Royal for 2026 to 2030.
- Schedule ‘C’, attached hereto and forming a part of this Bylaw, is hereby adopted as the Consolidated Reserves Plan for the Town of View Royal for 2026 to 2030.
- That authority to make expenditures and transfers in accordance with Schedules ‘A’, ‘B’ and ‘C’ of the Financial Plan is delegated to the Chief Administrative Officer and Director of Finance provided that corporate policies and procedures are followed.
- Schedule ‘D’, attached hereto and forming a part of this Bylaw, is hereby adopted as part of the Financial Plan for the Town of View Royal for 2026 to 2030.
READ A FIRST TIME THIS DAY OF , 2026.
READ A SECOND TIME THIS DAY OF , 2026.
READ A THIRD TIME THIS DAY OF , 2026.
ADOPTED BY COUNCIL, SIGNED BY THE MAYOR AND THE CORPORATE OFFICER AND SEALED WITH THE SEAL OF THE TOWN OF VIEW ROYAL THIS DAY OF , 2026.
Page 14–19
Schedule 'A'
Consolidated Financial Plan For the years 2026 to 2030
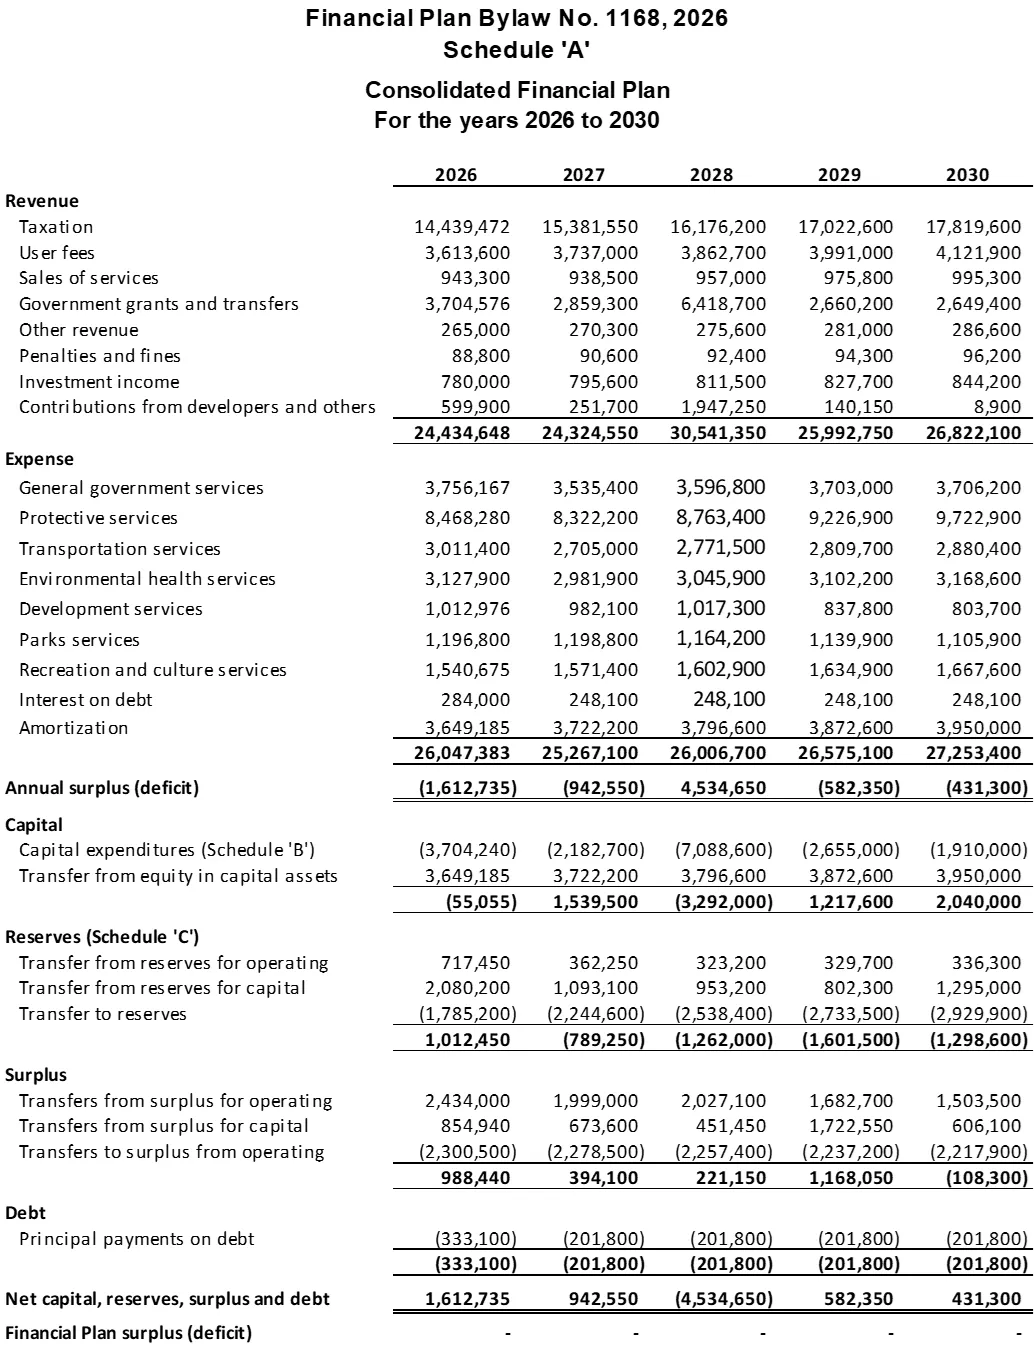
| Revenue | 2026 | 2027 | 2028 | 2029 | 2030 |
|---|---|---|---|---|---|
| Taxation | 14,439,472 | 15,381,550 | 16,176,200 | 17,022,600 | 17,819,600 |
| User fees | 3,613,600 | 3,737,000 | 3,862,700 | 3,991,000 | 4,121,900 |
| Sales of services | 943,300 | 938,500 | 957,000 | 975,800 | 995,300 |
| Government grants and transfers | 3,704,576 | 2,859,300 | 6,418,700 | 2,660,200 | 2,649,400 |
| Other revenue | 265,000 | 270,300 | 275,600 | 281,000 | 286,600 |
| Penalties and fines | 88,800 | 90,600 | 92,400 | 94,300 | 96,200 |
| Investment income | 780,000 | 795,600 | 811,500 | 827,700 | 844,200 |
| Contributions from developers and others | 599,900 | 251,700 | 1,947,250 | 140,150 | 8,900 |
| Total Revenue | 24,434,648 | 24,324,550 | 30,541,350 | 25,992,750 | 26,822,100 |
| Expense | |||||
| General government services | 3,756,167 | 3,535,400 | 3,596,800 | 3,703,000 | 3,706,200 |
| Protective services | 8,468,280 | 8,322,200 | 8,763,400 | 9,226,900 | 9,722,900 |
| Transportation services | 3,011,400 | 2,705,000 | 2,771,500 | 2,809,700 | 2,880,400 |
| Environmental health services | 3,127,900 | 2,981,900 | 3,045,900 | 3,102,200 | 3,168,600 |
| Development services | 1,012,976 | 982,100 | 1,017,300 | 837,800 | 803,700 |
| Parks services | 1,196,800 | 1,198,800 | 1,164,200 | 1,139,900 | 1,105,900 |
| Recreation and culture services | 1,540,675 | 1,571,400 | 1,602,900 | 1,634,900 | 1,667,600 |
| Interest on debt | 284,000 | 248,100 | 248,100 | 248,100 | 248,100 |
| Amortization | 3,649,185 | 3,722,200 | 3,796,600 | 3,872,600 | 3,950,000 |
| Total Expense | 26,047,383 | 25,267,100 | 26,006,700 | 26,575,100 | 27,253,400 |
| Annual surplus (deficit) | (1,612,735) | (942,550) | 4,534,650 | (582,350) | (431,300) |
| Capital | |||||
| Capital expenditures (Schedule 'B') | (3,704,240) | (2,182,700) | (7,088,600) | (2,655,000) | (1,910,000) |
| Transfer from equity in capital assets | 3,649,185 | 3,722,200 | 3,796,600 | 3,872,600 | 3,950,000 |
| (55,055) | 1,539,500 | (3,292,000) | 1,217,600 | 2,040,000 | |
| Reserves (Schedule 'C') | |||||
| Transfer from reserves for operating | 717,450 | 362,250 | 323,200 | 329,700 | 336,300 |
| Transfer from reserves for capital | 2,080,200 | 1,093,100 | 953,200 | 802,300 | 1,295,000 |
| Transfer to reserves | (1,785,200) | (2,244,600) | (2,538,400) | (2,733,500) | (2,929,900) |
| 1,012,450 | (789,250) | (1,262,000) | (1,601,500) | (1,298,600) | |
| Surplus | |||||
| Transfers from surplus for operating | 2,434,000 | 1,999,000 | 2,027,100 | 1,682,700 | 1,503,500 |
| Transfers from surplus for capital | 854,940 | 673,600 | 451,450 | 1,722,550 | 606,100 |
| Transfers to surplus from operating | (2,300,500) | (2,278,500) | (2,257,400) | (2,237,200) | (2,217,900) |
| 988,440 | 394,100 | 221,150 | 1,168,050 | (108,300) | |
| Debt | |||||
| Principal payments on debt | (333,100) | (201,800) | (201,800) | (201,800) | (201,800) |
| (333,100) | (201,800) | (201,800) | (201,800) | (201,800) | |
| Net capital, reserves, surplus and debt | 1,612,735 | 942,550 | (4,534,650) | 582,350 | 431,300 |
| Financial Plan surplus (deficit) | - | - | - | - | - |
Page 14–19
Schedule 'B'
Consolidated Capital Plan For the years 2026 to 2030
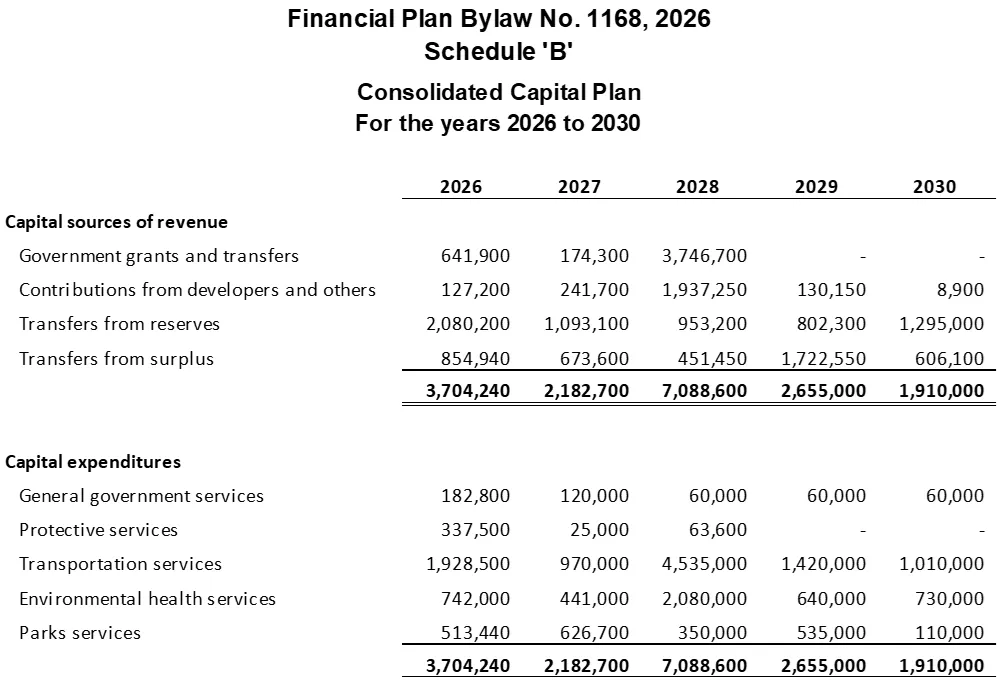
| Capital sources of revenue | 2026 | 2027 | 2028 | 2029 | 2030 |
|---|---|---|---|---|---|
| Government grants and transfers | 641,900 | 174,300 | 3,746,700 | - | - |
| Contributions from developers and others | 127,200 | 241,700 | 1,937,250 | 130,150 | 8,900 |
| Transfers from reserves | 2,080,200 | 1,093,100 | 953,200 | 802,300 | 1,295,000 |
| Transfers from surplus | 854,940 | 673,600 | 451,450 | 1,722,550 | 606,100 |
| Total | 3,704,240 | 2,182,700 | 7,088,600 | 2,655,000 | 1,910,000 |
| Capital expenditures | |||||
| General government services | 182,800 | 120,000 | 60,000 | 60,000 | 60,000 |
| Protective services | 337,500 | 25,000 | 63,600 | - | - |
| Transportation services | 1,928,500 | 970,000 | 4,535,000 | 1,420,000 | 1,010,000 |
| Environmental health services | 742,000 | 441,000 | 2,080,000 | 640,000 | 730,000 |
| Parks services | 513,440 | 626,700 | 350,000 | 535,000 | 110,000 |
| Total | 3,704,240 | 2,182,700 | 7,088,600 | 2,655,000 | 1,910,000 |
Page 14–19
Schedule 'C'
Consolidated Capital Plan For the years 2026 to 2030
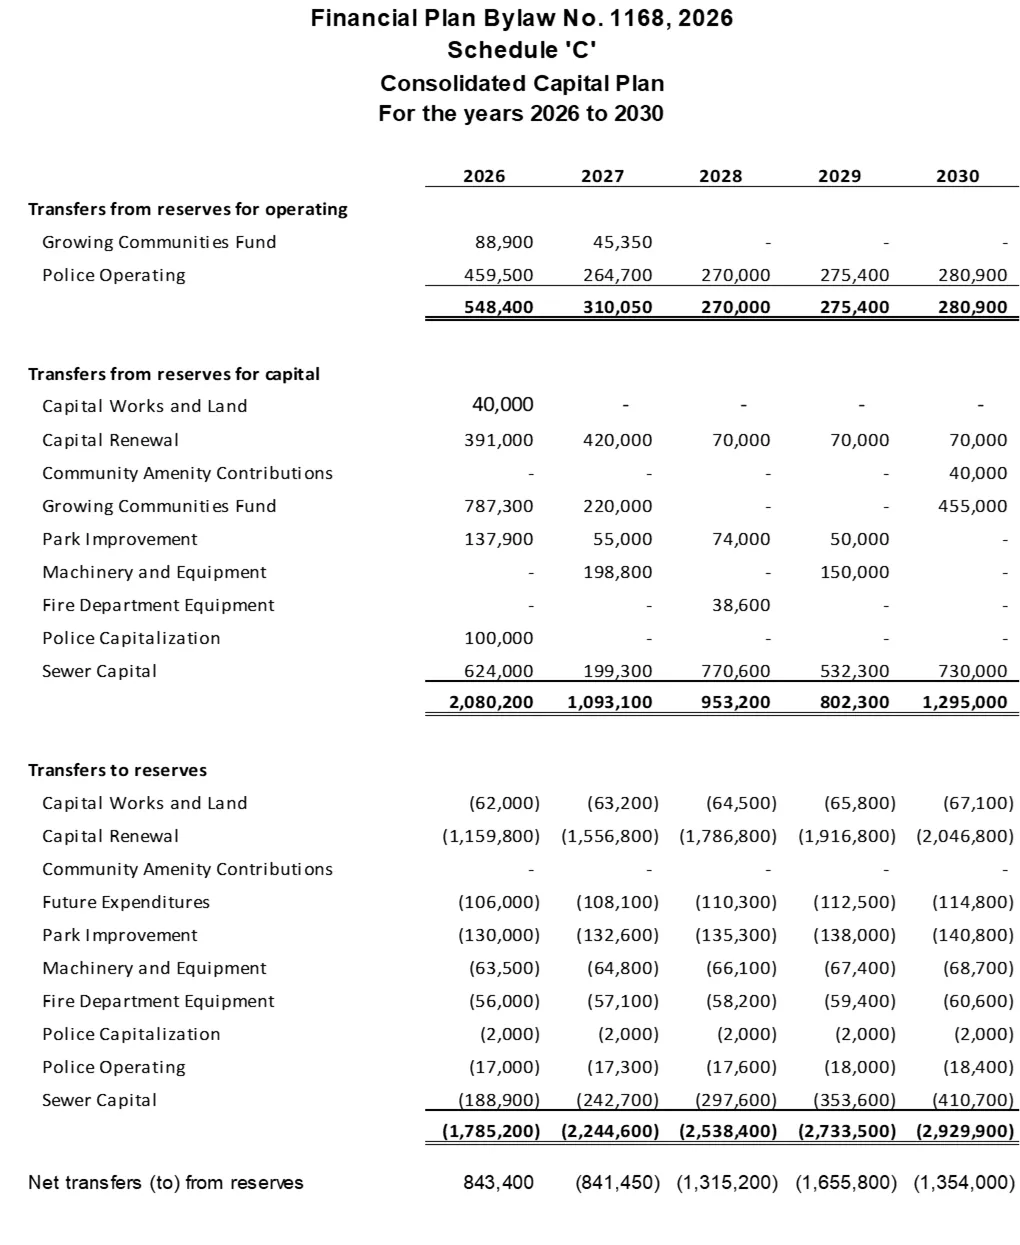
| Transfers from reserves for operating | 2026 | 2027 | 2028 | 2029 | 2030 |
|---|---|---|---|---|---|
| Growing Communities Fund | 88,900 | 45,350 | - | - | - |
| Police Operating | 459,500 | 264,700 | 270,000 | 275,400 | 280,900 |
| 548,400 | 310,050 | 270,000 | 275,400 | 280,900 | |
| Transfers from reserves for capital | |||||
| Capital Works and Land | 40,000 | - | - | - | - |
| Capital Renewal | 391,000 | 420,000 | 70,000 | 70,000 | 70,000 |
| Community Amenity Contributions | - | - | - | - | 40,000 |
| Growing Communities Fund | 787,300 | 220,000 | - | - | 455,000 |
| Park Improvement | 137,900 | 55,000 | 74,000 | 50,000 | - |
| Machinery and Equipment | - | 198,800 | - | 150,000 | - |
| Fire Department Equipment | - | - | 38,600 | - | - |
| Police Capitalization | 100,000 | - | - | - | - |
| Sewer Capital | 624,000 | 199,300 | 770,600 | 532,300 | 730,000 |
| 2,080,200 | 1,093,100 | 953,200 | 802,300 | 1,295,000 | |
| Transfers to reserves | |||||
| Capital Works and Land | (62,000) | (63,200) | (64,500) | (65,800) | (67,100) |
| Capital Renewal | (1,159,800) | (1,556,800) | (1,786,800) | (1,916,800) | (2,046,800) |
| Community Amenity Contributions | - | - | - | - | - |
| Future Expenditures | (106,000) | (108,100) | (110,300) | (112,500) | (114,800) |
| Park Improvement | (130,000) | (132,600) | (135,300) | (138,000) | (140,800) |
| Machinery and Equipment | (63,500) | (64,800) | (66,100) | (67,400) | (68,700) |
| Fire Department Equipment | (56,000) | (57,100) | (58,200) | (59,400) | (60,600) |
| Police Capitalization | (2,000) | (2,000) | (2,000) | (2,000) | (2,000) |
| Police Operating | (17,000) | (17,300) | (17,600) | (18,000) | (18,400) |
| Sewer Capital | (188,900) | (242,700) | (297,600) | (353,600) | (410,700) |
| (1,785,200) | (2,244,600) | (2,538,400) | (2,733,500) | (2,929,900) | |
| Net transfers (to) from reserves | 843,400 | (841,450) | (1,315,200) | (1,655,800) | (1,354,000) |
Page 14–19
Schedule ‘D’
Financial Plan Objectives and Policies
Funding Sources
Objectives
- The Town of View Royal will be financially sustainable.
- The Town of View Royal will reduce its use of casino grant funding for delivery of ongoing operational services and focus the casino grant funding priority on acquisition, renewal, or replacement of municipal infrastructure.
Policies
- The Town of View Royal will examine municipal services to determine the suitability of user fees as the primary source of funding. Property value taxes will fund annual operations that would be difficult or undesirable to fund on a user-pay basis.
- The Town of View Royal will examine the life cycle costs of all new infrastructure and new services before initiating. Operating, maintenance, and replacement costs for all existing infrastructure will be included in its five-year financial plan.
- Services funded by user fees shall pay an administration fee.
Proposed proportion of total revenue from each source (five-year average)
| Revenue source | % of Total Revenue |
|---|---|
| Property value taxes | 61% |
| User fees | 15% |
| Other revenue | 24% |
| Total | 100% |
Distribution of Property Value Taxes
Objectives
- To ensure property value taxes remain affordable and reasonable for services provided.
- To maintain consistent tax burden for all property classes.
Policies
- Regularly review the affordability of property value taxes for each property class relative to other classes.
- Regularly review and compare the Town of View Royal’s distributions of tax burden relative to other municipalities in the region and historically.
Permissive Tax Exemptions
Objective
To enhance the quality of life (economic, social and cultural) in View Royal by providing financial assistance to organizations that serve this objective.
Policies
- Eligible organizations include non-profit and charitable or philanthropic organizations, athletic or service clubs or associations and places of worship and care facilities whose use of exempted land and improvements must provide a benefit to the community.
- Permissive tax exemptions may be provided for land, improvements, or both for a period up to ten years where it is demonstrated that the services or benefits offered to the community are of a similar duration.
- Council may impose conditions on the exempted land or improvements or both to effect a particular desired outcome deemed to be of benefit to the community.
- Applications for permissive tax exemptions must be consistent with municipal policies, plans, bylaws and regulations.
Page 14–19
Document Images
(1)
Extracted from: 2026 04 21 Council Meeting - Agenda - Pdf(124 pages total)