Appendix
2026 BUILDING REPORT - May
Statistical summary of building permits issued and related revenue for the month of May 2026.
May 2026Total permit revenue to date: $437,333.2212 Part 9 permits issued in the month2 Part 3 permits issued in the month
2026 BUILDING REPORT - May
PART 9 PERMITS
| Permit Types | Constr. Value | Permit Fee | # of Permits |
|---|---|---|---|
| New Construction | |||
| Minor Projects - Residential | $48,207.00 | $777.59 | 2 |
| Minor Project - Commercial | |||
| Retaining Structures | |||
| Accessory Structures | |||
| Deck, Dock & Stairs | |||
| Woodburning Appliance | |||
| Pool | $175.00 | 1 | |
| Building Move | $900.00 | 9 | |
| Demolition | $120.00 | 1 | |
| Renewals | |||
| Total | $48,207.00 | $1,972.59 | 12 |
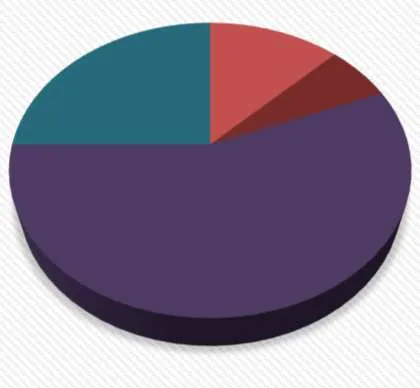
Permit Type Comparison
PART 3 PERMITS
| Permit Types | Constr. Value | Permit Fee | # of Permits |
|---|---|---|---|
| New Construction | $225,000.00 | $2,588.00 | 1 |
| Minor Projects | $15,000.00 | $550.00 | 1 |
| Retaining Structures | |||
| Accessory Buildings | |||
| Deck, Dock & Stairs | |||
| Pool | |||
| Demolitons | |||
| Renewals | |||
| Total | $240,000.00 | $3,138.00 | 2 |
Building Month Totals
| Constr. Value | Permit Fee | # of Permits | |
|---|---|---|---|
| Part 9 Permits | $48,207.00 | $1,972.59 | 12 |
| Part 3 Permits | $240,000.00 | $3,138.00 | 2 |
| Total | $288,207.00 | $5,110.59 | 14 |
Plumbing
| Permit Fee | # of Permits | |
|---|---|---|
| Part 9 Plumbing | $780.00 | 4 |
| Part 3 Plumbing | ||
| Renewals | ||
| Total | $780.00 | 4 |
Totals to Date
| Constr. Value | Permit Fee | # of Permits | |
|---|---|---|---|
| Part 9 | 416,050.00 | 7,696.22 | 17 |
| Part 3 | 54,675,000.00 | 417,927.00 | 6 |
| Plumbing | 11,710.00 | 15 | |
| Building & Plumbing | $437,333.22 | $437,333.22 | 38 |
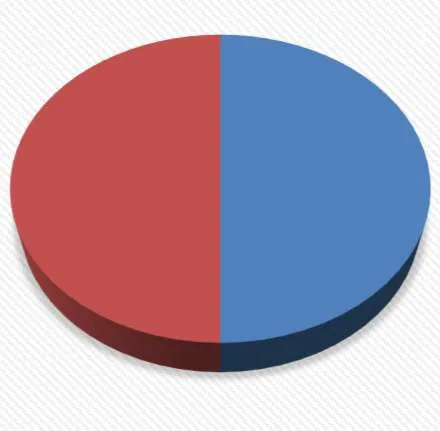
Monthly Permit Revenue Comparison
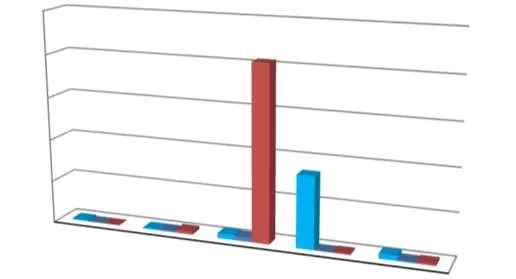
3yr Comparison of Issued Dwelling Units by Type
[Bar chart comparing issued dwelling units for 2024, 2025, and 2026 by type: Single Family Dwelling, Secondary Suite, Garden Suite, Duplex, Houseplex, Townhouse, Multifamily, and Mixed Use]
Annual Permit Revenue Comparison
[Horizontal bar chart showing Annual Permit Revenue from 2017 to 2026]
- 2017: $481,464.92
- 2018: $509,006.90
- 2019: $196,640.36
- 2020: $202,756.46
- 2021: $312,343.91
- 2022: $497,721.15
- 2023: $1,092,708.50
- 2024: $538,965.50
- 2025: $60,545.05
- 2026: $437,333.22
Page 718
Extracted from: 2026 06 09 Committee of the Whole Meeting - Agenda - Pdf(719 pages total)