Appendix
Statistical Information (Unaudited) - Property Assessments and Tax Rates
July 15, 2014Pages 160–1634 sections
Five-year historical data on property assessments, municipal tax rates, and top corporate taxpayers.
Top Corporate Taxpayer: Admirals Walk Properties Ltd Inc ($199,560)Total 2013 General Municipal Taxes Levied: $5,732,632
Statistical Information (Unaudited)
Taxable Assessments of Land and Improvements - Final Roll Totals
| 2009 | 2010 | 2011 | 2012 | 2013 | |
|---|---|---|---|---|---|
| Residential | 1,519,410,702 | 1,571,493,502 | 1,669,838,002 | 1,703,860,702 | 1,688,392,103 |
| Utilities | 317,800 | 369,400 | 371,900 | 379,500 | 376,200 |
| Light Industry | - | - | - | - | 2,074,000 |
| Business | 134,034,700 | 153,955,300 | 138,540,900 | 154,482,400 | 155,824,400 |
| Rec/Non Profit | 5,938,000 | 6,450,000 | 6,450,000 | 6,529,000 | 6,526,000 |
| Farm | 71,790 | 72,629 | 71,218 | 71,218 | 71,218 |
| Total | 1,659,772,992 | 1,732,340,831 | 1,815,272,020 | 1,865,322,820 | 1,853,263,921 |
Property Tax Rates - Municipal ($ per $1,000 assessment)
| 2009 | 2010 | 2011 | 2012 | 2013 | |
|---|---|---|---|---|---|
| Residential | 2.16151 | 2.25290 | 2.24943 | 2.35161 | 2.52342 |
| Utilities | 28.61845 | 29.82845 | 29.78246 | 30.23178 | 31.70102 |
| Light Industry | - | - | - | - | 8.81447 |
| Business | 8.64606 | 8.48263 | 8.81214 | 8.55460 | 8.81447 |
| Rec/Non Profit | 8.64606 | 8.48263 | 8.81214 | 8.49933 | 8.83896 |
| Farm | 18.05945 | 18.82301 | 18.79399 | 19.46739 | 20.23598 |
Municipal Property Tax Billings by Property Class
| 2009 | 2010 | 2011 | 2012 | 2013 | |
|---|---|---|---|---|---|
| Residential | $ 3,284,221 | $ 3,540,417 | $ 3,756,184 | $ 4,006,816 | $ 4,260,522 |
| Utilities | 9,095 | 11,019 | 11,076 | 11,473 | 11,926 |
| Light Industry | - | - | - | - | 18,281 |
| Business * | 1,158,872 | 1,329,672 | 1,220,842 | 1,321,535 | 1,373,509 |
| Rec/Non Profit | 51,340 | 54,713 | 56,838 | 55,492 | 57,683 |
| Farm | 1,296 | 1,367 | 1,338 | 1,386 | 1,441 |
| Total | $ 4,504,825 | $ 4,937,188 | $ 5,046,278 | $ 5,396,702 | $ 5,723,362 |
* includes a Risk to Roll adjustment of ($34,584) for the year 2009 and $23,726 for the year 2010
Page 160–163
Statistical Information (continued)
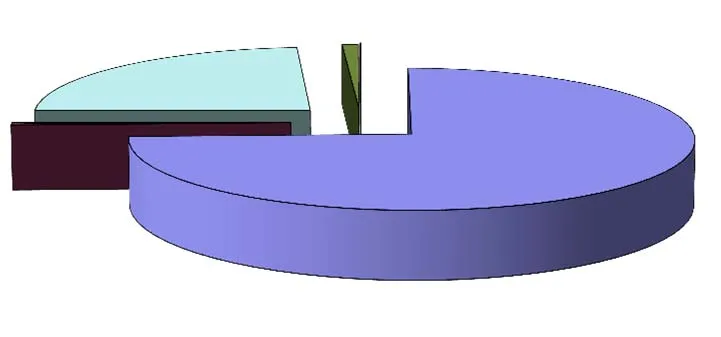
2013 Assessments by Property Class
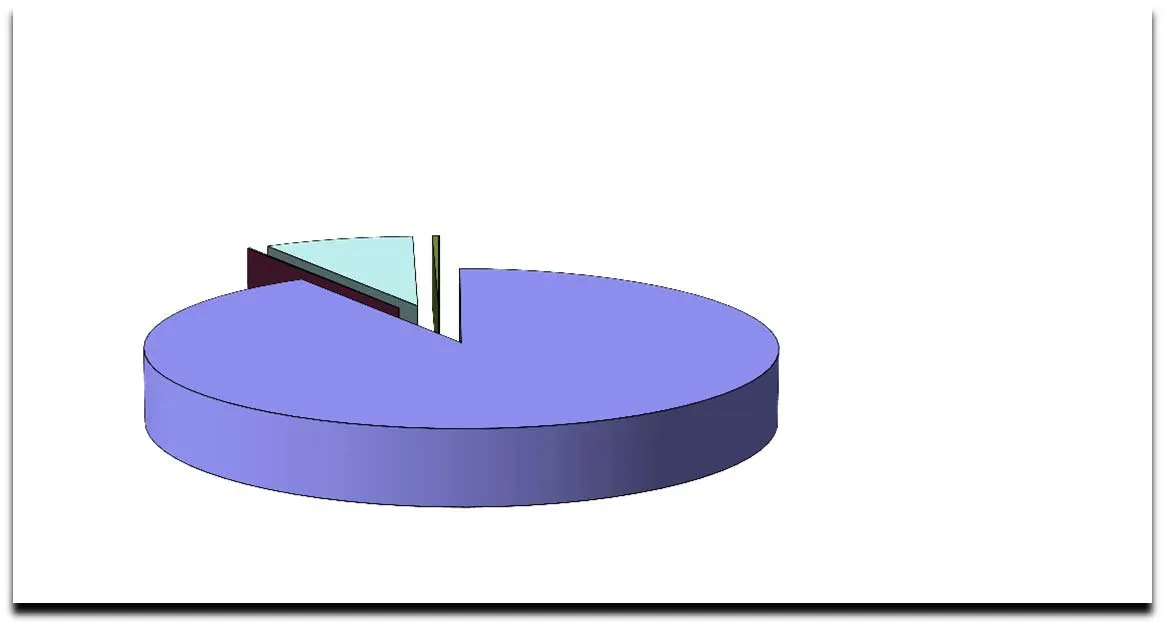
2013 Municipal Property Tax by Property Class
Page 160–163
Statistical Information (continued)
Long Term Debt and Capital Lease Obligations (Unaudited)
| 2013 | 2012 | 2011 | 2010 | 2009 | |
|---|---|---|---|---|---|
| Long-term debt | |||||
| General | $ 2,195,904 | $ 2,536,117 | $ 804,937 | $ 615,382 | $ 804,937 |
| Consolidated entity debt | 23,796 | 36,076 | 63,098 | 86,100 | - |
| 2,219,700 | 2,572,193 | 868,035 | 701,482 | 804,937 | |
| Capital lease obligation | |||||
| General - protective services | - | - | - | - | 35,841 |
| Total Long Term Debt and Capital Lease Obligations | 2,219,700 | 2,572,193 | 868,035 | 701,482 | 840,778 |
| Population (BC Stats Estimates 2009 to 2013) | 10,858 | 9,838 | 9,838 | 9,743 | 9,596 |
| Debt per capita | $ 204 | $ 261 | $ 88 | $ 72 | $ 88 |
Page 160–163
Statistical Information (continued)
Principal Corporate Taxpayers (Unaudited)
| Registered Owner | Primary Property | Total 2013 General Municipal Taxes Levied |
|---|---|---|
| Admirals Walk Properties Ltd Inc | Admirals Walk | $199,560 |
| Great Canadian Casinos Inc | View Royal Casino | 160,723 |
| Canadian Tire Real Estate Ltd | Canadian Tire | 117,902 |
| Natural Properties Ltd | Reliable Controls | 86,399 |
| West Shore U-Lock Mini Storage Ltd | U-Lock Mini Storage | 78,255 |
| Goodwill Investments Ltd | Fort Victoria | 75,353 |
| Adams Storage Ltd | Adams Storage | 71,697 |
| Boardwalk Equities (BC) Inc | Spruce Apartments | 63,414 |
| 0848052 BC Ltd | Thetis Cove | 60,329 |
| Mojack Holdings Ltd | Jenner Chevrolet | 58,669 |
| Total Tax Contributions from Top 10 Corporate Taxpayers | $972,301 | |
| Total General Municipal Tax | $5,732,632 | |
| Proportion of municipal tax paid by top ten | 17.0% |
Page 160–163
Extracted from: 2014 07 15 Council Agenda