Attachment 4: Coastal Flood Risk Areas map - Technical Memo
A technical memorandum explaining the data and methodology used to produce the Coastal Flood Risk Areas map for SSMUH exemptions.
TOWN OF VIEW ROYAL 45 View Royal Avenue Victoria, B.C. V9B 1A6
DATE: April 17, 2024 TO: Scott Sommerville, CAO Leanne Taylor, Director of Development Services Stirling Scory, Senior Planner FROM: Jeff Chow, Senior Planner RE: Coastal Flood Risk Areas map - Technical Memo
Purpose
The purpose of this memo is to explain the data used for the Coastal Flood Risk Areas map (Attachment 1) with regard to a proposal to exempt certain areas subject to coastal flood risks from the requirements of the Province’s Small Scale Multi Unit Housing (SSMUH) initiative, which was enacted through Bill 44 - Housing Statues (Residential Development) Amendment Act, 2023.
Executive Summary
The Coastal Flood Risk Areas map is based on worst-case scenarios for potential coastal flooding:
- 8.46m water surface elevation of a potential tsunami for the Esquimalt Harbour coastline (1:2500-year probability)
- 4.63 Flood Construction Level for the Portage Inlet coastline (2.0m relative sea level rise by year 2200)
The data comes from the 2021 Capital Regional District Coastal Flood Inundation Mapping Project.
Coastal Flood Risk Areas map – data sources
The source of the flood data used to produce the map of areas subject to coastal flood risk comes from the 2021 Capital Regional District Coastal Flood Inundation Mapping Project (https://www.crd.bc.ca/about/data/climate-change/coastal-flood-inundation-mapping-project). The study modeled the potential impacts of coastal flooding from sources such as sea level rise and tsunamis.
The sea level rise component of the CRD study analysed three scenarios: 0m, 1.0m and 2.0m sea level rise. The projected time frames for a 1.0m sea level rise is approximately year 2100, and for a 2.0m sea level rise, approximately year 2200. The Provincial Flood Hazard Area Land Use Management Guidelines (https://www2.gov.bc.ca/assets/gov/environment/air-land-water/water/integrated-flood-hazard-mgmt/flood_hazard_area_land_use_guidelines_2017.pdf) call for the following:
- Requirements for buildings, subdivision, and zoning should allow for sea level rise (SLR) to the year 2100.
- Land use adaptation strategies as set out in Official Community Plans (OCPs) and Regional Growth Strategies (RGSs) should allow for sea level rise to the year 2200 and beyond.
The methodology divided the coastline into segments called reaches. Within each reach, a transect at one point was selected for 2-dimensional analysis. This is suitable for regional analysis and high-level planning purposes but does not take into account site-specific topography, stability, or erosion. This is why the FCLs have not been adopted by the Town.
Flood Construction Levels
The CRD study also recommended flood construction levels based on the modeling work. The Flood Construction Level (FCL) is the geodetic elevation that the habitable part of a building needs to be above. Provincial guidelines call for FCLs to includes allowances for high tide, storm surge (waves), and freeboard (extra margin of safety) as shown in Figure 1.
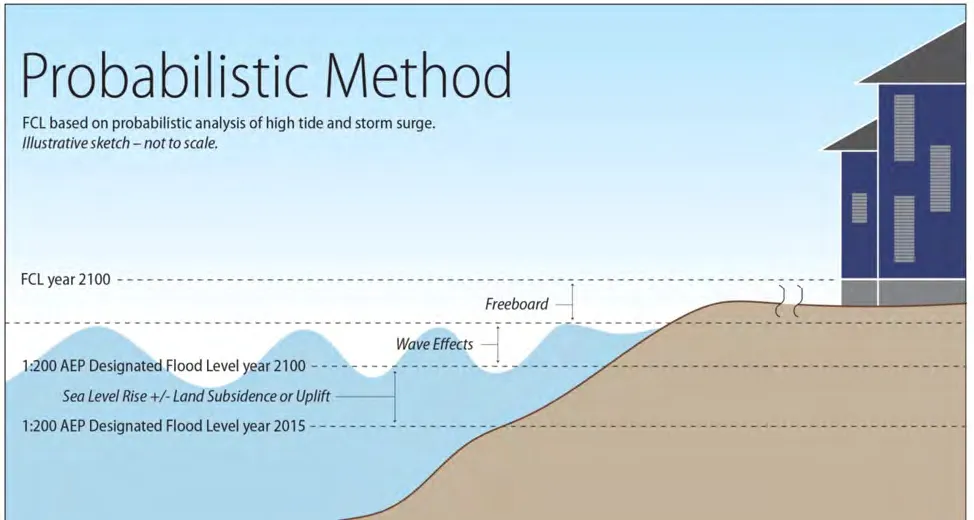
Figure 1. Source: Province of BC Flood Hazard Area Land Use Management Guidelines
Typically, a house would be set back above the FCL on the ground (Figure 2); this is appropriate for sites subject to sea level rise. In tsunami prone locations, there can be circumstances where houses could be permitted to be constructed into the flood setback when there are engineered pilings or open foundations that would permit flood water to enter and recede (Figure 3).
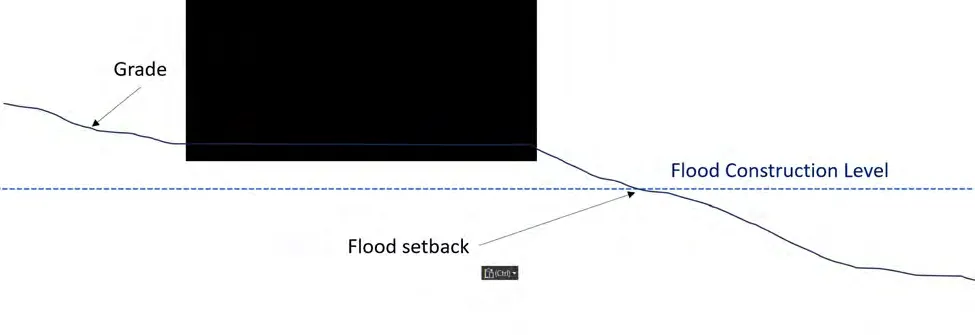
Figure 2. Flood Construction Level and Flood Setback suitable for SLR prone sites
Figure 3. Flood Construction Level and Flood Setback suitable for tsunami prone sites
While the FCLs recommended in the CRD study have not been adopted by the Town because they are based on a regional scale analysis, they are useful as starting point in evaluating site specific development proposals. For subdivisions and building permits, the Approving Officer and Building Official respectively have the statutory authority to require engineering reports to establish flood construction levels and flood setbacks, and to require that covenants be registered to ensure that development will comply with the reports.
Esquimalt Harbour Coastline Mapping
Tsunamis are the more significant coastal flooding risk along the Esquimalt Harbour Coastline. The CRD study considered the eleven most likely earthquake sources from Cascadia Subduction Zone (CSZ) events, far-field events and local crustal faults to affect the region (see Attachment 2). The worst-case scenario in this area would be a tsunami caused by “Cascadia Subduction Zone - L1 Source”. That event is a potential 9.1-9.2 magnitude earthquake with a 1 in 2500-year probability. The model projects an 8.46m water surface elevation, and that elevation contour is used in the map associated with this memo.
Portage Inlet Coastline Mapping
Sea level rise is the more significant coastal flooding risk along the Portage Inlet as tsunami impacts are expected to be lower (see Attachment 3). In this area, the study recommends a Flood Construction Level of 4.63 m based on the relative sea level rise anticipated for year 2200 as shown in Attachment 4. This would be in accordance with Provincial Flood Hazard Area Land Use Management Guidelines that call for land use adaptation strategies in Official Community Plans to consider sea level rise to the year 2200 and beyond.
Please let me know if you have any questions.
Attachments
- Coastal Flood Risk Areas map, 2024
- Summary of Modelled Average Water Surface Elevations - CRD Task 3 Report v2 2021 (p.iv)
- Maximum Occurring Water Surface Elevation in Victoria / Esquimalt: CSZ-L1 Event, - CRD Task 3 Report v2 2021 (p.4-16)
- Flood Construction Level Map 2.0m RSLR, CRD Task 2 Report v2 2021 (p.183)