This site is in beta — data may be incomplete and features are still being added.
Special Council/Documents/Technical Memo Appendix 3: Maximum Occurring Water Surface Elevation in Victoria / Esquimalt: CSZ-L1 Event
Appendix

Technical Memo Appendix 3: Maximum Occurring Water Surface Elevation in Victoria / Esquimalt: CSZ-L1 Event

April 23, 2024Page 261 section

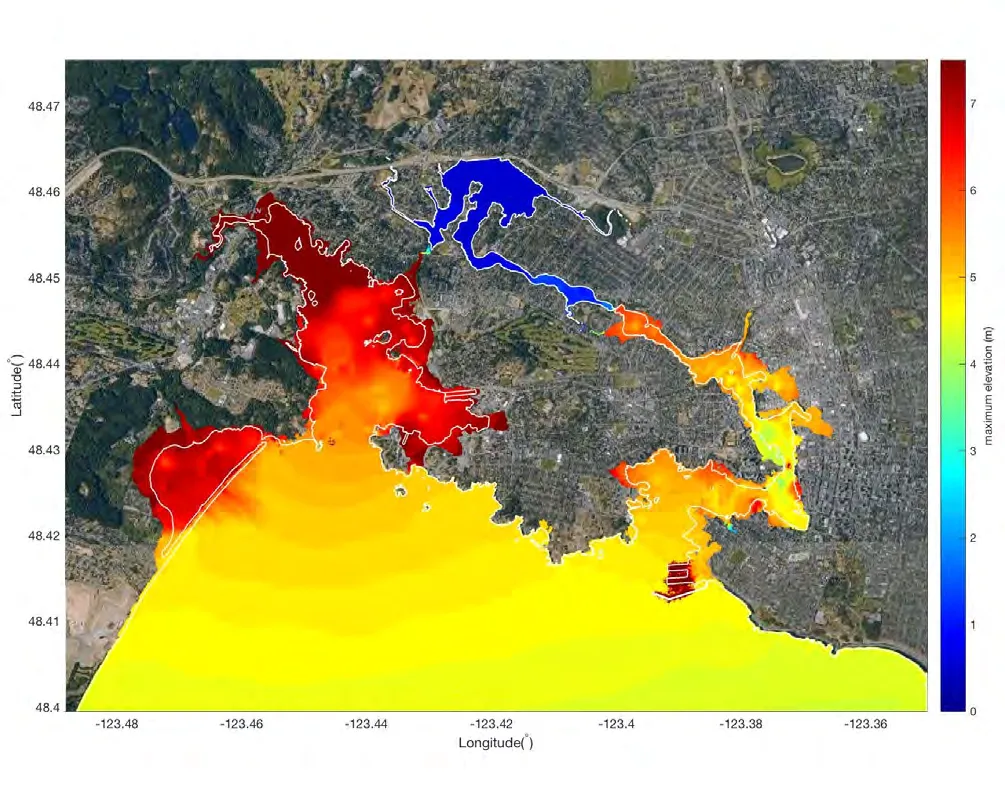
A heat map visualization showing the maximum occurring water surface elevations for a CSZ-L1 tsunami event in the Victoria/Esquimalt area.

1 CALL TO ORDER- Mayor Tobias called the meeting to order at 7:00 p.m.
Figure 4-10 from CRD report
Map showing the maximum occurring water surface elevation in Victoria and Esquimalt during a CSZ-L1 event, overlaid on a satellite image of the region. A color scale indicates elevations ranging from 0 meters (dark blue) to over 7 meters (dark red).

Figure 4-10

Maximum Occurring Water Surface Elevation in Victoria / Esquimalt: CSZ-L1 Event. (Elevations Reported to HHWMT)

Page 26
Extracted from: 2024 04 23 Special Council Agenda - Agenda - Pdf