Calculating 20-year housing need (Attachment 1)
Standardized data tables and a statement regarding the connection between housing and transportation infrastructure.
Calculating 20-year housing need
The following tables calculate 20-year and 5-year housing need according to provincial guidelines. Each table follows these guidelines exactly with the intention that the tables can be directly included in the required interim housing needs report (or included as an addendum to an existing housing needs report).
HART has produced this calculator to support communities in British Columbia satisfy a provincial requirement for interim housing needs reports. Methodologies for housing needs reports can vary widely, and while HART supports the standardization of methodologies for the purpose of provincial or national reporting, we did not have a role in developing the methodology, nor do we unequivocally endorse it. You can learn more about the HART methodology and what it can tell you about your community on our Housing Needs Assessment Tool page.
- A note on terminology: we use the term RDA, where the province uses the term Electoral Area. For all intents and purposes, these are interchangeable in the calculator.
- A note on rounding: per provincial guidelines, the figures in Components A-F are not rounded and are shown to two decimal places. Total housing need is rounded in Table 13 to the nearest whole number, per guidelines.
Component A: Extreme core housing need calculation
The following tables calculate the new homes required to meet existing Extreme Core Housing Need (ECHN) according to provincial guidelines.
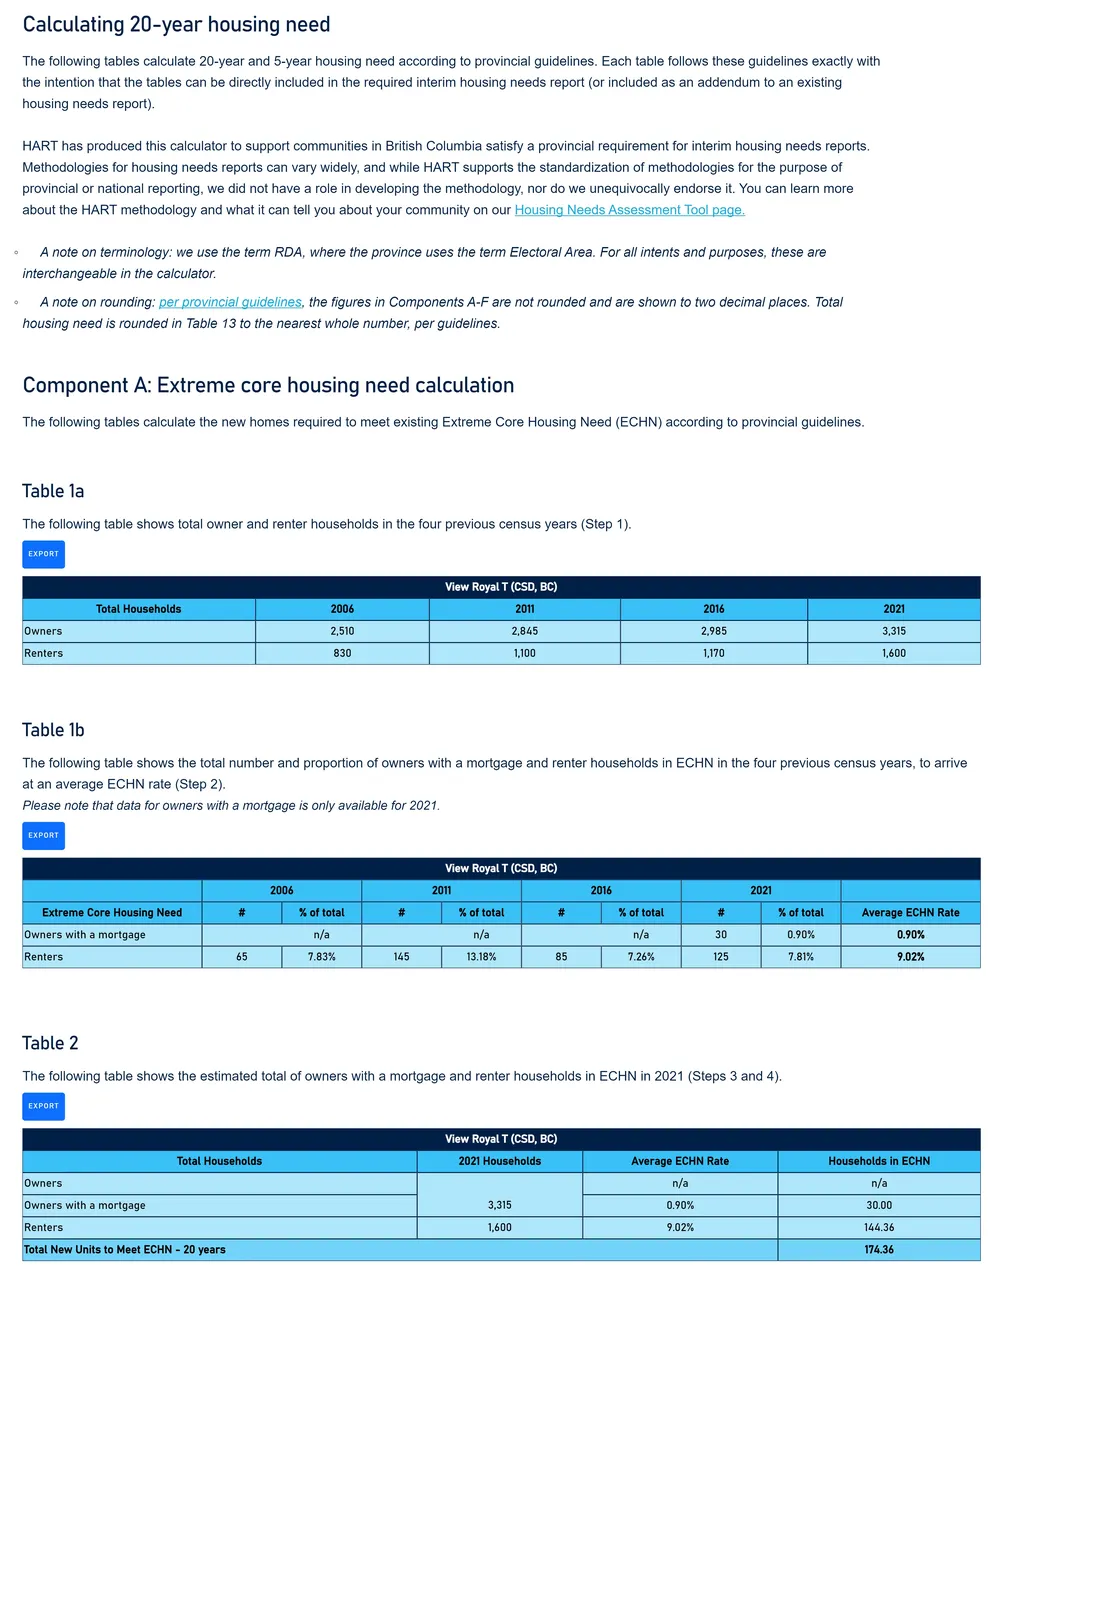
Table 1a
The following table shows total owner and renter households in the four previous census years (Step 1).
| View Royal T (CSD, BC) | 2006 | 2011 | 2016 | 2021 |
|---|---|---|---|---|
| Total Households | ||||
| Owners | 2,510 | 2,845 | 2,985 | 3,315 |
| Renters | 830 | 1,100 | 1,170 | 1,600 |
Table 1b
The following table shows the total number and proportion of owners with a mortgage and renter households in ECHN in the four previous census years, to arrive at an average ECHN rate (Step 2). Please note that data for owners with a mortgage is only available for 2021.
| View Royal T (CSD, BC) | 2006 | 2011 | 2016 | 2021 | |||||
|---|---|---|---|---|---|---|---|---|---|
| Extreme Core Housing Need | # | % of total | # | % of total | # | % of total | # | % of total | Average ECHN Rate |
| Owners with a mortgage | n/a | n/a | n/a | 30 | 0.90% | 0.90% | |||
| Renters | 65 | 7.83% | 145 | 13.18% | 85 | 7.26% | 125 | 7.81% | 9.02% |
Table 2
The following table shows the estimated total of owners with a mortgage and renter households in ECHN in 2021 (Steps 3 and 4).
| View Royal T (CSD, BC) | |||
|---|---|---|---|
| Total Households | 2021 Households | Average ECHN Rate | Households in ECHN |
| Owners | n/a | n/a | |
| Owners with a mortgage | 3,315 | 0.90% | 30.00 |
| Renters | 1,600 | 9.02% | 144.36 |
| Total New Units to Meet ECHN – 20 years | 174.36 |
Component B: Housing units and homelessness
The following table calculates the number of new homes required to meet the needs of the existing population of people experiencing homelessness (PEH), according to provincial guidelines.
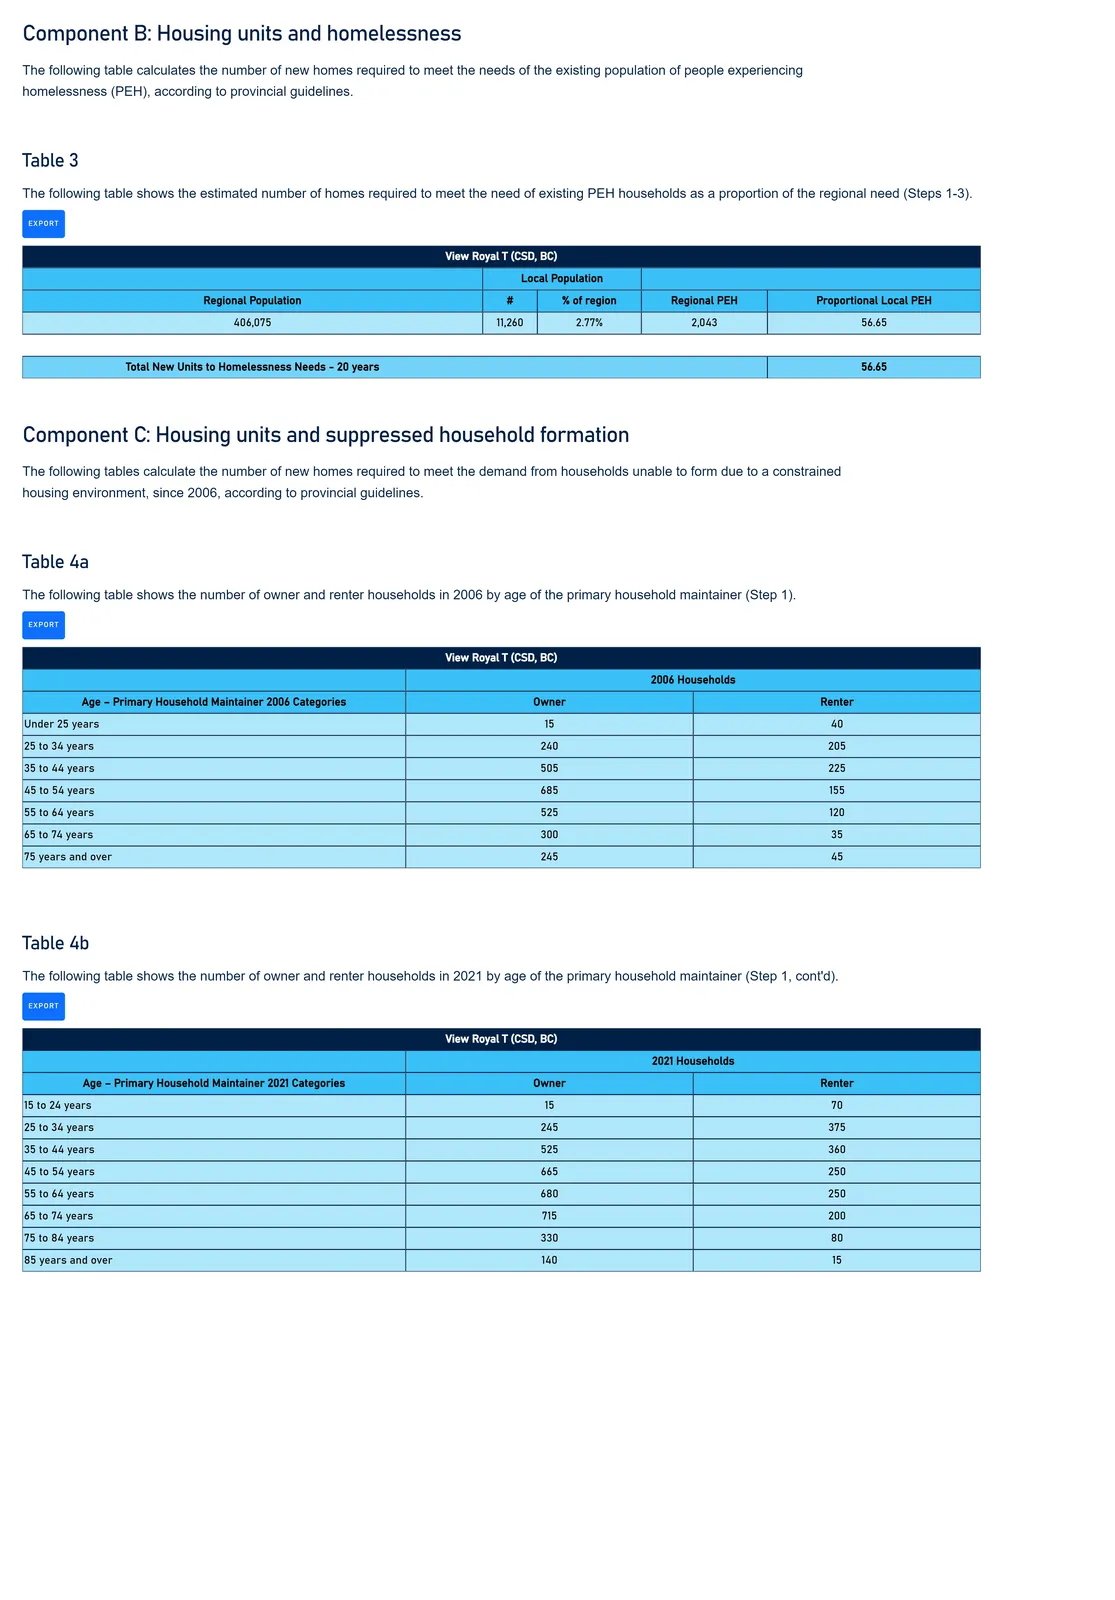
Table 3
The following table shows the estimated number of homes required to meet the need of existing PEH households as a proportion of the regional need (Steps 1-3).
| View Royal T (CSD, BC) | ||||
|---|---|---|---|---|
| Local Population | ||||
| Regional Population | # | % of region | Regional PEH | Proportional Local PEH |
| 406,075 | 11,260 | 2.77% | 2,043 | 56.65 |
| Total New Units to Homelessness Needs – 20 years | 56.65 |
Component C: Housing units and suppressed household formation
The following tables calculate the number of new homes required to meet the demand from households unable to form due to a constrained housing environment, since 2006, according to provincial guidelines.
Table 4a
The following table shows the number of owner and renter households in 2006 by age of the primary household maintainer (Step 1).
| View Royal T (CSD, BC) | 2006 Households | |
|---|---|---|
| Age – Primary Household Maintainer 2006 Categories | Owner | Renter |
| Under 25 years | 15 | 40 |
| 25 to 34 years | 240 | 205 |
| 35 to 44 years | 505 | 225 |
| 45 to 54 years | 685 | 155 |
| 55 to 64 years | 525 | 120 |
| 65 to 74 years | 300 | 35 |
| 75 years and over | 245 | 45 |
Table 4b
The following table shows the number of owner and renter households in 2021 by age of the primary household maintainer (Step 1, cont'd).
| View Royal T (CSD, BC) | 2021 Households | |
|---|---|---|
| Age – Primary Household Maintainer 2021 Categories | Owner | Renter |
| 15 to 24 years | 15 | 70 |
| 25 to 34 years | 245 | 375 |
| 35 to 44 years | 525 | 360 |
| 45 to 54 years | 665 | 250 |
| 55 to 64 years | 680 | 250 |
| 65 to 74 years | 715 | 200 |
| 75 to 84 years | 330 | 80 |
| 85 years and over | 140 | 15 |
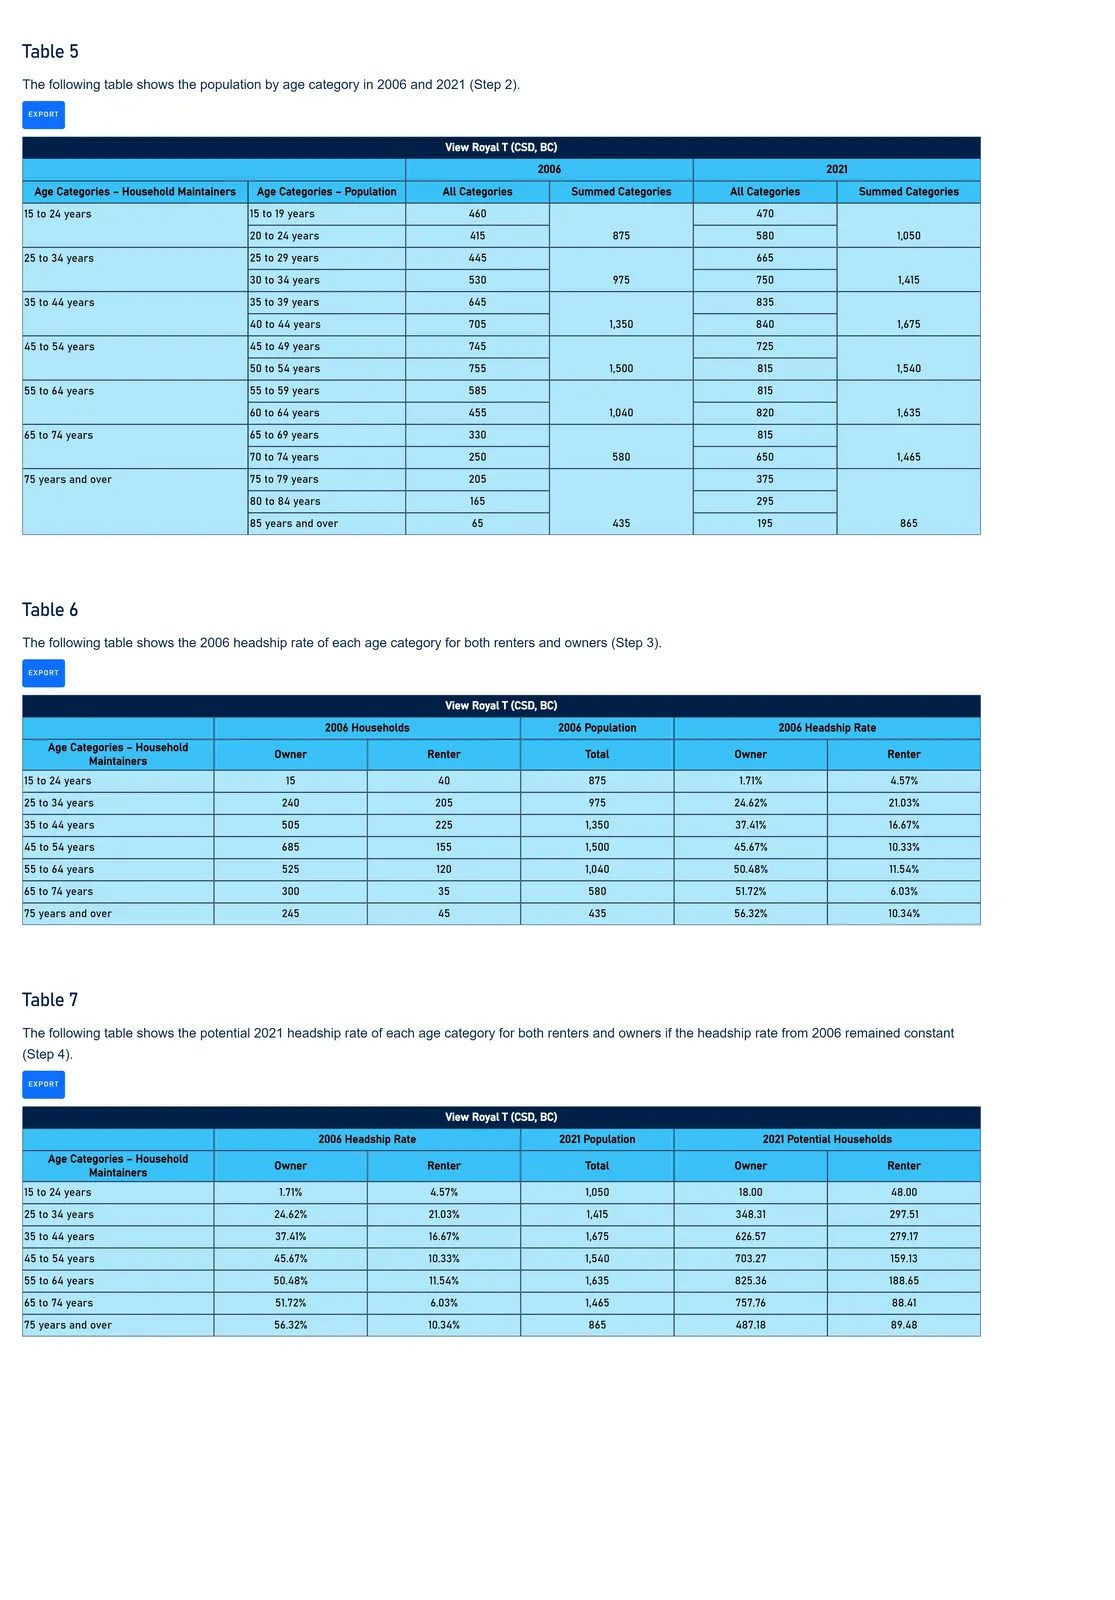
Table 5
The following table shows the population by age category in 2006 and 2021 (Step 2).
| View Royal T (CSD, BC) | 2006 | 2021 | ||||
|---|---|---|---|---|---|---|
| Age Categories – Household Maintainers | Age Categories – Population | All Categories | Summed Categories | Age Categories | All Categories | Summed Categories |
| 15 to 24 years | 15 to 19 years | 460 | 470 | |||
| 20 to 24 years | 415 | 875 | 580 | 1,050 | ||
| 25 to 34 years | 25 to 29 years | 445 | 665 | |||
| 30 to 34 years | 530 | 975 | 750 | 1,415 | ||
| 35 to 44 years | 35 to 39 years | 645 | 835 | |||
| 40 to 44 years | 705 | 1,350 | 840 | 1,675 | ||
| 45 to 54 years | 45 to 49 years | 745 | 725 | |||
| 50 to 54 years | 755 | 1,500 | 815 | 1,540 | ||
| 55 to 64 years | 55 to 59 years | 585 | 815 | |||
| 60 to 64 years | 455 | 1,040 | 820 | 1,635 | ||
| 65 to 74 years | 65 to 69 years | 330 | 815 | |||
| 70 to 74 years | 250 | 580 | 650 | 1,465 | ||
| 75 years and over | 75 to 79 years | 205 | 375 | |||
| 80 to 84 years | 165 | 295 | ||||
| 85 years and over | 65 | 435 | 195 | 865 |
Table 6
The following table shows the 2006 headship rate of each age category for both renters and owners (Step 3).
| View Royal T (CSD, BC) | 2006 Households | 2006 Population | 2006 Headship Rate | ||
|---|---|---|---|---|---|
| Age Categories – Household Maintainers | Owner | Renter | Total | Owner | Renter |
| 15 to 24 years | 15 | 40 | 875 | 1.71% | 4.57% |
| 25 to 34 years | 240 | 205 | 975 | 24.62% | 21.03% |
| 35 to 44 years | 505 | 225 | 1,350 | 37.41% | 16.67% |
| 45 to 54 years | 685 | 155 | 1,500 | 45.67% | 10.33% |
| 55 to 64 years | 525 | 120 | 1,040 | 50.48% | 11.54% |
| 65 to 74 years | 300 | 35 | 580 | 51.72% | 6.03% |
| 75 years and over | 245 | 45 | 435 | 56.32% | 10.34% |
Table 7
The following table shows the potential 2021 headship rate of each age category for both renters and owners if the headship rate from 2006 remained constant (Step 4).
| View Royal T (CSD, BC) | 2006 Headship Rate | 2021 Population | 2021 Potential Households | ||
|---|---|---|---|---|---|
| Age Categories – Household Maintainers | Owner | Renter | Total | Owner | Renter |
| 15 to 24 years | 1.71% | 4.57% | 1,050 | 18.00 | 48.00 |
| 25 to 34 years | 24.62% | 21.03% | 1,415 | 348.31 | 297.51 |
| 35 to 44 years | 37.41% | 16.67% | 1,675 | 626.57 | 279.17 |
| 45 to 54 years | 45.67% | 10.33% | 1,540 | 703.27 | 159.13 |
| 55 to 64 years | 50.48% | 11.54% | 1,635 | 825.36 | 188.65 |
| 65 to 74 years | 51.72% | 6.03% | 1,465 | 757.76 | 88.41 |
| 75 years and over | 56.32% | 10.34% | 865 | 487.18 | 89.48 |
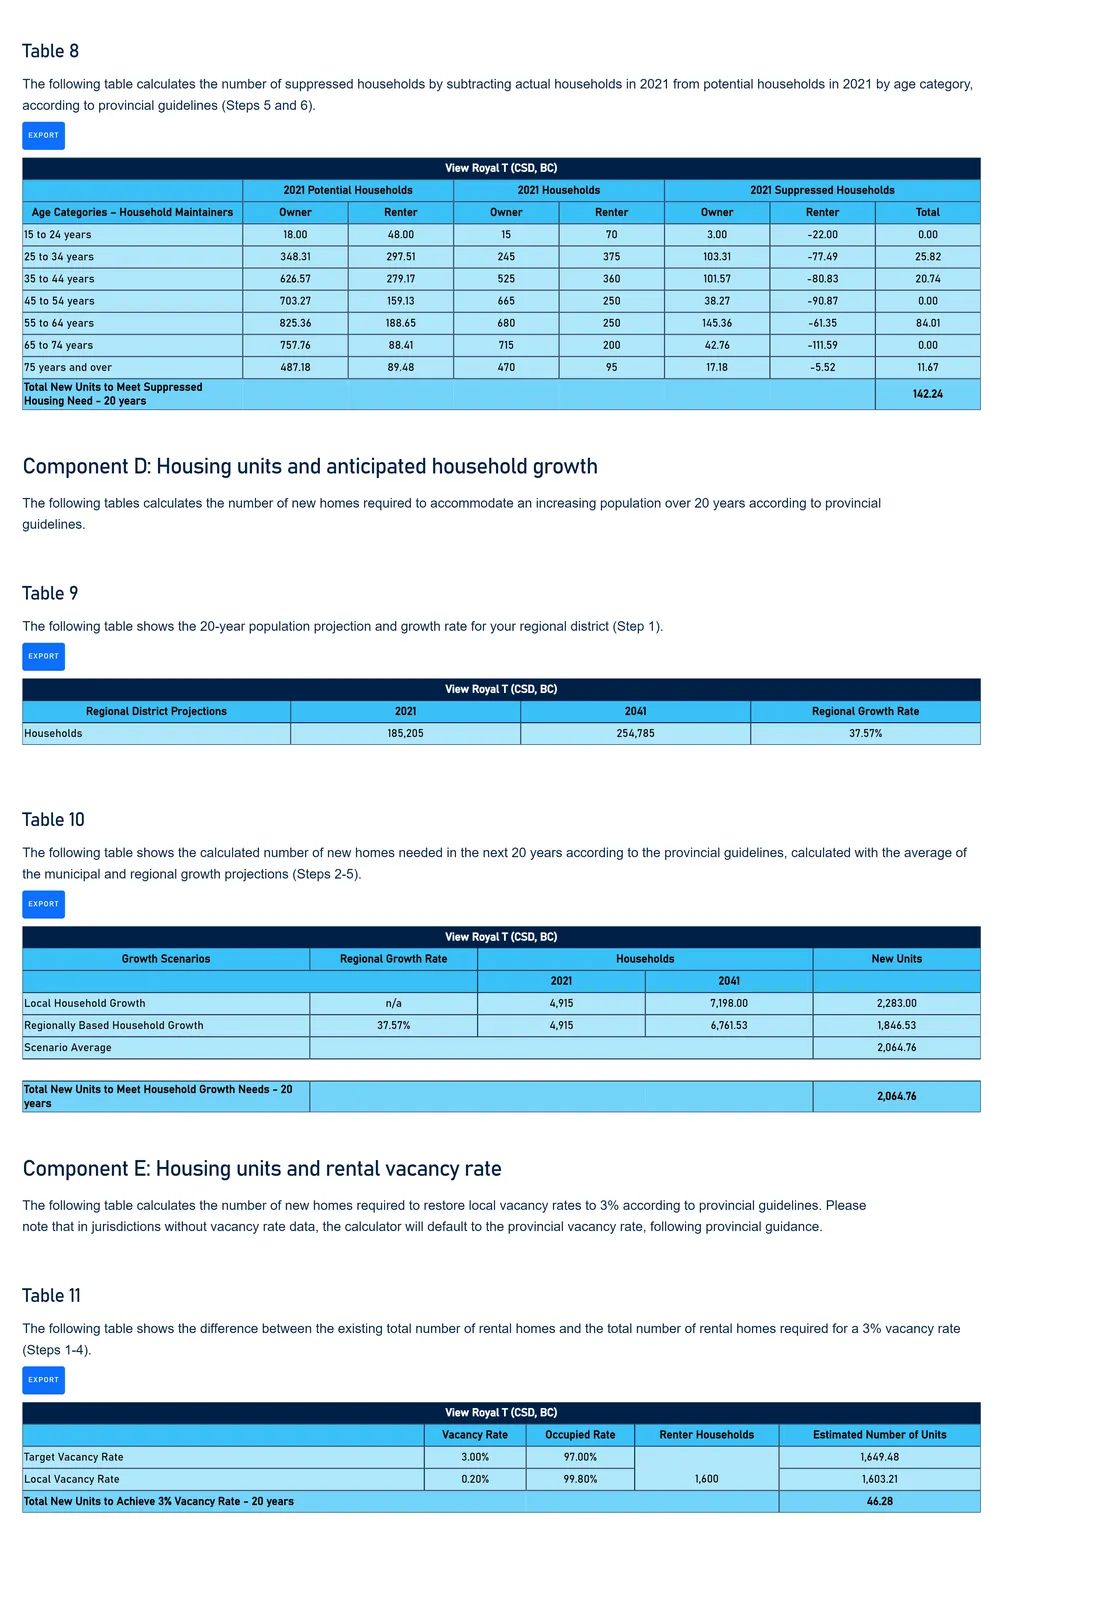
Table 8
The following table calculates the number of suppressed households by subtracting actual households in 2021 from potential households in 2021 by age category, according to provincial guidelines (Steps 5 and 6).
| View Royal T (CSD, BC) | 2021 Potential Households | 2021 Households | 2021 Suppressed Households | ||||
|---|---|---|---|---|---|---|---|
| Age Categories – Household Maintainers | Owner | Renter | Owner | Renter | Owner | Renter | Total |
| 15 to 24 years | 18.00 | 48.00 | 15 | 70 | 3.00 | -22.00 | 0.00 |
| 25 to 34 years | 348.31 | 297.51 | 245 | 375 | 103.31 | -77.49 | 25.82 |
| 35 to 44 years | 626.57 | 279.17 | 525 | 360 | 101.57 | -80.83 | 20.74 |
| 45 to 54 years | 703.27 | 159.13 | 665 | 250 | 38.27 | -90.87 | 0.00 |
| 55 to 64 years | 825.36 | 188.65 | 680 | 250 | 145.36 | -61.35 | 84.01 |
| 65 to 74 years | 757.76 | 88.41 | 715 | 200 | 42.76 | -111.59 | 0.00 |
| 75 years and over | 487.18 | 89.48 | 470 | 95 | 17.18 | -5.52 | 11.67 |
| Total New Units to Meet Suppressed Housing Need – 20 years | 142.24 |
Component D: Housing units and anticipated household growth
The following tables calculates the number of new homes required to accommodate an increasing population over 20 years according to provincial guidelines.
Table 9
The following table shows the 20-year population projection and growth rate for your regional district (Step 1).
| View Royal T (CSD, BC) | 2021 | 2041 | Regional Growth Rate |
|---|---|---|---|
| Regional District Projections | |||
| Households | 185,205 | 254,785 | 37.57% |
Table 10
The following table shows the calculated number of new homes needed in the next 20 years according to the provincial guidelines, calculated with the average of the municipal and regional growth projections (Steps 2-5).
| View Royal T (CSD, BC) | Regional Growth Rate | Households | New Units | |
|---|---|---|---|---|
| Growth Scenarios | 2021 | 2041 | ||
| Local Household Growth | n/a | 4,915 | 7,198.00 | 2,283.00 |
| Regionally Based Household Growth | 37.57% | 4,915 | 6,761.53 | 1,846.53 |
| Scenario Average | 2,064.76 | |||
| Total New Units to Meet Household Growth Needs – 20 years | 2,064.76 |
Component E: Housing units and rental vacancy rate
The following table calculates the number of new homes required to restore local vacancy rates to 3% according to provincial guidelines. Please note that in jurisdictions without vacancy rate data, the calculator will default to the provincial vacancy rate, following provincial guidance.
Table 11
The following table shows the difference between the existing total number of rental homes and the total number of rental homes required for a 3% vacancy rate (Steps 1-4).
| View Royal T (CSD, BC) | Vacancy Rate | Occupied Rate | Renter Households | Estimated Number of Units |
|---|---|---|---|---|
| Target Vacancy Rate | 3.00% | 97.00% | 1,649.48 | |
| Local Vacancy Rate | 0.20% | 99.80% | 1,600 | 1,603.21 |
| Total New Units to Achieve 3% Vacancy Rate – 20 years | 46.28 |
Component F: Housing units and demand (the “demand buffer”)
The demand factor is a multiplier used to calculate additional local housing demand (or "demand buffer"), determined by the province.
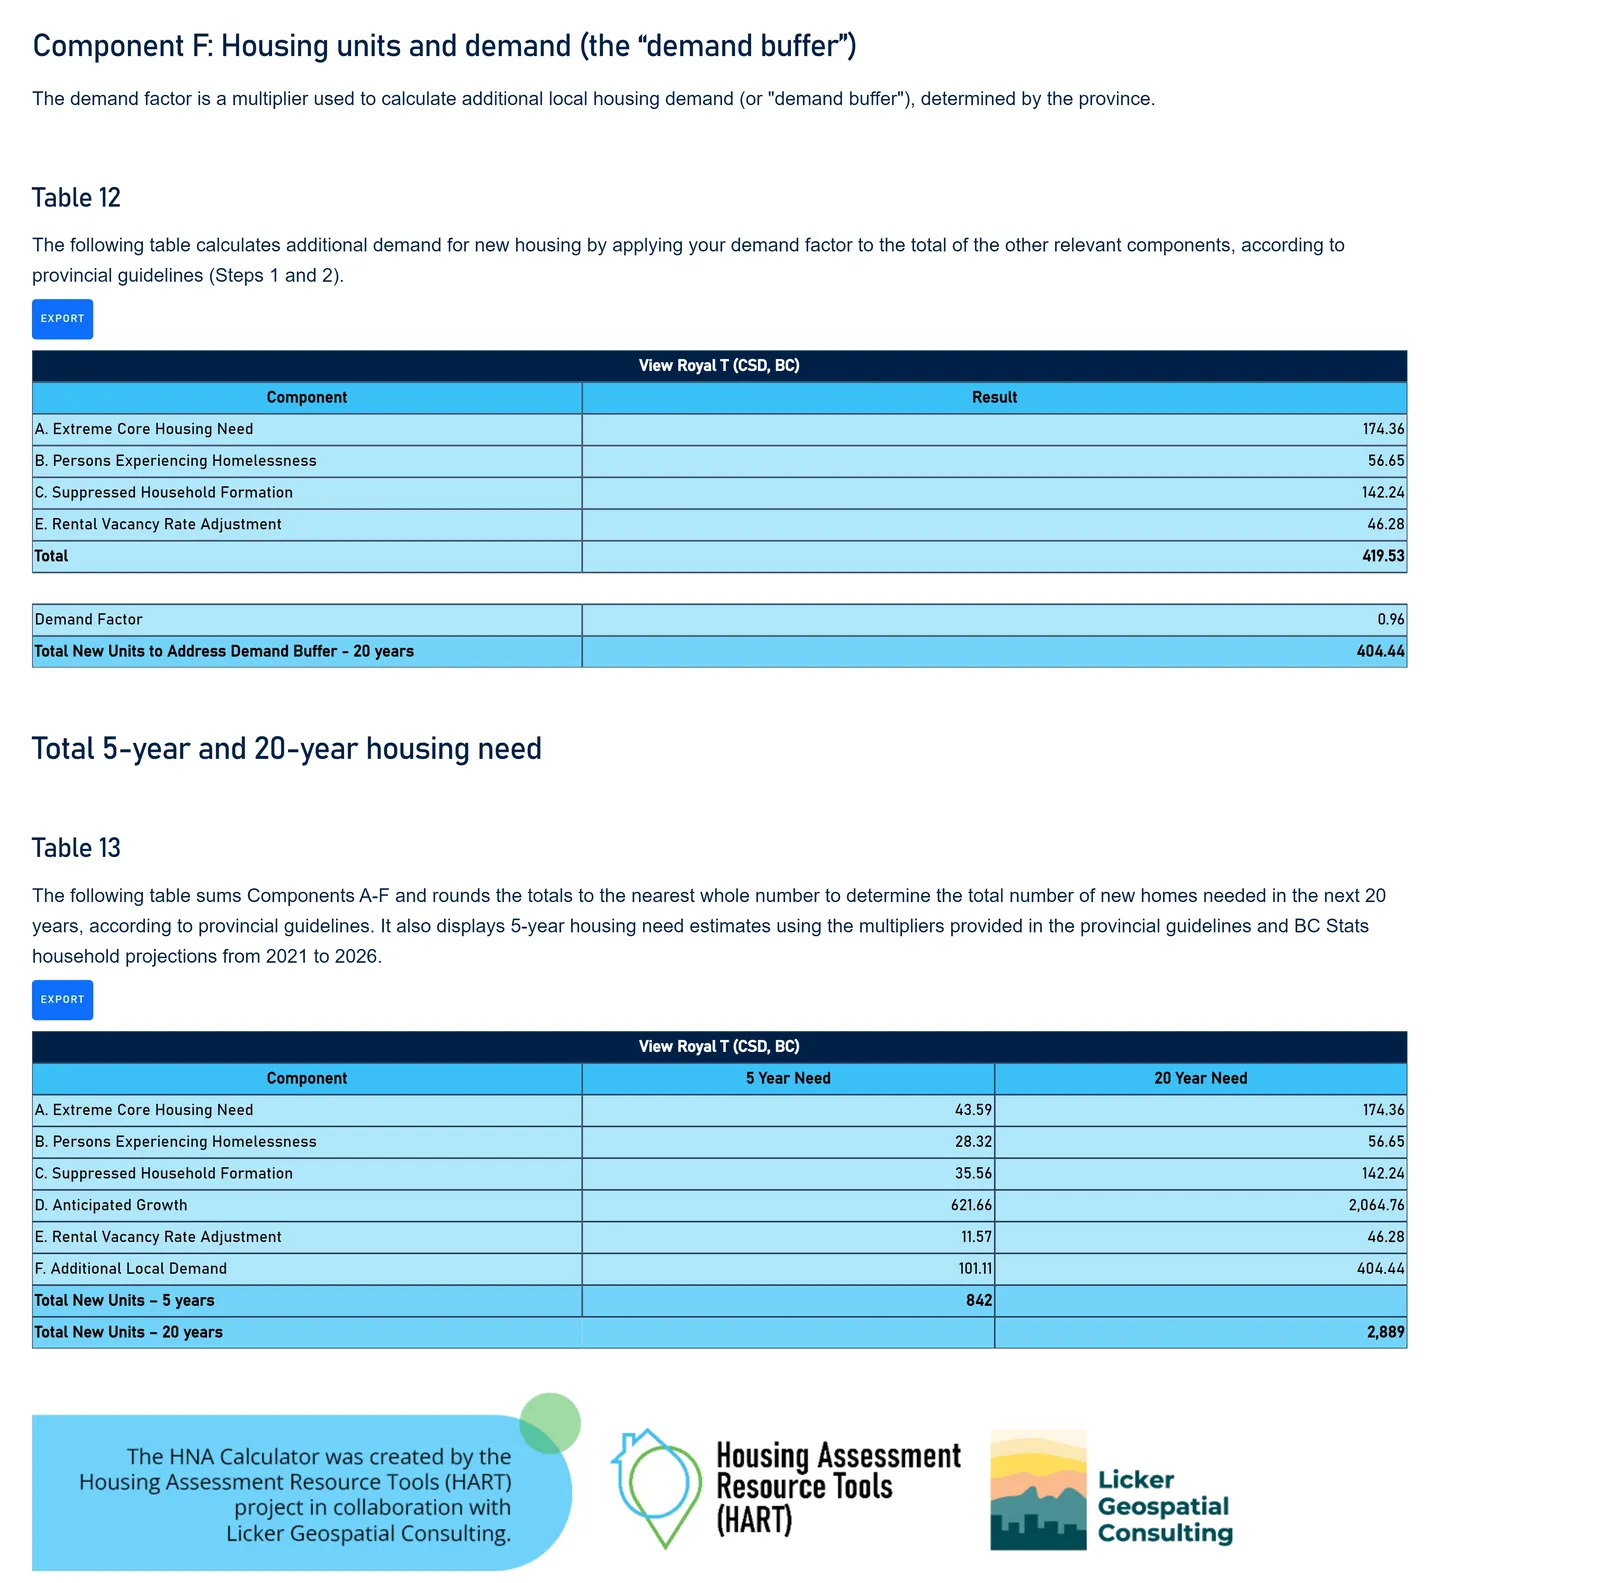
Table 12
The following table calculates additional demand for new housing by applying your demand factor to the total of the other relevant components, according to provincial guidelines (Steps 1 and 2).
| View Royal T (CSD, BC) | |
|---|---|
| Component | Result |
| A. Extreme Core Housing Need | 174.36 |
| B. Persons Experiencing Homelessness | 56.65 |
| C. Suppressed Household Formation | 142.24 |
| E. Rental Vacancy Rate Adjustment | 46.28 |
| Total | 419.53 |
| Demand Factor | 0.96 |
| Total New Units to Address Demand Buffer – 20 years | 404.44 |
Total 5-year and 20-year housing need
Table 13
The following table sums Components A-F and rounds the totals to the nearest whole number to determine the total number of new homes needed in the next 20 years, according to provincial guidelines. It also displays 5-year housing need estimates using the multipliers provided in the provincial guidelines and BC Stats household projections from 2021 to 2026.
| View Royal T (CSD, BC) | ||
|---|---|---|
| Component | 5 Year Need | 20 Year Need |
| A. Extreme Core Housing Need | 43.59 | 174.36 |
| B. Persons Experiencing Homelessness | 28.32 | 56.65 |
| C. Suppressed Household Formation | 35.56 | 142.24 |
| D. Anticipated Growth | 621.66 | 2,064.76 |
| E. Rental Vacancy Rate Adjustment | 11.57 | 46.28 |
| F. Additional Local Demand | 101.11 | 404.44 |
| Total New Units – 5 years | 842 | |
| Total New Units – 20 years | 2,889 |
Statement on Need for Housing near Transportation Infrastructure
View Royal is a dynamic, inclusive and diverse community that manages growth, while retaining the charm of its traditional neighbourhoods. It is a home and workplace to people from all walks of life. Each neighbourhood has an identifiable character and is connected to nearby centres through greenspace corridors and pedestrian/cyclist-friendly streets. View Royal recognizes the impacts of climate change, and is responding by actively promoting energy-efficient, sustainable development, and environmental protection. Well-designed compact housing near transportation infrastructure ensures choice, affordability and better use of land. Infill and redevelopment near neighbourhood centres and transit corridors provides jobs and services closer to where people live – minimizing the need for commuting, and creating pedestrian-friendly streets and destinations.
The Town is committed to:
- fostering an inclusive community that provides housing, transportation and healthy living options, and services and facilities for families and individuals of diverse backgrounds, cultures, ages and economic means;
- creating a more complete and sustainable community by directing the majority of new growth into compact, mixed-use centres, connected by excellent, multimodal transportation infrastructure, including transit, and bike and pedestrian pathways, that entice people to walk, bike and ride the bus;
- ensuring that new development is directed to areas well served by transportation infrastructure, and that population densities provide the ridership numbers required to make transit service financially viable, especially in areas surrounding transit stations;
- supporting opportunities that expand and establish a more connected public transportation network, through the use of land use, provision of housing, and partnerships with our community stakeholders, BC Transit and other levels of government;
Town of View Royal Housing Actions
The following are a list of actions completed by the Town of View Royal since the adoption of the Town’s Housing Need Report¹ on July 21, 2020. The following actions are summarized for inclusion in the Town’s Interim Housing Needs Report (IHNR) and highlight the municipality’s progress towards reducing housing need in the community.
| Date | Project | Description | Status |
|---|---|---|---|
| July 21, 2020 | Housing Needs Report | Council received the Housing Needs Assessment Report prepared by Urban Matters on July 21, 2020, during a regular Council meeting. | Approved - Ongoing |
| July 18, 2023 | Tenant Assistance Policy | In 2023, the Town adopted a Tenant Assistance Policy to mitigate the negative impacts on residential tenants in the Town that are displaced because of substantial renovations or the redevelopment of their home. The policy offers further support to tenants and requires additional responsibilities of landlords beyond the Residential Tenancy Act. The Policy requires the following be completed where a tenant is being removed from their permanent place of residence: a tenant assistance plan, a tenant relocation coordinator, a letter to the tenants communicating their rights per the policy, relocation assistance, right of first refusal, moving expenses and assistance, rent compensation, and a tenant relocation status report. | Approved – Ongoing |
| November 21, 2023 | Secondary Suite Permits | In November 2023, the Town adopted amendments to the Zoning Bylaw and other supporting bylaws, to reduce the regulation of secondary suites. The changes included removing the requirement that a secondary suite was only permitted where the residence was owner occupied, and that an annual permit would be required. The Town no longer requires Secondary Suite Permits for new suites, instead these are processed via a building permit. This avoids double permitting fees and ongoing annual fees. | Approved - Ongoing |
| May 21, 2024 | Transit Oriented Area (TOA) Designation Bylaw | In May 2024, the Town adopted a bylaw to designate the Town’s single Transit Oriented Area (TOA), located on Hospital Way, adjacent to Victoria General Hospital. The TOA is made up of an area that extends 400 m outward from the bus stop, and is further classified by two sub-areas, one that extends 200 m, and another than extends between 201 m and 400 m. The permitted density and height of the lands are regulated through the Local Government Act and Provincial Policy Manual: Transit-Oriented Areas. | Approved - Ongoing |
| Jan – June 18, 2024 | SSMUH Update | In June 2024, the Town adopted Zoning Bylaw Amendment Bylaw No 1135, 2024, which included the required amendments to ensure consistency between housing legislation to allow 3 to 6 units in all restricted zones that only permit single-family dwellings and duplexes. | Approved - Ongoing |
| June 18, 2024 | Official Community Plan Amendment & Zoning Bylaw Amendment | In July 2024, the Town amended the Official Community Plan by adding new development permit requirements. This includes a new Intensive Residential Garden Suite Form and Character Development Permit Area. A lot that permits a single-family house is permitted to have a garden suite and/or a secondary suite. The Town also introduced garden suites as a new use in the Zoning Bylaw. Through the introduction of garden suites as a permitted use, the Town has allowed for amore diverse range of housing types and tenures. | Approved - Ongoing |
| June 18, 2024 | Official Community Plan Amendment | In July 2024, the Town amended the Official Community Plan’s Form and Character Schedule (map) by adding all Small-Scale, Multi-Unit Housing (SSMUH) parcels to the Mixed Residential Form and Character Permit Area. | |
| July 16, 2024 | Delegation Bylaw Amendment | In July 2024, the Town amended the Delegation Bylaw by granting delegated approval authority of garden suite development permits, and the approval of environmental terrestrial and watercourse and shoreline area development permits to the Director of Development Services. In addition, the Town authorized the Director of Development Services to renew development permits for residential and commercial form and character development permits, as well as environmental development permits. All variances must be referred to Council and are subject to Council’s approval. | Approved - Ongoing |
| July 16, 2024 | Zoning Bylaw Amendment | In July 2024, the Town amended the Zoning Bylaw by changing the provisions of Density within all standard zones of the Bylaw. Lot Coverage and Impermeable Surface Area were removed from the Lot Density section of each zone and placed under a new heading: Lot Density and Impermeable Surface Coverage. The change allows existing home owners and prospective developers to avoid having to go through a rezoning application where their proposed lot coverage and/or impermeable surface area exceeds the permitted maximum. Instead, applicant may now go through a Development Variance Permit application process, which is subject to Council’s review. The change improves consistency with other municipalities approach to density provisions in their zoning bylaws. The change is also expected to improve application processing. | Approved - Ongoing |
| July 22, 2024 | OCP Update | In July 2024, the Town initiated its update of the Official Community Plan by starting with an engagement survey, asking participants how they would like to be involved, and what is important to them moving forward. The survey is to start the conversation around the OCP update, which is to be completed by December 31, 2025. Completion of the OCP update will provide an update to a 14 year old document, providing significant update to current and future needs, interest, and values of the community and how it is to grow and develop moving forward. | Approved - Ongoing |
| September 2024 | Number of new housing units | 184 dwelling units have been completed in 2024 and 588 are currently under construction. | Completed |
¹ Housing Needs Assessment Report prepared by Urban Matters dated July 2020