Town of View Royal HOUSING NEEDS ASSESSMENT REPORT (Attachment 2)
Comprehensive 2020 report prepared by Urban Matters detailing demographics, affordability, and housing gaps in the community.
Town of View Royal HOUSING NEEDS ASSESSMENT REPORT
Prepared for: Town of View Royal 45 View Royal Avenue Victoria, BC VV9B 1A6 Attn: Lindsay Chase, Director of Development Services
Prepared by: Urban Matters CCC 550-1090 Homer Street Vancouver, BC V6B 2W9 Matt Thomson, Community Housing Lead mthomson@urbanmatters.ca
ATTACHMENT 2
EXECUTIVE SUMMARY
Population and Demographics
Information on population and demographic statistics paint the picture of how many residents live in the Town of View Royal, helping identify demographics that may have specific housing demands or for whom housing may need to be planned for in the future.
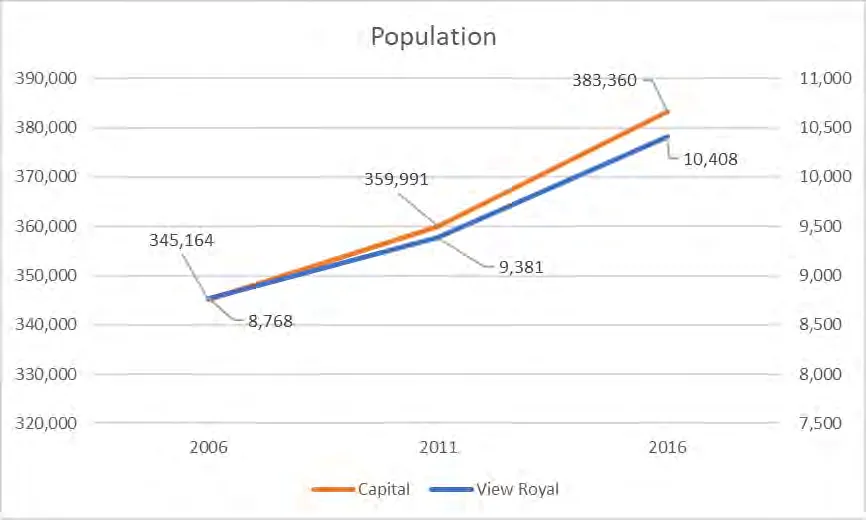
- The population in View Royal grew faster between 2006 and 2016 than in the CRD as a whole, indicating that increased growth and development will likely continue to impact development and planning considerations over the next five to ten years.
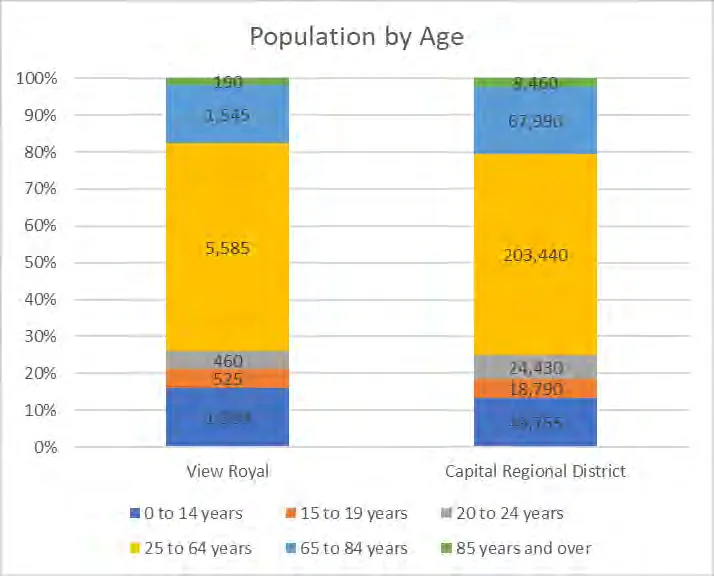
- Generally, the age composition of the community is comparable to the CRD as whole, with a slightly aging demographic and an increasing median age. This points to a need for increased considerations around age-appropriate housing, planning for retaining and attracting younger demographics, and supporting aging-in-place options.
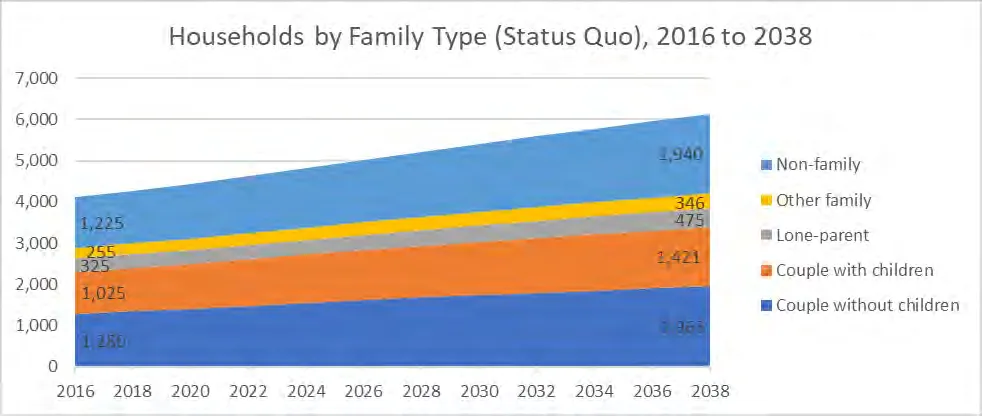
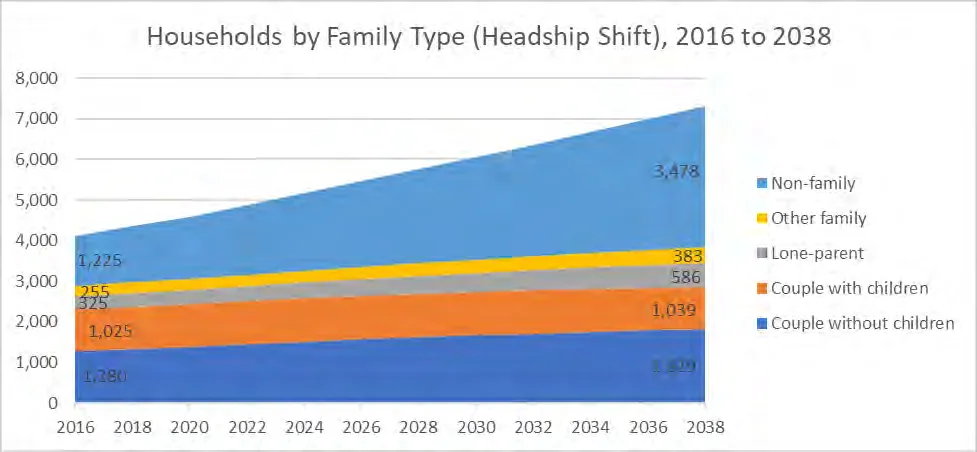
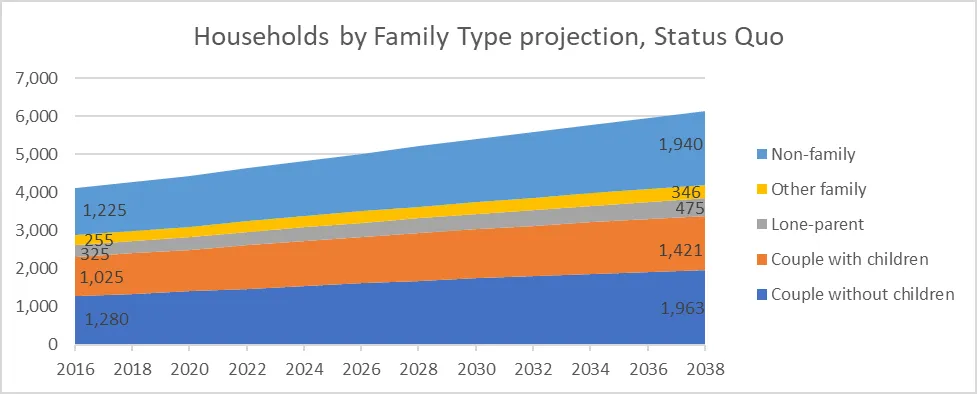
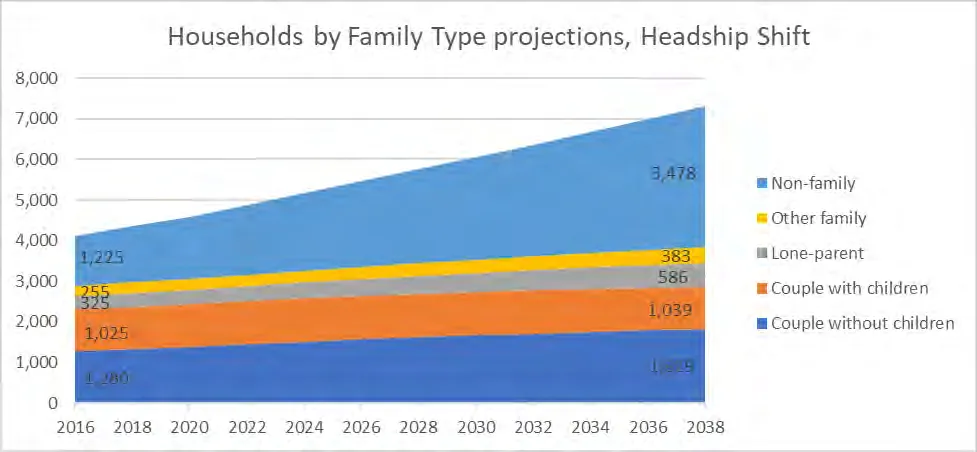
- About half of new households projected to be formed by 2040 will be non-family households, while about half will be family households. This is consistent with an aging population that may have more single-person households.
Economy and Income
Understanding economic and income measures allows us to understand what current residents of View Royal can afford in terms of housing, and how View Royal’s economy compares to the region.
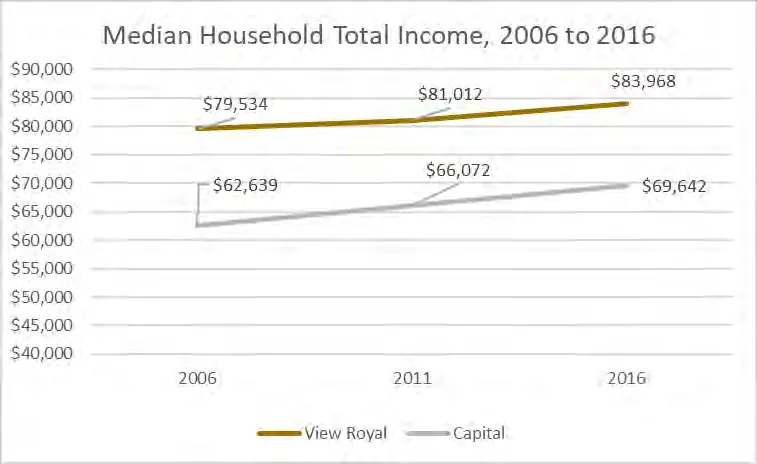
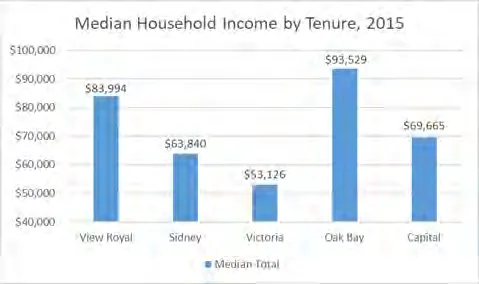
- Median household income in View Royal has steadily increased between 2006 and 2016; although it is increasing more slowly than in the CRD as a whole, overall incomes remain higher in View Royal than in the CRD, and View Royal households generally earn more than counterparts in other central CRD municipalities.
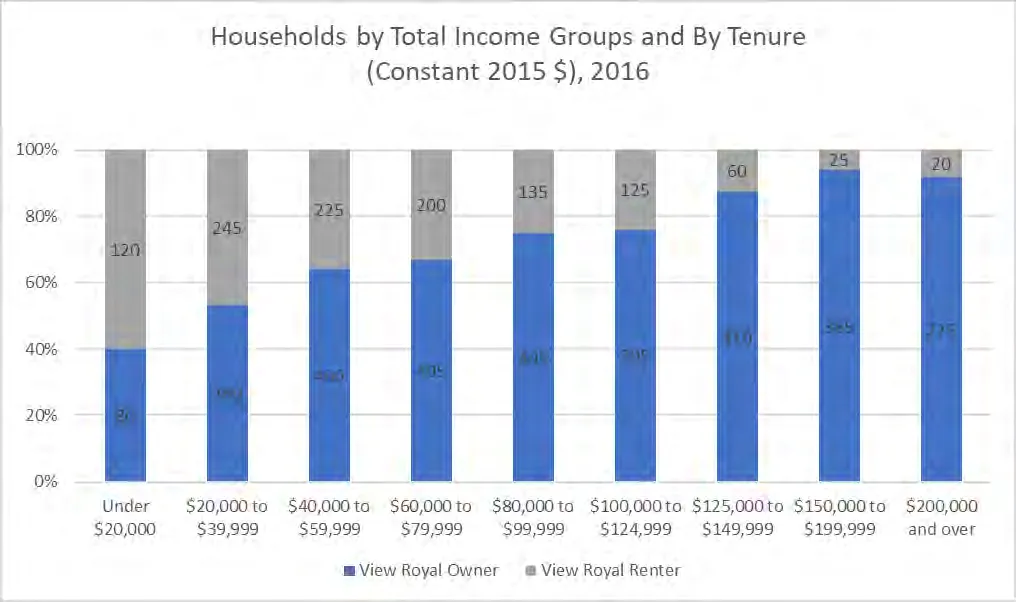
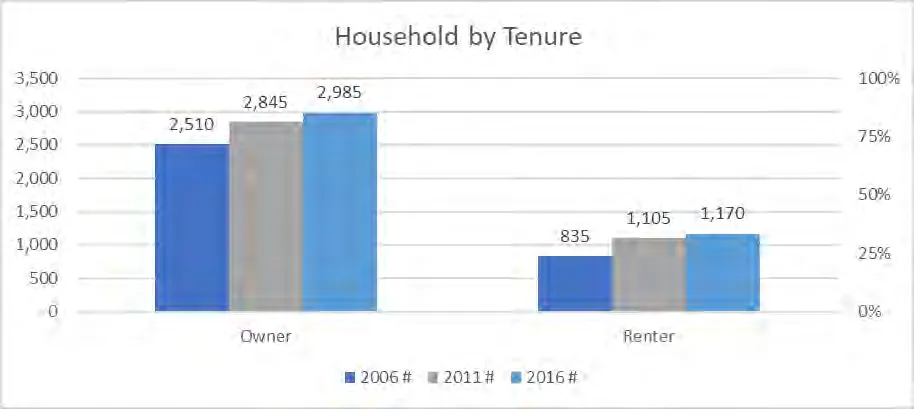
- Ownership is the predominant form of tenure, and the wealthier a household is, the more likely it is to own; only households earning less than $20,000 annually are majority renters (60%). In the wealthiest income group, 92% are owners, and 8% of households are renters, indicating a small market for high-end rental dwellings.
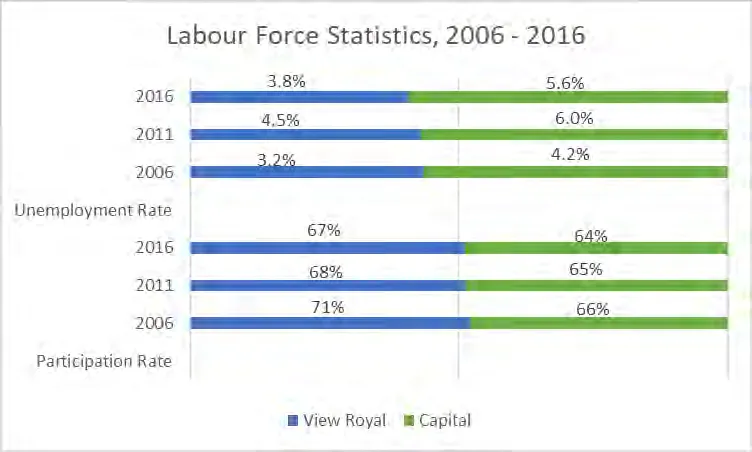
- Economically, View Royal is slightly stronger than an already economically strong CRD, with lower unemployment rates and higher labour force participation.
Housing in View Royal
Understanding the Town of View Royal’s housing stock is fundamental to understanding current availability and housing needs in the community and identifying potential areas for change to accommodate growth.
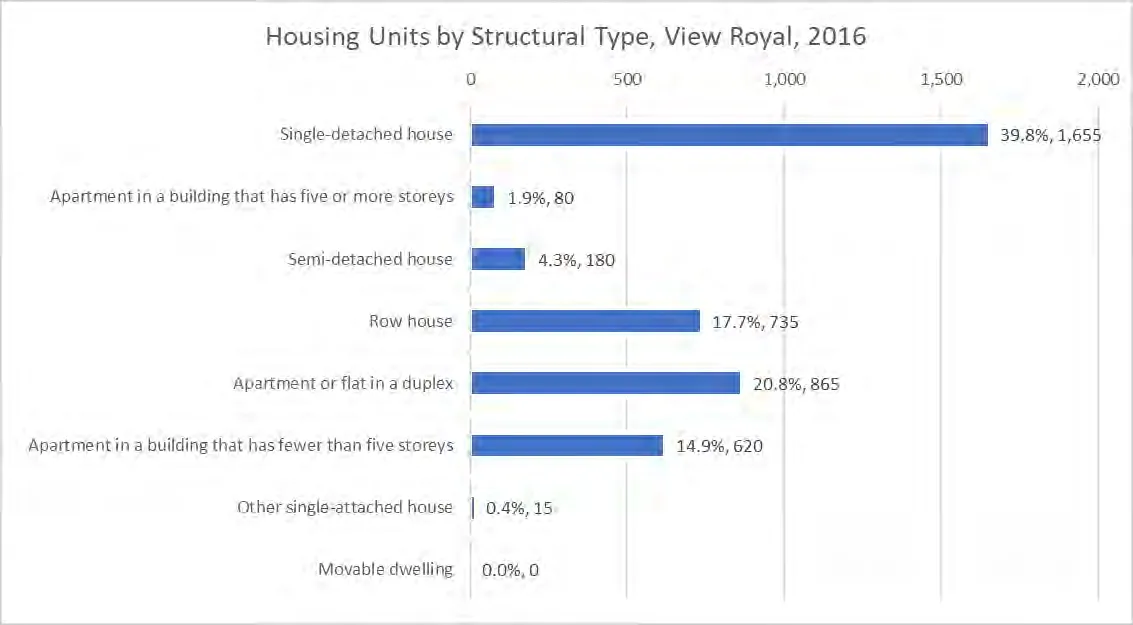
- View Royal has 4,155 dwellings. Single family homes (40% of all dwellings), duplexes or homes with a secondary suite (20.8%) and semi-detached houses (4%) accounted for nearly two-thirds of View Royal’s homes in 2016, while units in small apartments (15%) and townhouses (18%) accounted for the remaining third, with units in larger apartments (2%) and other single family dwellings (less than 1%) making up the remaining small number of units.
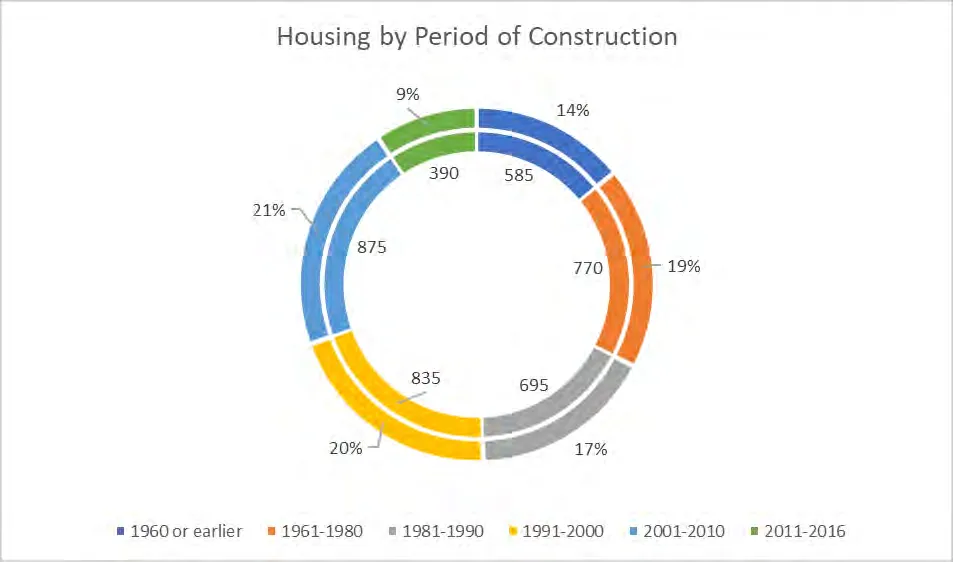
- One-third of View Royal’s housing stock was built in 1980 or before (33%), about 37% were built between 1981 and 2000, and about 31% were built in 2001 or after. This does not account for new units built since 2016: 507 building permits were issued for dwelling units between 2017 and 2019, with demolitions netted out.
- Over half of all dwellings (52%) are 3 or more bedrooms; however, only just over a third (35%) of all households have 3 or more people. This could indicate that smaller households, particularly older households, may be ‘over-housed’ which can impact the ability to age in place for older seniors (aged 85+).
- Construction is spread relatively evenly over a range of ages, meaning there’s a diversity in the age of the housing stock.
- A healthy rental vacancy rate is often deemed to be 3-5%, and View Royal’s vacancy rate has remained below this since 2013; in 2019 the vacancy rate was 0.7%.
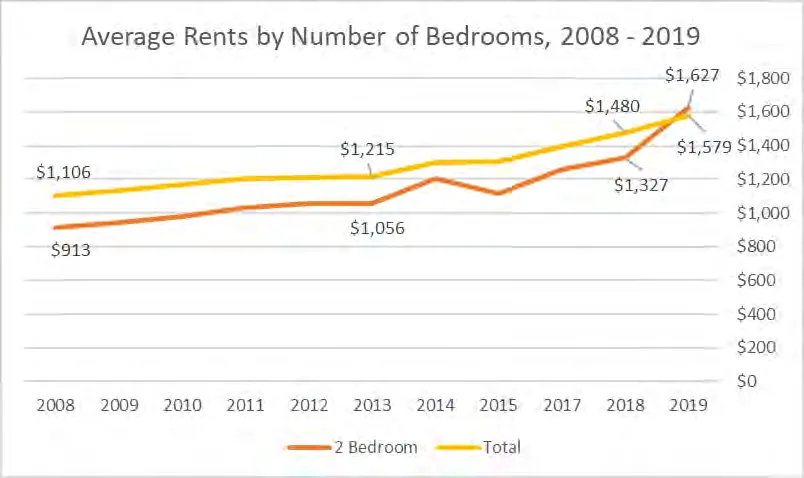
- View Royal saw a 43% increase in primary rental rates over the last 11 years, from an average monthly rent of $1,106 in 2008 to an average of $1,579 in 2019.
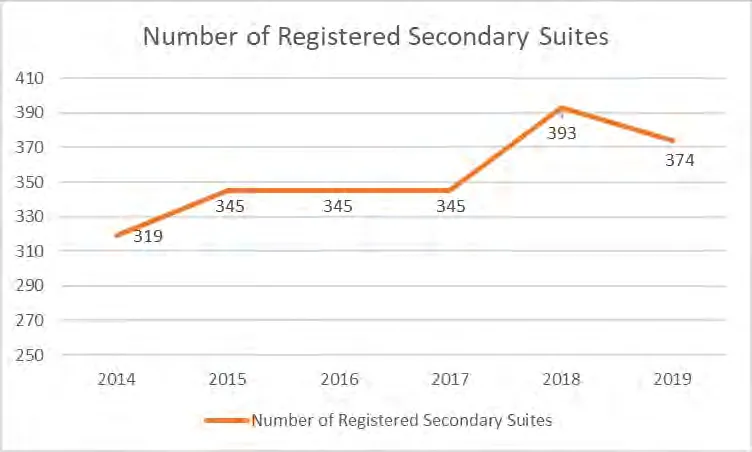
- In 2019, there are approximately 1,185 rental households with 374 (27%) of them being permitted Secondary Suites.
- 2019 saw the addition of 218 new purpose-built rental units to View Royal, considerably increasing the number of units tracked by CMHC from around 260 units, to 414 units in October 2019 (with 60 new units not captured by CMHC’s survey).
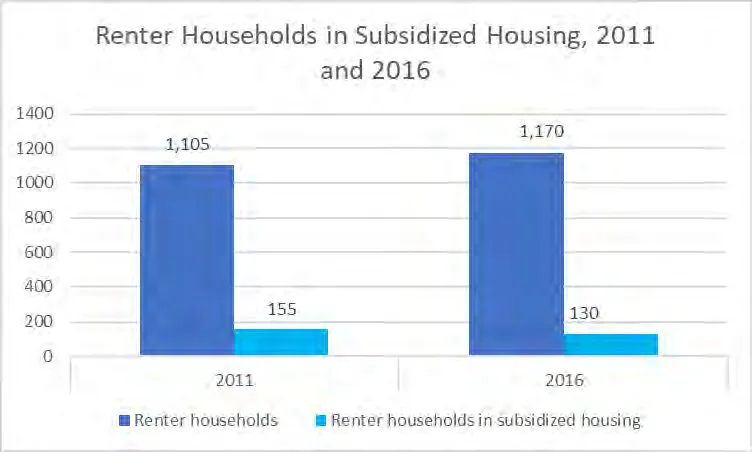
- With renter households growing by 40% between 2006 and 2016, this added much needed purpose-built rental stock to the market; however, a large proportion of renters are still renting in the secondary market (meaning private homes and secondary suites, not purpose-built rental), and vacancy rates remain very low in View Royal.
- Between 2016 and 2019, 218 new private market rentals were created at Eagle Creek and Watkiss, which represents an approximate 19% increase in rental households.
Based on this understanding, areas of demand, or housing gaps, and areas of oversupply have been identified.
- For renter households, the Town has an availability rate of 1 percent – signalling that there is no oversupply of rental units. Rather, there is a lack of available rental housing units to meet demand. This constrains renters, as they are potentially unable to access suitable housing to meet their needs at price points that work with their budgets. This results in higher income households renting and vulnerable renter households getting pushed out, as they cannot compete for the limited available units. This can also drive rents up, as supply is limited, generating need for additional non-market units. Rental housing is a key area of need for the Town, including purpose-built rental, secondary market rental options (such as secondary suites, lock-off units, and carriage houses), and non-market / affordable rental housing units.
- With regards to ownership, there is demand for affordable ownership options, missing middle options like row homes, multi-attached forms, and larger apartments (i.e., 3+ bedrooms). These types of middle options could also help serve the needs of older homeowners looking to downsize. Recent average sales prices suggest that row houses (i.e. townhouses) remain unaffordable for most household types, regardless of the number of bedrooms. While they are more affordable compared to single-detached homes, all household types earning the median income likely cannot afford monthly shelter costs for row houses with 3 or more bedrooms. Couples with children who are making the median income for their household type are likely only able to afford 2-bedroom row houses.
- There may be an oversupply of the predominant housing form, single family homes. This housing type is currently unaffordable to all median-earning household types. Additionally, the statistics indicate that some households may be over-housed: while 63% of homes in the Town had three or more bedrooms in 2016, only 34% of the population were three or more person households. This suggests that smaller households, which are often older residents, may be occupying larger homes. There are many reasons why smaller households may choose to continue to live in single family homes; however, this type of housing remains the least affordable, but forms the majority of the housing supply. In recent years (i.e., since 2016), the majority of building permits approved by the Town have been for multi-family development. Multi-family generally provides more options for downsizing and meeting the needs of the missing middle.
Affordability
An analysis of what median incomes can afford and the cost of owning or renting a house is vital to understanding where gaps or needs in the housing system may be for current and future residents of View Royal.
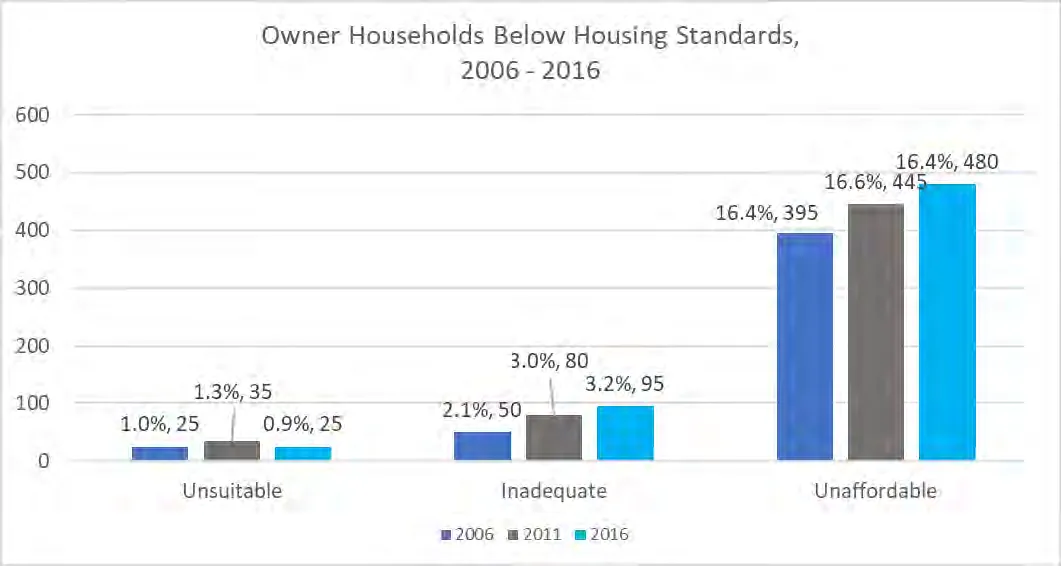
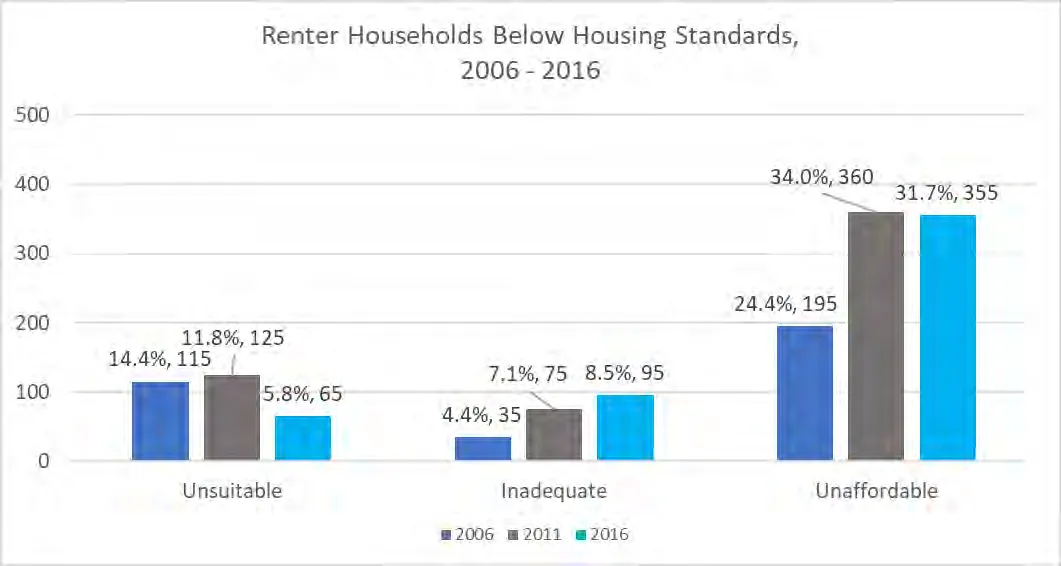
- Affordability is a challenge for both renters and owners; the number of both owner and renter households spending 30% or more of their income on housing increased between 2006 and 2016.
Table 1: Affordability for Owners, View Royal, 2018
| Households | Median Household Income (2018) | Affordable Shelter Payments | Shelter Costs, Single Detached ($819,233) | Shelter Costs, Row House and Townhomes ($512,362) | Shelter Costs, Apartment ($407,700) |
|---|---|---|---|---|---|
| Couple-with children | $129,287 | $3,232 | $3,965 | $2,891 | $2,378 |
| Couple-without children | $99,028 | $2,476 | $3,965 | $2,891 | $2,378 |
| Lone-parent | $64,543 | $1,614 | $3,965 | $2,891 | $2,378 |
| One-person household | $46,696 | $1,167 | $3,965 | $2,891 | $2,378 |
The analysis indicates that:
- Most households making the median income cannot afford the average single-detached home, which means that the single-detached form is unaffordable for more than half of households in the community.
- Lone-parents and one-person households with a median income are unable to afford shelter costs for all average-priced home types.
- Median-earning couples without children are able to afford smaller dwelling types (multi-plex and apartments) but may have challenges affording a row home and cannot afford a single-detached home.
- Median-earning couples with children are most likely to be able to afford all housing types. They can likely afford smaller row houses and 2-bedroom apartments, but likely cannot afford a single-detached home.
- These patterns of unaffordability are consistent regardless of dwelling size. When broken out by size and structure type, households are still unable to afford the same dwelling types. The only difference is for median-earning couples with children, who can likely afford row houses with 2 bedrooms but likely cannot afford row houses with 3 or more bedrooms.
Table 2: Affordability for Renters, View Royal, 2018
| Households | Median Household income (2018) | Affordable Shelter Costs (monthly) | 1 bedroom ($1,319) | 2 bedrooms ($1,627) | 3 bedrooms (n/a) | Average Rental ($1,579) |
|---|---|---|---|---|---|---|
| Couple-with children | $129,287 | $3,232 | n/a | $1,627 | n/a | $1,579 |
| Couple without children | $99,028 | $2,476 | $1,319 | $1,627 | n/a | $1,579 |
| Lone-parent | $64,543 | $1,614 | n/a | $1,627 | n/a | $1,579 |
| One-person household | $46,696 | $1,167 | $1,319 | $1,627 | n/a | $1,579 |
Core Housing Need
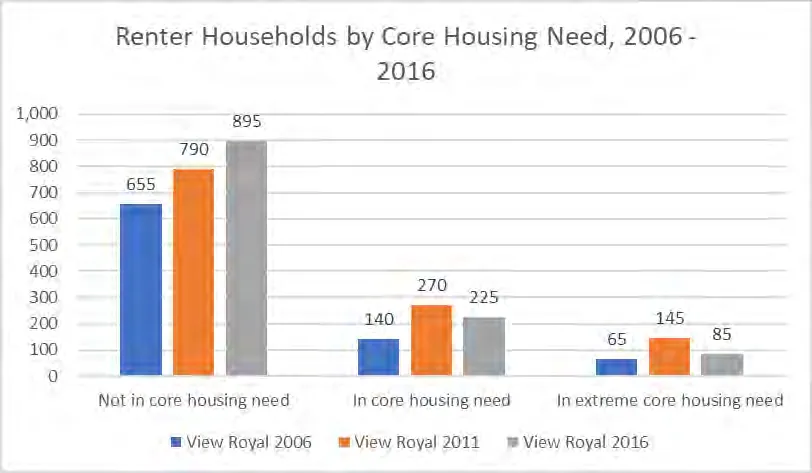
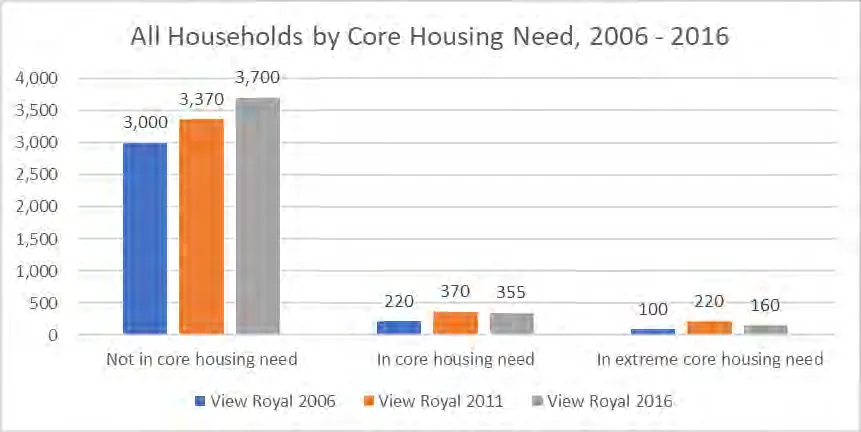
- Renters are about 5 times as likely to be in core housing need as owners; renter households represent 63% of households in core housing need, but only about 28% of all households.
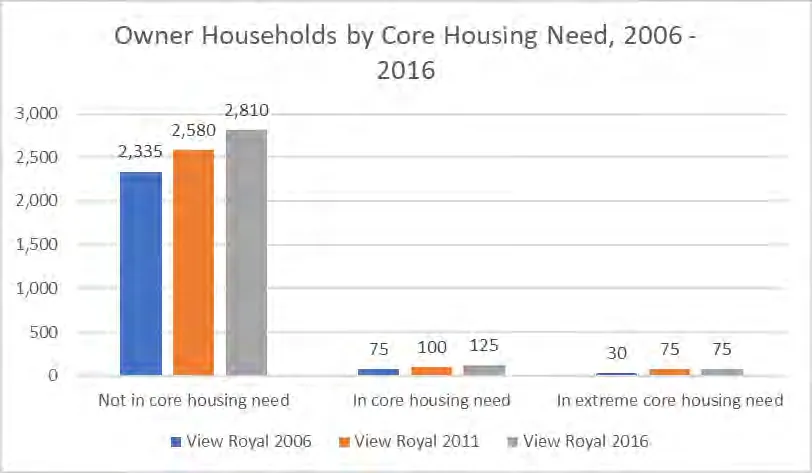
- Core housing need provides a strong indicator of the need for non-market housing units. Overall, there were 355 households in core housing need in View Royal in 2016; 225 of these households (63%) were renters and 125 were owners. One hundred sixty households are in extreme core housing need, composed of 85 renters and 75 owners.
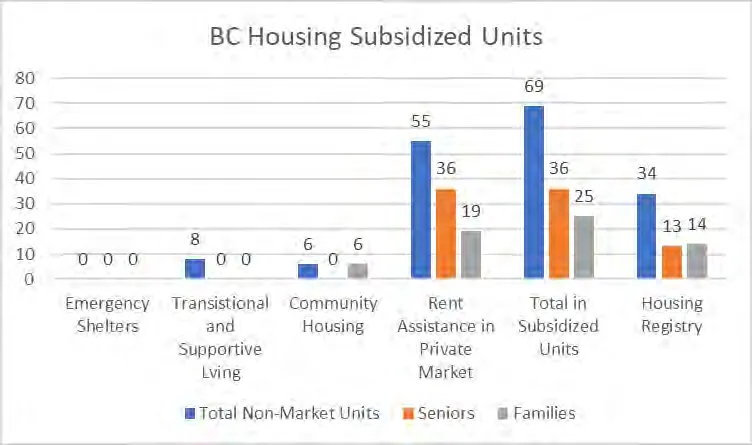
- Based on projections, as of 2019, the Town likely has a need for affordable units for approximately 229 renter households and 131 owner household in core housing need. There are a further 34 households currently on the BC Housing Registry who are also in immediate need of affordable housing assistance.
- This indicates a need for more than 200 non-market rental units, as well as programs and supports for affordable ownership.
Summary of Key Themes
- High Cost of Housing: The increased cost of housing is outpacing income growth in View Royal.
- Diversity of Housing Stock and Affordability: Diverse and more affordable types of housing are not currently being built to support the ‘missing middle’ demographics.
- Purpose-Built Rental is Not Keeping Pace With Demand: Despite growth, the vacancy rate was 0.7% in October 2019.
- Need for Non-Market Units: As of 2019, estimates suggest there are at least 229 renter households in core housing need.
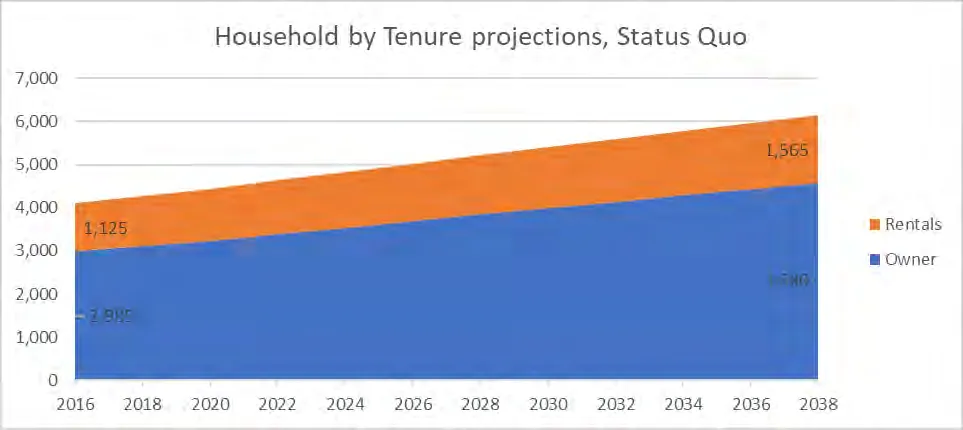
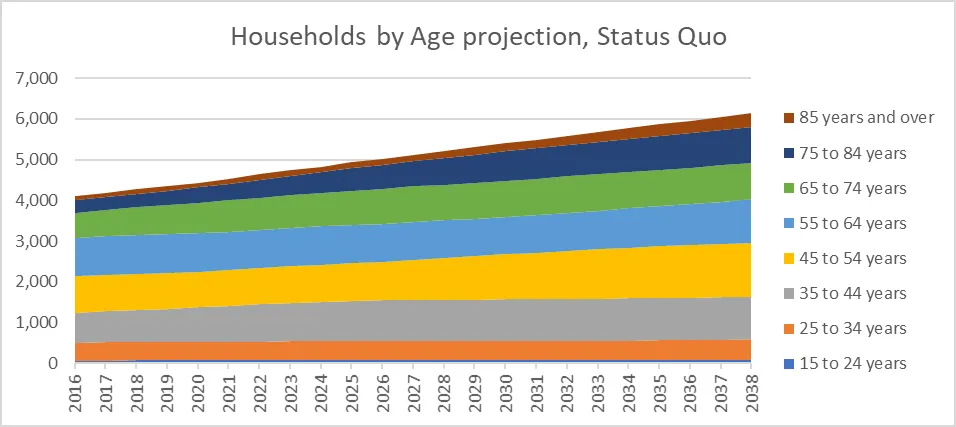
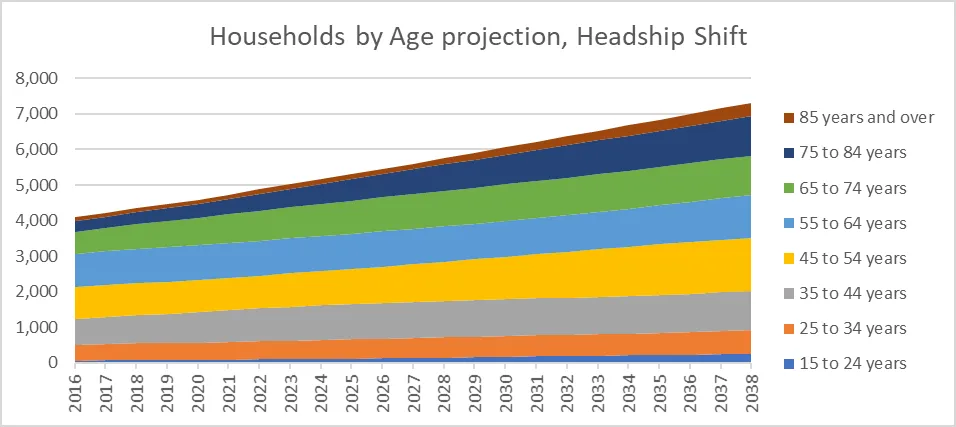
- Planning for an Aging Population: By 2038 over one-third of households in View Royal will be led by adults older than 65.
1 INTRODUCTION
1.1 Project Overview
Like many communities in British Columbia (BC), View Royal has been facing housing pressures in recent years due to market conditions in the province and changing demographics. To better understand the challenges and how to respond to them, the Town initiated this Housing Needs Assessment (HNA) to build a more complete understanding of current and future housing needs in the community.
1.2 Provincial Requirements for Housing Needs Reports
The Housing Needs Reports regulations require local governments to collect approximately 50 distinct kinds of data about current and projected population, household income, significant economic sectors, and currently available and anticipated units.
1.3 The Housing Wheelhouse
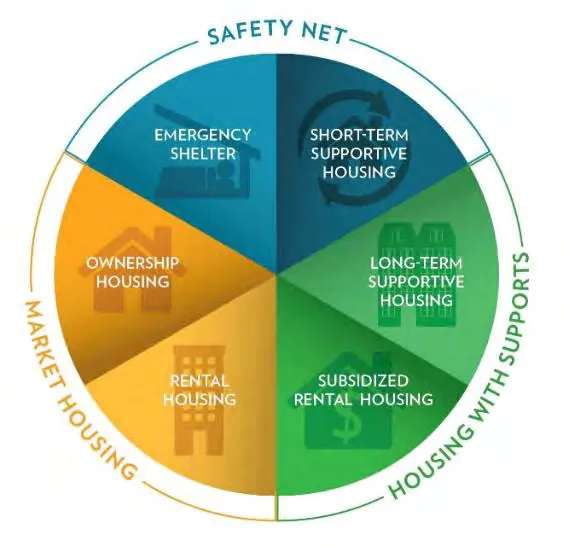
Recognizing the limitations of the traditional "housing continuum," the City of Kelowna developed a “housing wheelhouse” model. This model demonstrates that progression through housing options may not always be linear.
1.4 Methods and Limitations
This HNA draws on both available statistical information on demographics and housing in View Royal and the Capital Regional District (CRD). Data was collected from Statistics Canada (censuses and National Household Survey), CMHC, BC Housing, Co-operative Housing Federation of BC, BC Assessment, and BC Statistics.
2 Demographic Profile and Projections
2.1 Population
Between 2006 and 2016, View Royal grew 18.7%, representing 1,640 individuals. Proportionally, View Royal grew at a faster rate than the CRD’s 11.1%.
2.2 Age
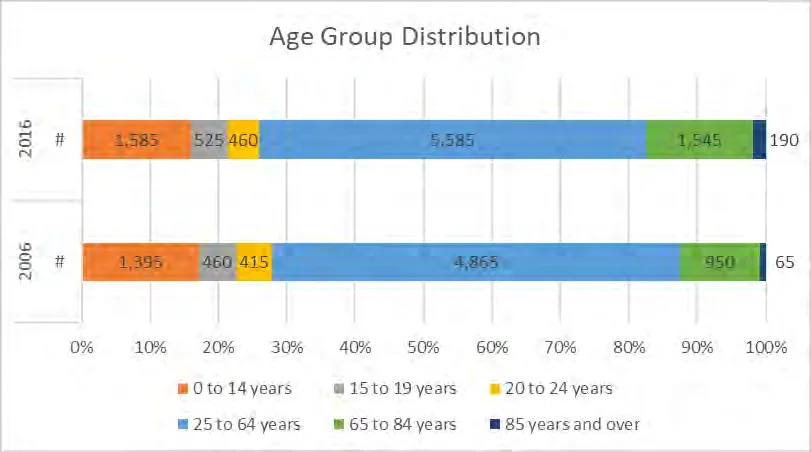
The median age in the Town of View Royal has seen a modest rise from 41 years to 44 years old in 2016, which is comparable to the CRD’s median age of 45.
2.3 Mobility
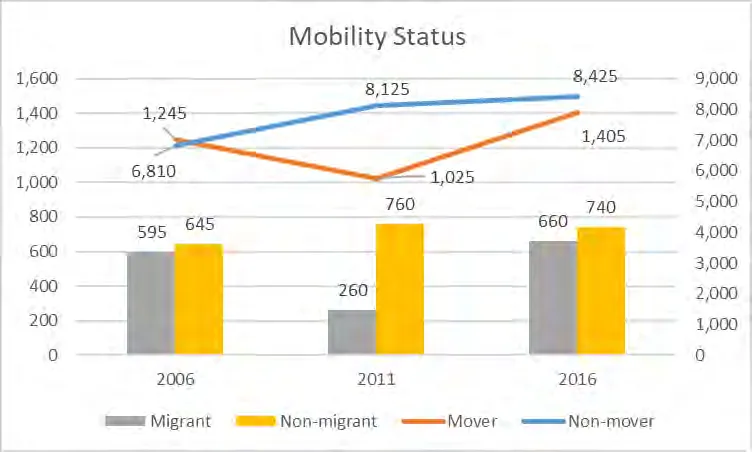
Between 2011 and 2016 about 1,400 residents (or 14.2%) moved in View Royal. About half (52.7%) moved within View Royal, while 660 (47.0%) moved from outside the community.
2.4 Households
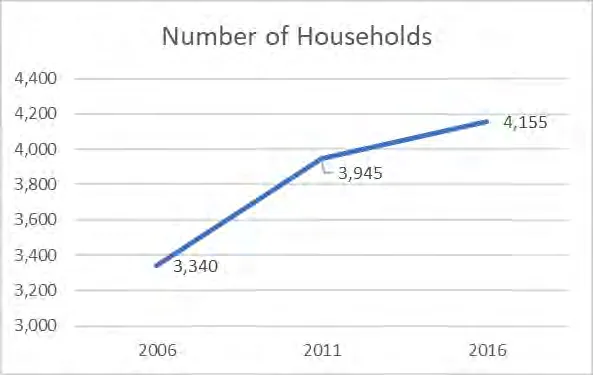
From 2006 to 2016, the number of households increased from 3,340 to 4,155, or 815 additional households, representing a growth of 24.4%.
2.5 Household Size
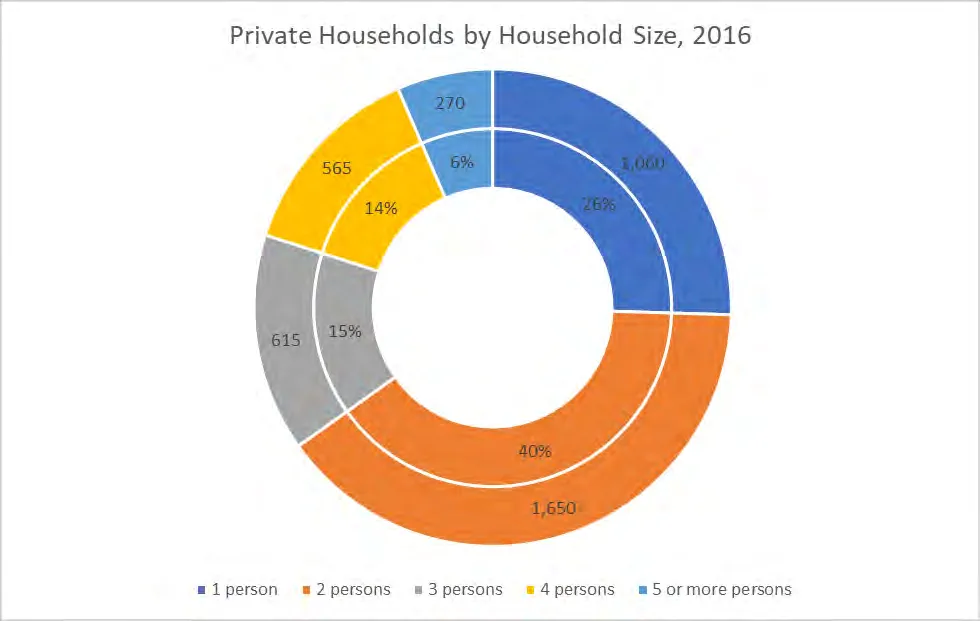
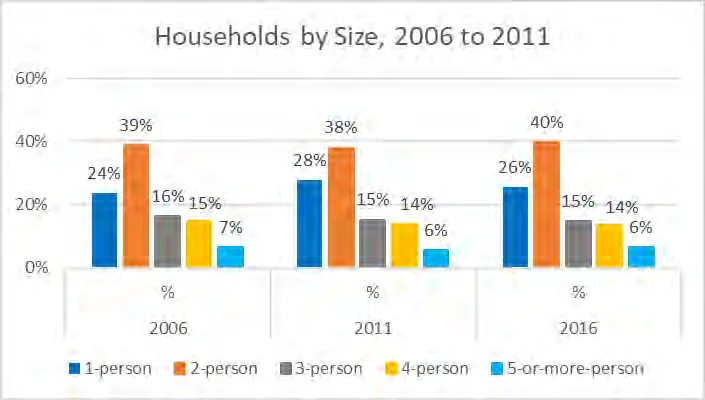
The average household size has remained steady at 2.4 since 2006.
2.6 Population Projections
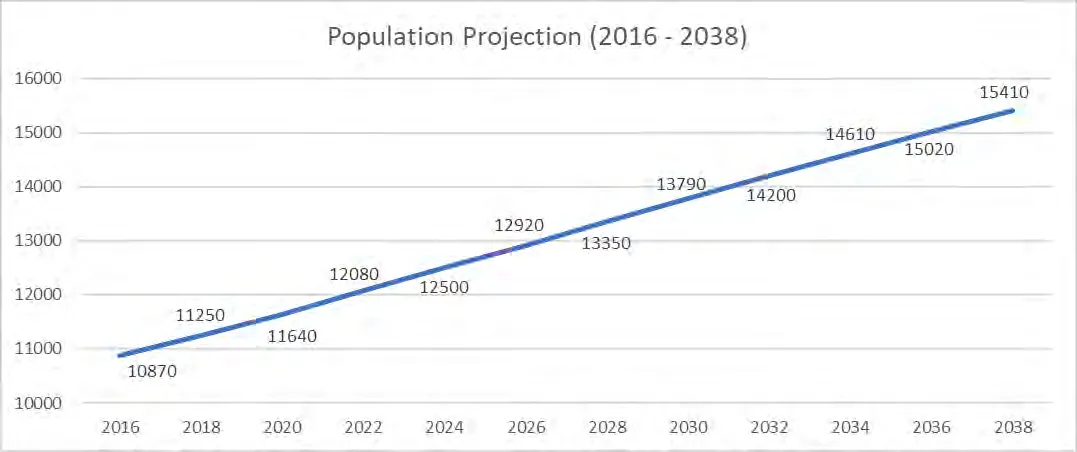
The population within the Town of View Royal is projected to climb 22 percent from 10,870 to 13,350 in 2028 and may grow to 15,410 by 2040.
2.7 Dwelling Projections
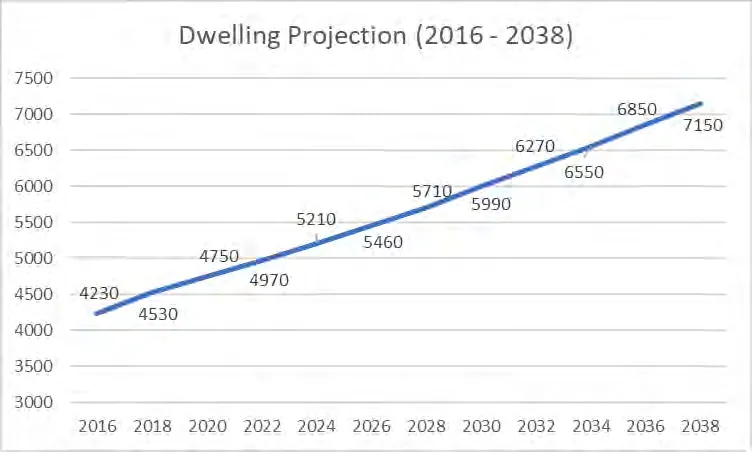
Figure 10 illustrates a projected increase of 35% or 1,480 dwellings from 4,230 in 2016 to 5,710 by 2028.
2.9 Household Projections
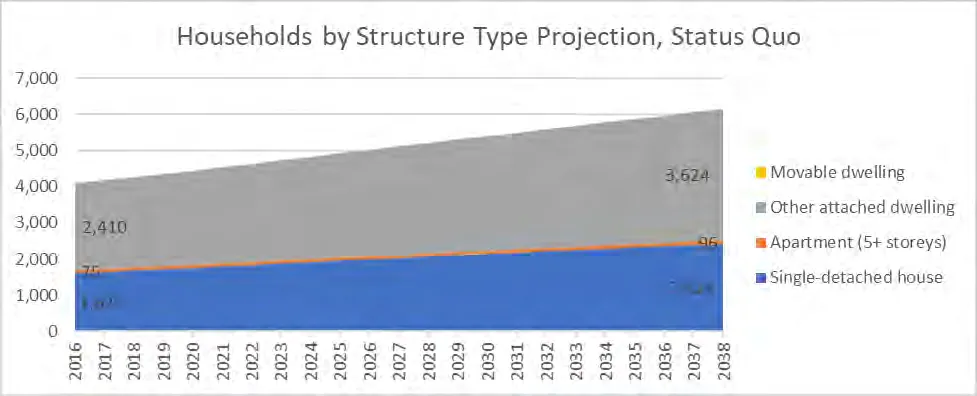
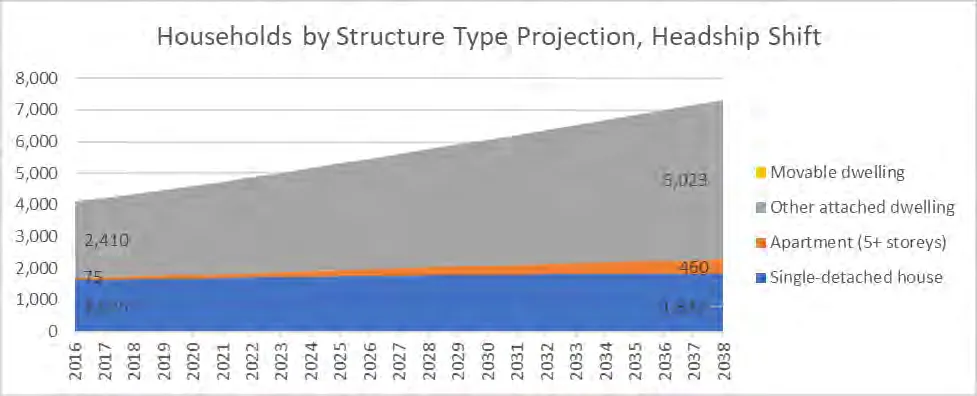
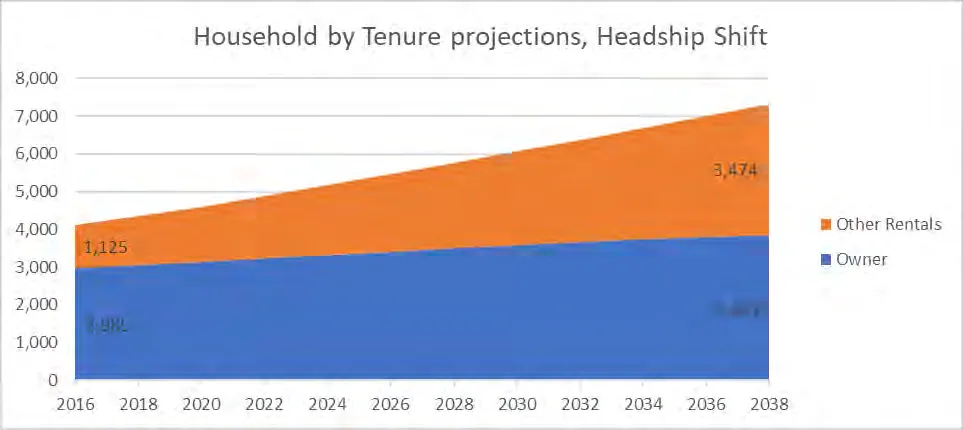
Household projections have been broken into two different scenarios based on two headship rates.
3 Income and Economic Profile
3.1 Household Incomes
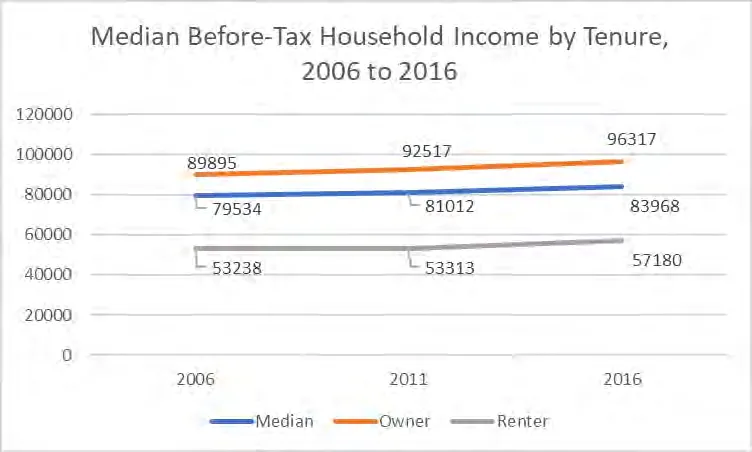
The median household income in View Royal has increased from $79,534 in 2006 to $83,968 in 2016, representing a 5.6% increase.
3.2 Households by Income Brackets
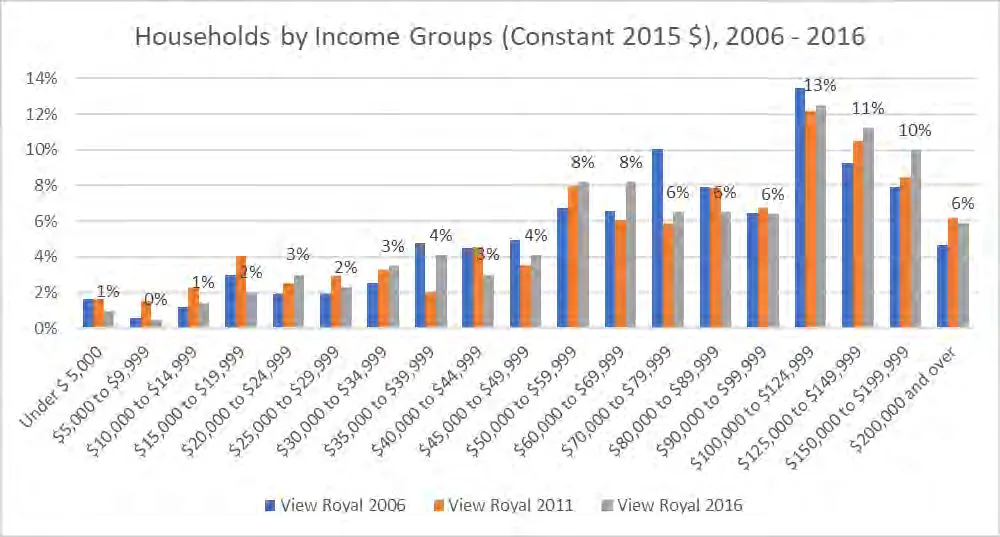
About three quarters (74%) of households make $50,000 or more, while about a quarter (26%) make less than $50,000.
3.3 Owner and Renter Household Income
Owner household median income increased by $6,422 from 2006 to 2016, compared to a $3,942 increase for renter households.
3.4 Workers by Industry
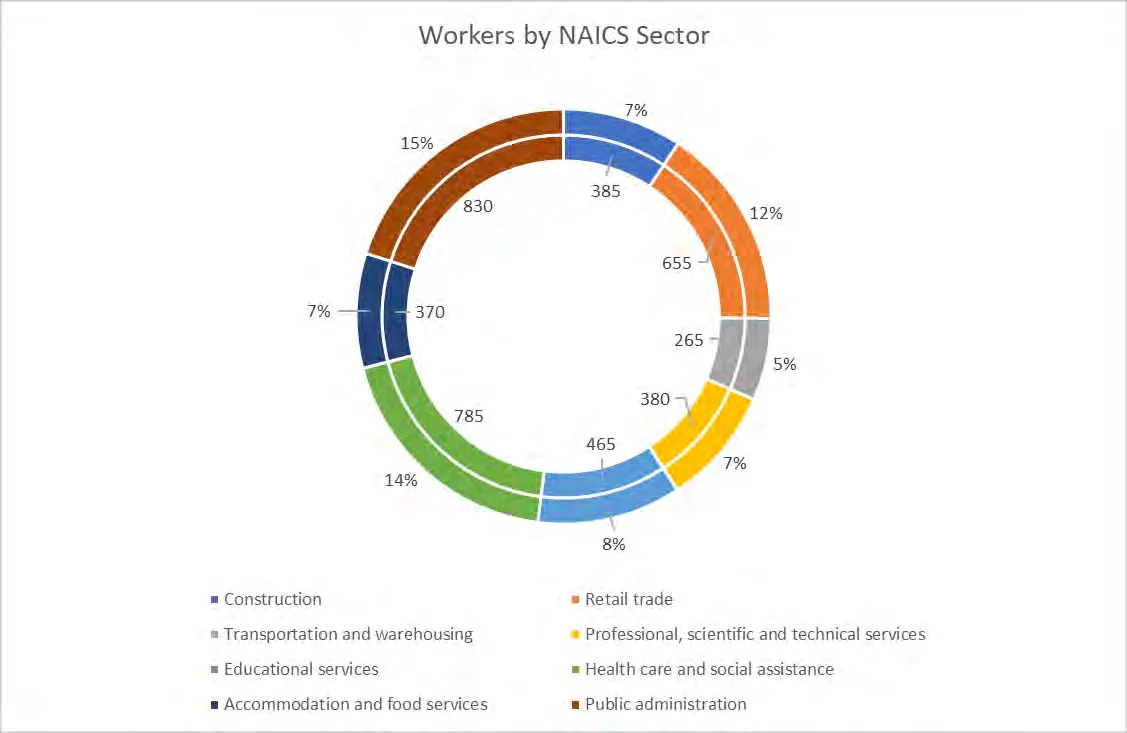
In 2016, the largest workforce category is public administration (15%) followed by health care and social assistance (14%).
3.5 Economic Indicators
In 2016, View Royal's unemployment rate was 3.8% compared to 5.6% for the CRD.
3.6 Workforce Commuting
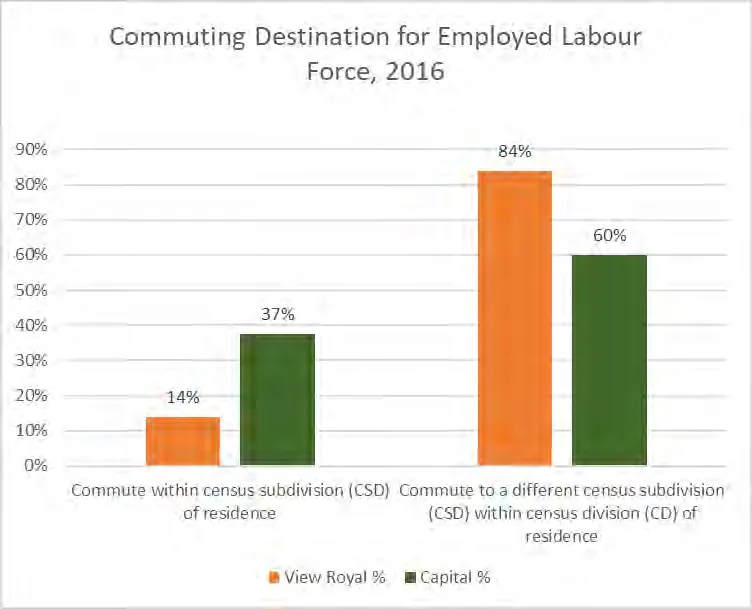
84% of View Royal's labour force commutes to a different census subdivision (municipality) within the region.
4 Housing Profile
4.1 Dwellings Types in View Royal
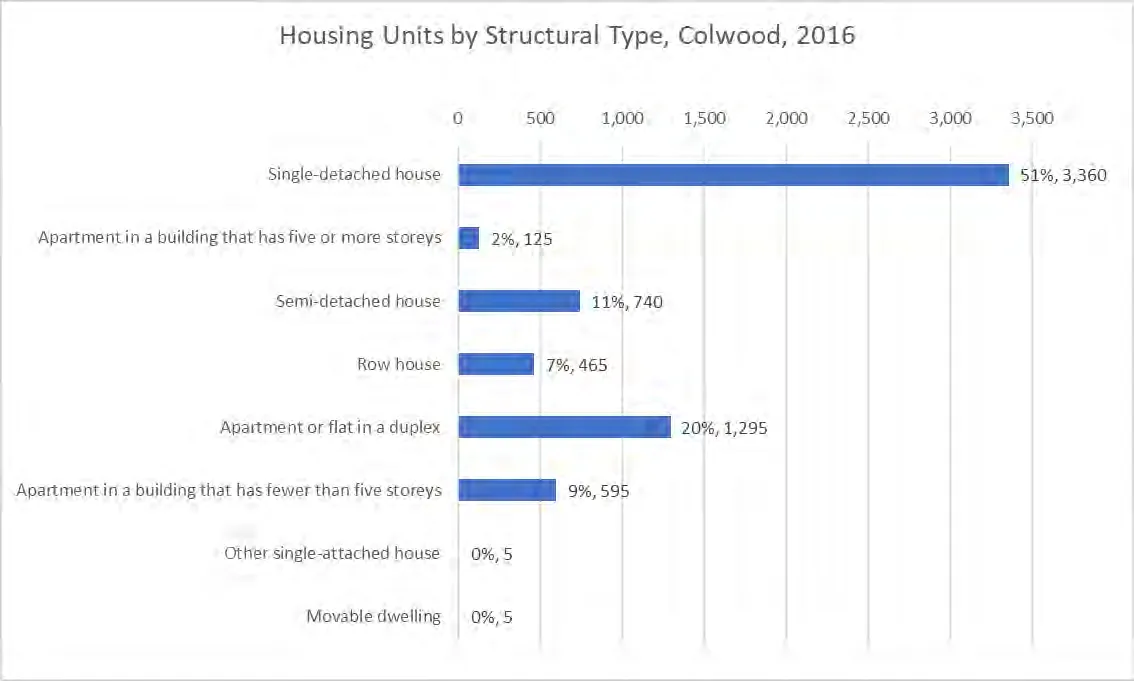
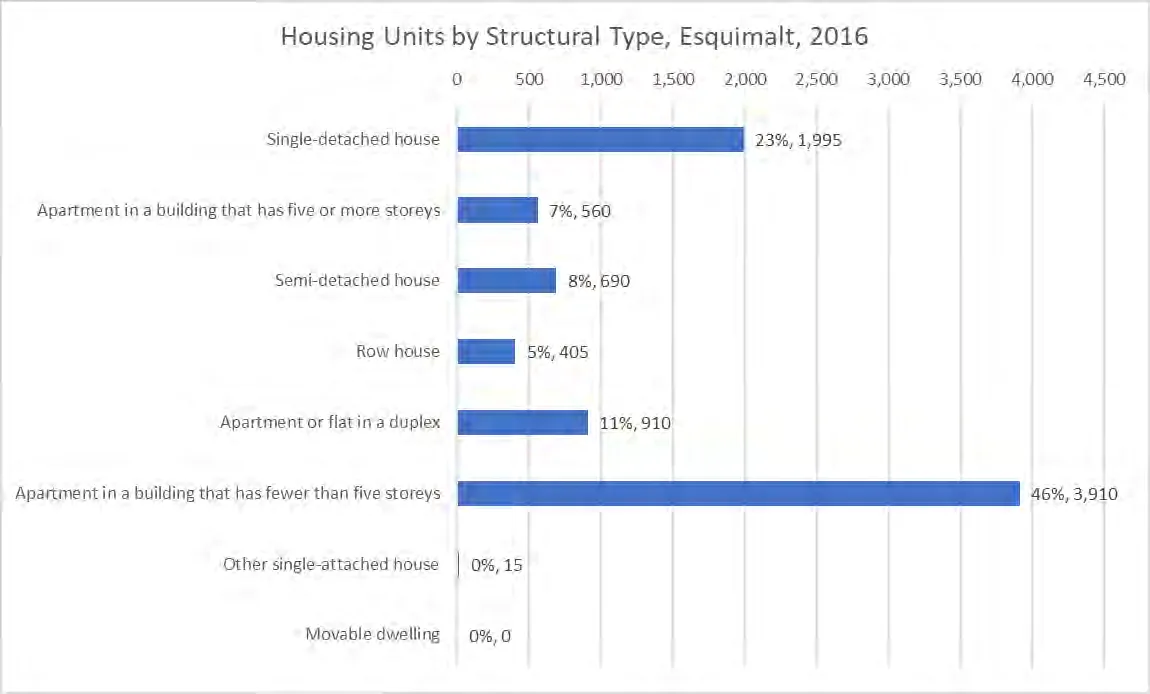
The largest single structural type is single-detached homes (40%), followed by apartments or flats in a duplex (21%).
Units by Bedroom Size
Over half of all dwellings (52.3%) are 3 or more bedrooms; however, only 34.9% of all households have 3 or more people.
Table 3: Dwellings by Number of Bedrooms versus Private Households by Household Size, 2016
| # | Dwellings by Number of Bedrooms, 2016 | % | Private Households by Household Size, 2016 | % |
|---|---|---|---|---|
| 1 | 320 | 8% | 1,060 | 26% |
| 2 | 1,215 | 29% | 1,650 | 40% |
| 3 | 1,610 | 39% | 615 | 15% |
| 4 or more | 1,010 | 24% | 835 | 20% |
Age of Housing Stock
New Housing Stock
Table 4: Dwelling Units Created in View Royal, 2017-2019
| 2017 | 2018 | 2019 | ||||
|---|---|---|---|---|---|---|
| Unit Type | # | % | # | % | # | % |
| Single-Family or Secondary Suite | 50 | 24% | 44 | 19% | 24 | 32% |
| Multi-Family | 158 | 76% | 185 | 81% | 51 | 68% |
| Total (Demolitions Netted Out) | 206 | 100% | 229 | 100% | 72 | 100% |
4.2 Households by Tenure Type
4.3 Ownership Profile
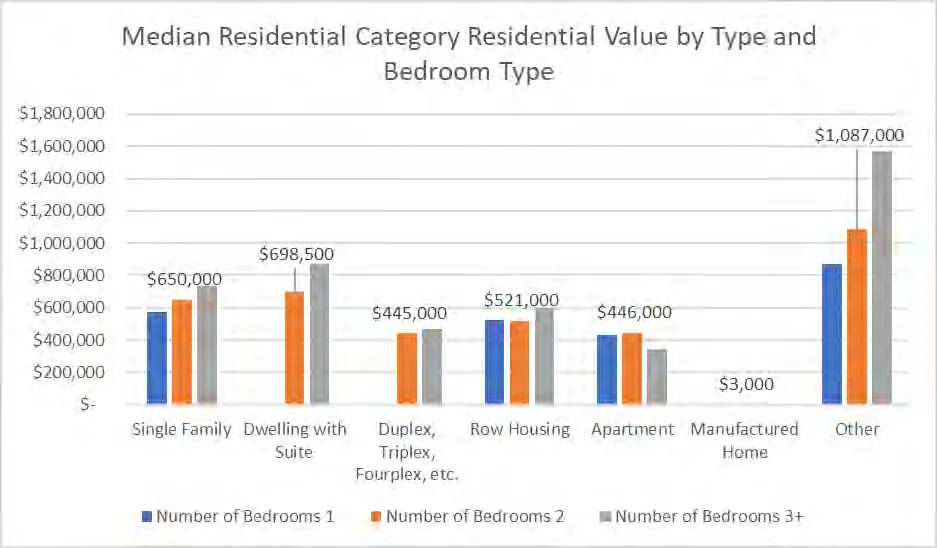
Table 5: Median Residential Category Total Conveyance Price by Type and Bedroom Type
| Number of Bedrooms | 1 | 2 | 3+ |
|---|---|---|---|
| Single Family | $ 610,000 | $ 690,000 | $ 699,900 |
| Dwelling with Suite | Insufficient data | $ 640,000 | $ 938,000 |
| Duplex, Triplex, Fourplex, etc. | Insufficient data | $ - | $ 589,800 |
| Row Housing | $ 595,000 | $ 492,000 | $ 571,333 |
| Apartment | $ 420,500 | $ 415,000 | $ - |
4.4 Rental Profile
4.5 Non-Market Housing
5 GAP ANALYSIS
5.1 Market Ownership
Table 7: Affordability of Shelter Costs by Household Type and Residential Category
| Households | Median Household income (2018) | Affordable Shelter Payments | Shelter Costs, Single-detached ($819,233) | Shelter Costs, Row House ($512,362) | Shelter Costs, Apartment ($407,700) |
|---|---|---|---|---|---|
| Couple-with children | $129,287 | $3,232 | $3,965 | $2,891 | $2,378 |
| Couple without children | $99,028 | $2,476 | $3,965 | $2,891 | $2,378 |
| Lone-parent | $64,543 | $1,614 | $3,965 | $2,891 | $2,378 |
| One-person household | $46,696 | $1,167 | $3,965 | $2,891 | $2,378 |
APPENDIX D: HOUSEHOLD PROJECTIONS
APPENDIX E: MEMO – HOUSING NEEDS BY TENURE TYPE
Date: August 11, 2020 To: Lindsay Chase, Director of Development Services From: Town of View Royal Subject: Housing Need by Tenure Type
5. Conclusion
Between 2016 and 2019 View Royal issued over 500 new building permits, which would address much of the projected growth for both market ownership and market rental. However, these units can take time to come online or impact the overall housing market. Additionally, the bulk of these units are focused at the market component of the Housing Wheelhouse: market rental and ownership. Core housing need and other data shows the need to support the development of a diversity of additional forms of housing, including affordable ownership, affordable rental, and to continue to monitor opportunities for supportive or special needs housing.
Sincerely, URBAN MATTERS CCC Matt Thomson, Community Housing Lead