TOWN OF VIEW ROYAL FINANCIAL PLAN ORIENTATION PRESENTATION
Presentation slides detailing the financial planning orientation, including legislative requirements, financial sustainability principles, and the organization of the budget package.
TOWN OF VIEW ROYAL FINANCIAL PLAN ORIENTATION
February 7, 2023
FINANCIAL PLAN ORIENTATION
Purpose
To orient Council to the Proposed 2023-2027 Financial Plan package
- Financial planning legislation
- Financial sustainability
- Budget development process
- Budget package organization

Legislation
Community Charter, S 165:
- Municipality must have a financial plan adopted annually by bylaw before the annual tax bylaw is adopted (May 15); can be amended any time
- Must cover 5 years
- Must be balanced – expenses cannot exceed revenue
- Must identify transfers for reserves and surplus
- If actual expenses exceed revenues, the deficit must be included in the next year’s financial plan as an expenditure
Financial sustainability
“Meeting the needs of the present without compromising the ability of future generations to meet their own needs.”
“a government's ability to manage its finances so it can meet its spending commitments, both now and in the future, and whether it ensures future generations of taxpayers do not face an unmanageable bill for government services provided to the current generation.”
Requires:
- Looking beyond the current year and past current electoral term
- Matching underlying nature of expenditure with source of funding
Source: https://www.gfoa.org/materials/role-of-the-finance-officer-in-supporting-fiscal-sustainability
Balanced budget
Legislation requires expenses (and transfers out) to not exceed revenue (and transfers in)

Structural balance means
Recurring revenues are equal to recurring expenditures
Revenue
| Recurring | Not recurring |
|---|---|
| Taxation | |
| User fees (garbage, sewer) | |
| Sales of services, penalties, license fees | Fines |
| Building/development permit fees? | Contributions from developers (DCCs, CAC, cash in lieu) |
| Grants? | Grants? |
| Investment income? | Investment income? |
| Casino revenue? | Casino revenue? |
| Surplus, windfalls, sale of assets |
Expenses
| Recurring | Not recurring |
|---|---|
| Labour | Elections – labour, supplies, etc. |
| Contracted or professional services | One-time projects – contracted or professional services |
| Utilities (water, sewer, power) | Acquisition of tangible capital assets |
| Supplies | Changes in levels of service? |
| Insurance, legal | Contingency |
| Debt service? | Debt issue or payout |
| Contributions to reserves? | Contributions to reserves? |
Principles
- If expense is recurring, fund from recurring revenue
Sync arrows icon - If expense is a one-time thing or infrequent, fund from non-recurring revenue
Non-recurring revenue
Non-recurring revenue sources are mapped to specific reserve and surplus accounts:
- Contributions from developers -> Statutory reserves or Multi-purpose reserves
- Sale of assets -> Capital reserves
- Casino revenue -> Reserve accounts
- CWF -> Reserve accounts
- Windfalls -> Multi-purpose reserves or Operating reserves
- Grants -> Deferred revenue
- Surplus -> Accumulated surplus
Surplus
What happens when we use surplus to reduce taxes?
Year 1 Budget
- Cost of services: $1,000
- Taxes: $1,000
- Surplus: $0
Year 1 Actual
- Cost of services: $900
- Taxes: $1,000
- Surplus: $100
Surplus
Year 2 Budget
- Cost of services: $1,020
- Taxes: $920
- Surplus (deficit): $-100
Year 2 Actual
- Cost of services: $1,020
- Taxes: $920
- Surplus (deficit): $-100
Surplus
Year 3 Budget
- Cost of services: $1,040
- Taxes: $1,040
- Surplus: $0
Year 3 Actual
- Cost of services: $1,040
- Taxes: $1,040
- Surplus: $0
Surplus
Taxpayer point of view
- Year 1: $1,000
- Year 2: $920 (8% decrease)
- Year 3: $1,040 (13% increase)
Taxes vs Actual Costs
[Chart comparing Taxes and Costs over three years, illustrating how using surplus for tax reduction causes a sharp increase in taxes in Year 3 to meet actual service costs]
Schedule and process
Staff project future costs based on best info at the time, considering:
- Market increases (inflation)
- Contractual requirements
- Growth
- Established levels of service
- Strategic plans
- Master plans
- Financial policies
- Historical experience
- Etc.
[Funnel diagram illustrating Council initiatives, Strategic and master plans, and Financial policies being synthesized into the Proposed Financial Plan]
Schedule and process
- February: Workshops
- March: Grants in aid, Online Citizen Budget
- April: Results from online engagement, Approval in principle, Tax rates
- May: Bylaws adoption, Tax notice with informational insert
Budget Workshops
- Less presentation, more conversation

Speech bubbles icon - Noted

Users with a question bubble icon - Shared with all

Email icon - Clear direction

Compass icon
Budget package organization
Distributed February 7, 2023
- Introduction
- Council initiatives
- Schedule 1 Consolidated Financial Plan
- Schedule 2 Non-core Projects
- Schedule 3 Capital Projects
- Schedule 4 Projected Reserve Balances
- Schedule 5 Service Plans Budgets
- Project Summaries
- Glossary
Consolidated Financial Plan
The financial plan is visually represented as a puzzle with the following components:
- Core

Blue puzzle piece labeled Core - Non-core

Yellow puzzle piece labeled Non-core - Ops cost of capital

Dark blue puzzle piece labeled Ops cost of capital - Capital
- Reserves
Schedule 1.1 = Schedule 1.2 + Schedule 1.3
The puzzle pieces form two main consolidated sections:
- Consolidated Operating Plan: Formed by the Core, Non-core, and Ops cost of capital pieces.
- Consolidated Capital Plan: Formed by the Capital and Reserves pieces.
Schedule 2 Non-core Projects
Schedule 2.1
Listing of proposed projects by functional division in priority order:
- In progress
- Critical
- Required
- Strategic
- Discretionary
Schedule 2.2
Same projects presented:
- By year
- By cross-ref number (N-xxx)
- Showing source(s) of funding
Schedule 3 Capital Projects
Schedule 3.1
Listing of proposed projects by functional division in priority order:
- In progress
- Critical
- Required
- Strategic
- Discretionary
Schedule 3.2
Same projects presented:
- By year
- By cross-ref number (N-xxx)
- Showing source(s) of funding
Schedule 3.3
Operational costs of capital projects
Schedule 4 Projected Reserve Balances
Listing of reserves:
- Capital reserve funds
- Operating reserve funds
- Statutory reserve funds
- Reserve accounts
- Multi-purpose reserve funds
Showing for each year:
- Contributions
- Uses
- Projected opening/closing balances
Schedule 5 Service Plans Budgets
Financial plan by functional division:
- Revenue
- Expense
- Total
For 2023, detailed columns show:
- Core (and % change)
- Non-core
- Operational costs of capital
- Total budget (and % change)
2024-2027 shows total budget and % change
Project Summary
The project summary template is annotated with the following data points:
- Cross reference number
- What? (Project Name)
- Who? (Submitted by)
- Coles notes (Executive Summary)
- Why? (Business problem and opportunity)
- What specifically? (Proposed project objectives)
- Down sides? (Business risks)
- Funding source? (Proposed sources of funding)
- When and how much $? (Costs and benefits table)
- Benefits? (Tangible and Intangible benefits)
- Recommendation (Staff Recommendation)
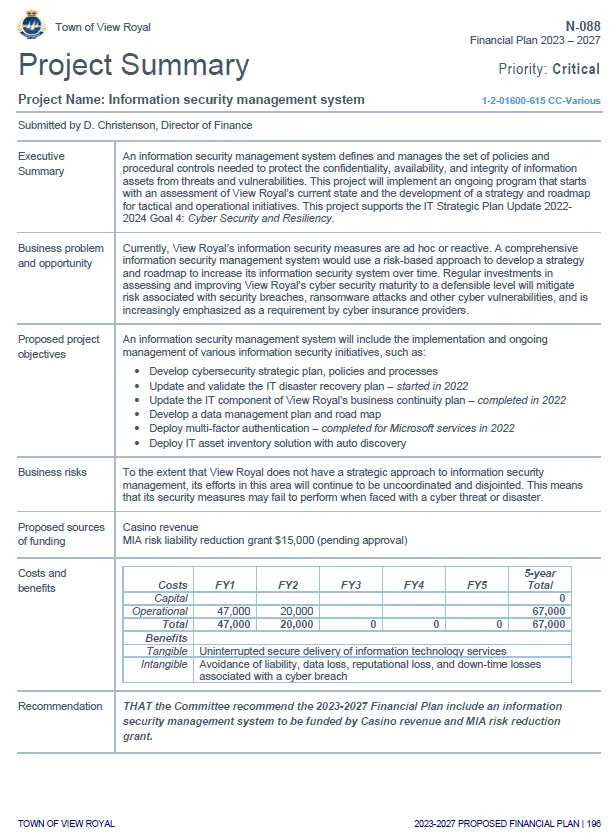
Staff Recommendation: THAT the Committee recommend the 2023-2027 Financial Plan include an information security management system to be funded by Casino revenue and MIA risk reduction grant.
Upcoming budget sessions:
- Regular Council, 7 pm, February 14, 2023
- Special Committee of the Whole, 6 pm February 15, 2023
- Special Committee of the Whole, 6 pm February 16, 2023
- Special Committee of the Whole, 6 pm February 21, 2023 IF REQUIRED