Policing Facilities Expansion Project Presentation
A slide deck presentation summarizing the background, requirements, and recommendations of the Policing Facilities Expansion Project.
Policing Facilities Expansion Project
Background
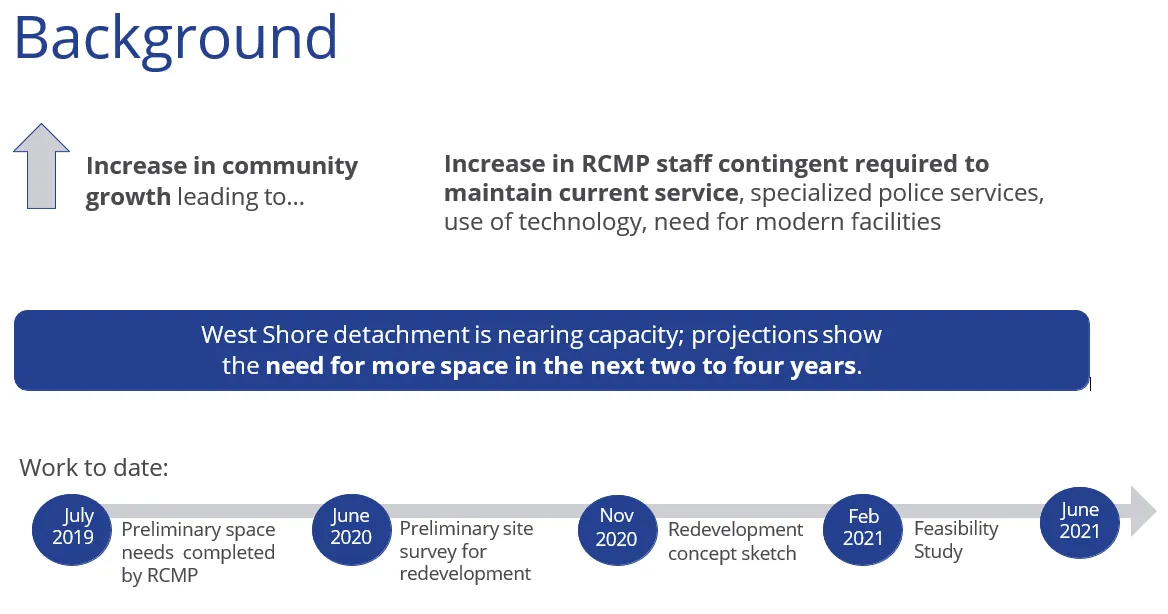
- Increase in community growth leading to...
- Increase in RCMP staff contingent required to maintain current service, specialized police services, use of technology, need for modern facilities
West Shore detachment is nearing capacity; projections show the need for more space in the next two to four years.
Work to date:
- July 2019: Preliminary space needs completed by RCMP
- June 2020: Preliminary site survey for redevelopment
- Nov 2020: Redevelopment concept sketch
- Feb 2021: Feasibility Study
- June 2021: (End of timeline bar)
Current Site: 698 Atkins Ave
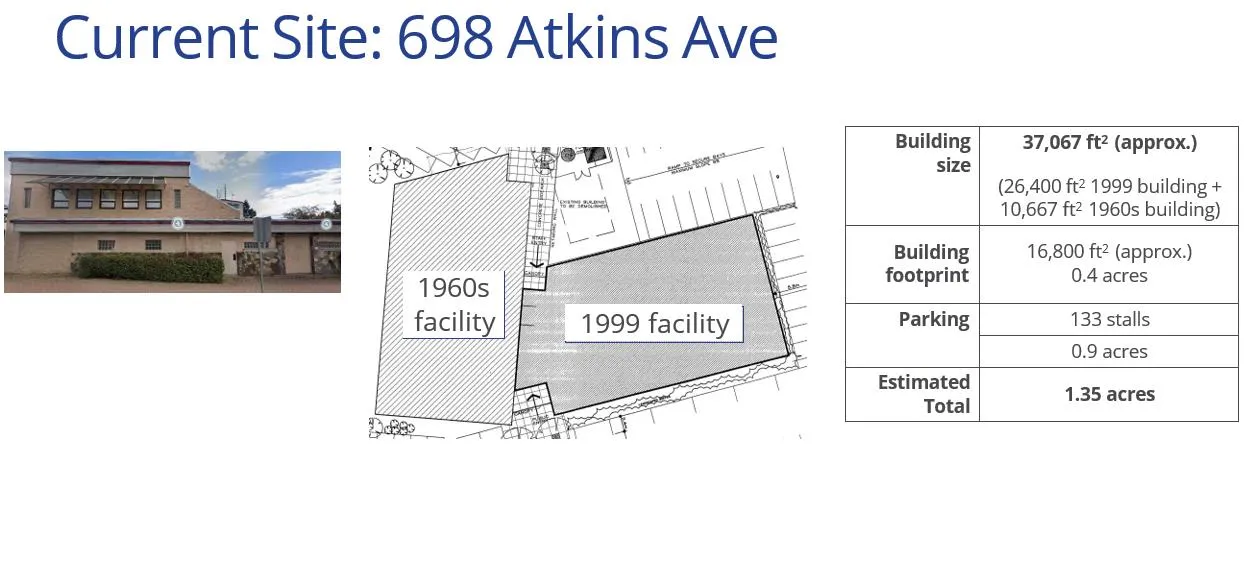
| Category | Details |
|---|---|
| Building size | 37,067 ft² (approx.) (26,400 ft² 1999 building + 10,667 ft² 1960s building) |
| Building footprint | 16,800 ft² (approx.) 0.4 acres |
| Parking | 133 stalls 0.9 acres |
| Estimated Total | 1.35 acres |
Facility Ownership & Occupancy
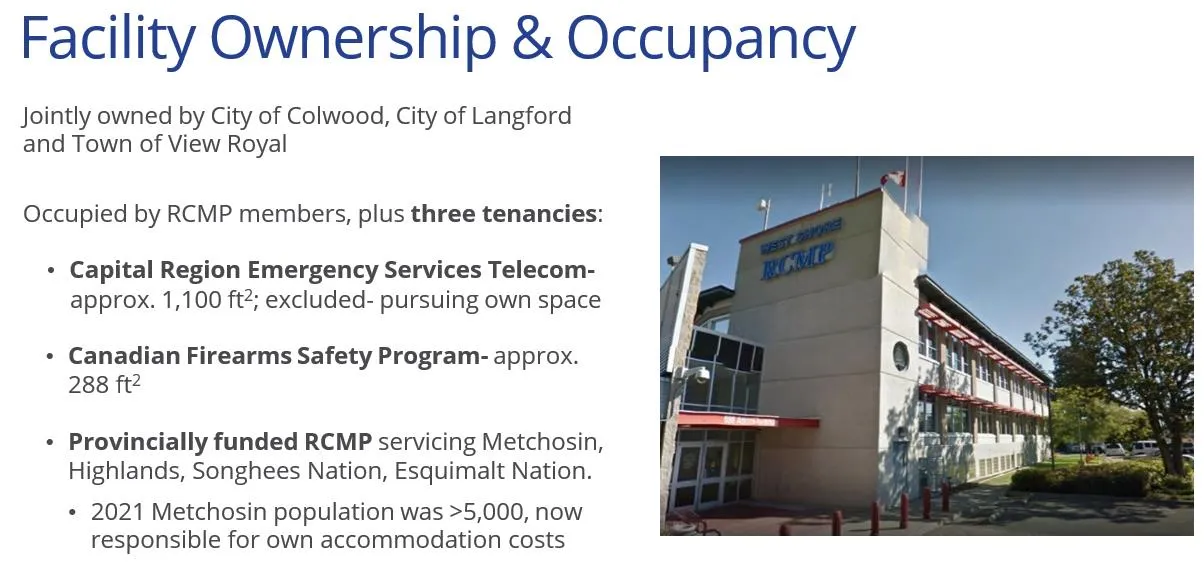
Jointly owned by City of Colwood, City of Langford and Town of View Royal
Occupied by RCMP members, plus three tenancies:
- Capital Region Emergency Services Telecom- approx. 1,100 ft²; excluded- pursuing own space
- Canadian Firearms Safety Program- approx. 288 ft²
- Provincially funded RCMP servicing Metchosin, Highlands, Songhees Nation, Esquimalt Nation.
- 2021 Metchosin population was >5,000, now responsible for own accommodation costs
Ownership Cost Sharing
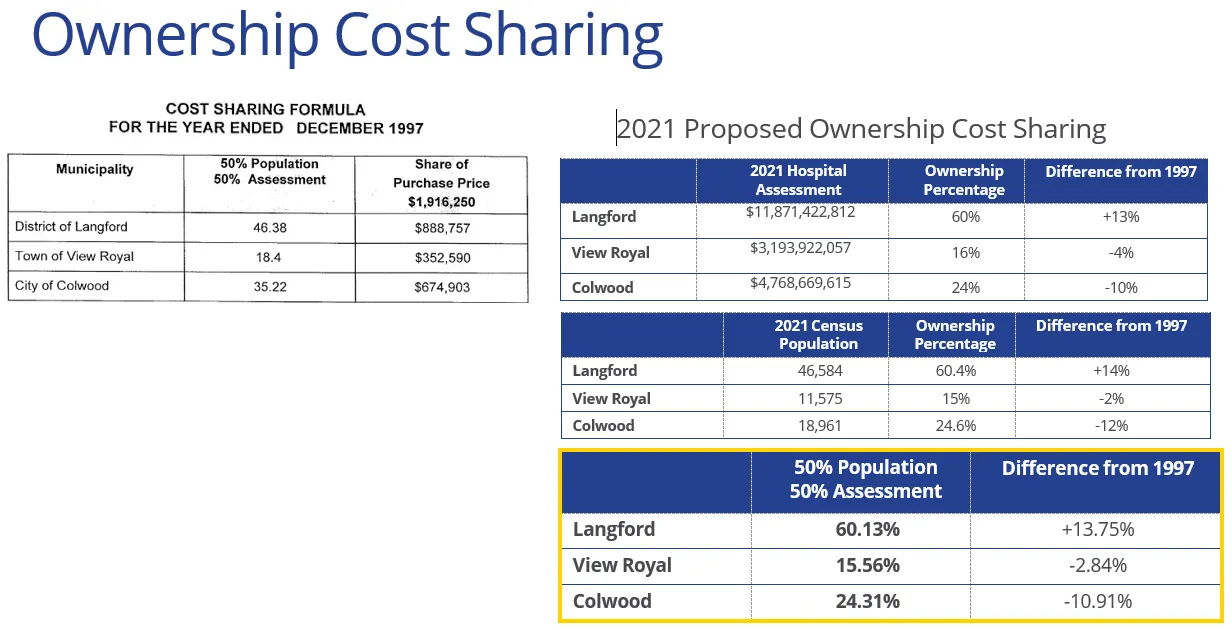
COST SHARING FORMULA FOR THE YEAR ENDED DECEMBER 1997
| Municipality | 50% Population 50% Assessment | Share of Purchase Price $1,916,250 |
|---|---|---|
| District of Langford | 46.38 | $888,757 |
| Town of View Royal | 18.4 | $352,590 |
| City of Colwood | 35.22 | $674,903 |
2021 Proposed Ownership Cost Sharing
| Municipality | 2021 Hospital Assessment | Ownership Percentage | Difference from 1997 |
|---|---|---|---|
| Langford | $11,871,422,812 | 60% | +13% |
| View Royal | $3,193,922,057 | 16% | -4% |
| Colwood | $4,768,669,615 | 24% | -10% |
| Municipality | 2021 Census Population | Ownership Percentage | Difference from 1997 |
|---|---|---|---|
| Langford | 46,584 | 60.4% | +14% |
| View Royal | 11,575 | 15% | -2% |
| Colwood | 18,961 | 24.6% | -12% |
Summary: 2021 Proposed Ownership Cost Sharing
| Municipality | 50% Population 50% Assessment | Difference from 1997 |
|---|---|---|
| Langford | 60.13% | +13.75% |
| View Royal | 15.56% | -2.84% |
| Colwood | 24.31% | -10.91% |
Future Requirements
How much space do we need?
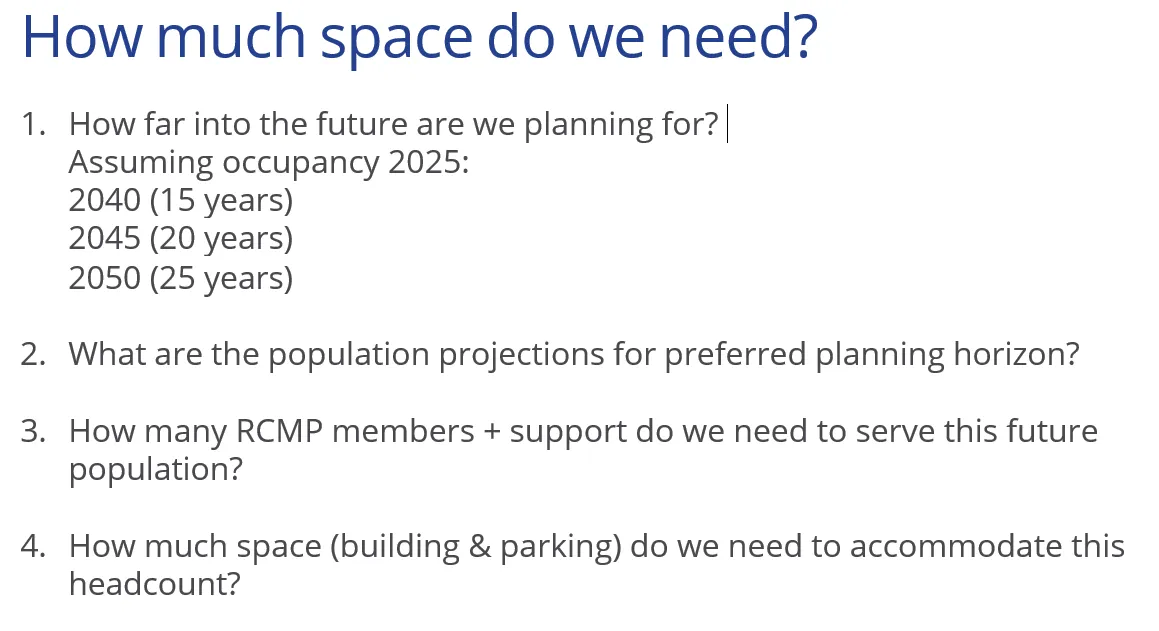
- How far into the future are we planning for? Assuming occupancy 2025: 2040 (15 years) 2045 (20 years) 2050 (25 years)
- What are the population projections for preferred planning horizon?
- How many RCMP members + support do we need to serve this future population?
- How much space (building & parking) do we need to accommodate this headcount?
How far do we plan for? 15-20-25 year population estimates
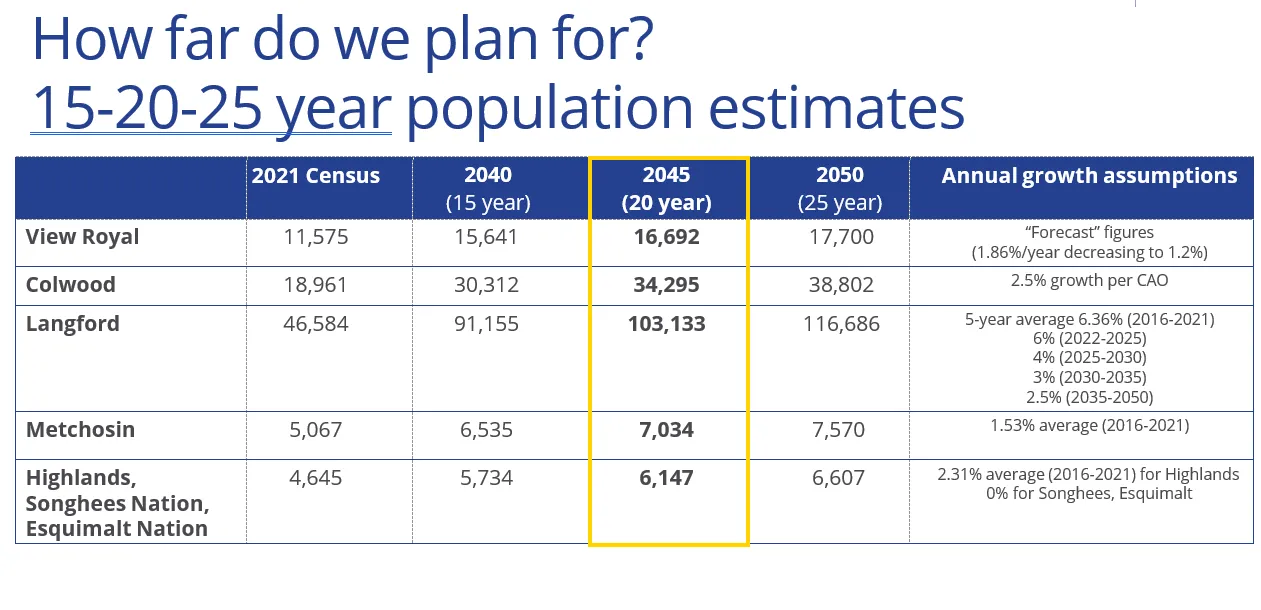
| 2021 Census | 2040 (15 year) | 2045 (20 year) | 2050 (25 year) | Annual growth assumptions | |
|---|---|---|---|---|---|
| View Royal | 11,575 | 15,641 | 16,692 | 17,700 | "Forecast" figures (1.86%/year decreasing to 1.2%) |
| Colwood | 18,961 | 30,312 | 34,295 | 38,802 | 2.5% growth per CAO |
| Langford | 46,584 | 91,155 | 103,133 | 116,686 | 5-year average 6.36% (2016-2021); 6% (2022-2025); 4% (2025-2030); 3% (2030-2035); 2.5% (2035-2050) |
| Metchosin | 5,067 | 6,535 | 7,034 | 7,570 | 1.53% average (2016-2021) |
| Highlands, Songhees Nation, Esquimalt Nation | 4,645 | 5,734 | 6,147 | 6,607 | 2.31% average (2016-2021) for Highlands; 0% for Songhees, Esquimalt |
How many RCMP to serve 2045 population?
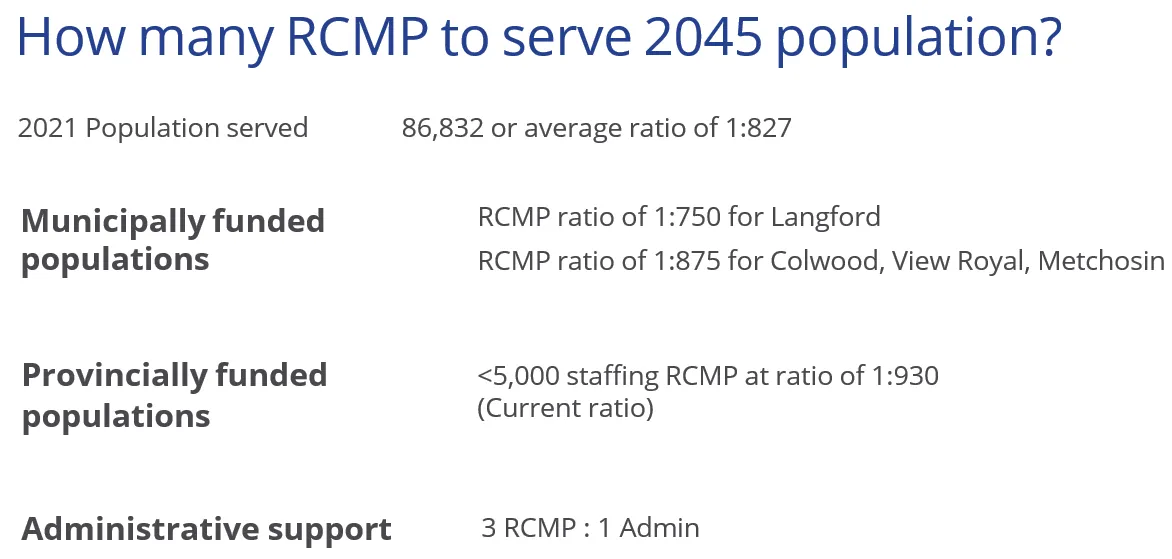
2021 Population served: 86,832 or average ratio of 1:827
- Municipally funded populations:
- RCMP ratio of 1:750 for Langford
- RCMP ratio of 1:875 for Colwood, View Royal, Metchosin
- Provincially funded populations:
- <5,000 staffing RCMP at ratio of 1:930 (Current ratio)
- Administrative support:
- 3 RCMP : 1 Admin
RCMP headcount for 20-year (2045) population
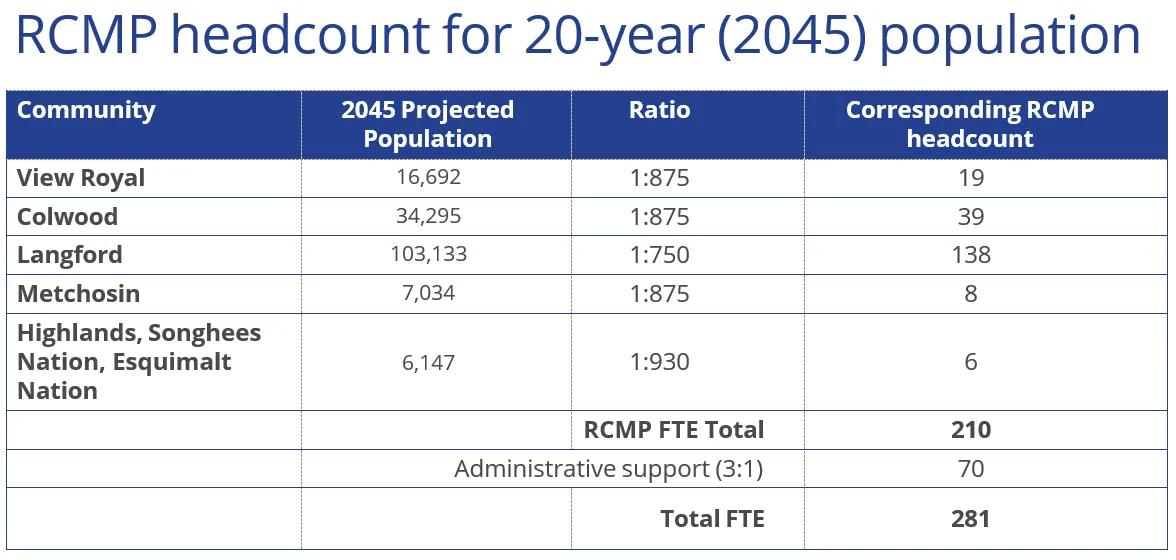
| Community | 2045 Projected Population | Ratio | Corresponding RCMP headcount |
|---|---|---|---|
| View Royal | 16,692 | 1:875 | 19 |
| Colwood | 34,295 | 1:875 | 39 |
| Langford | 103,133 | 1:750 | 138 |
| Metchosin | 7,034 | 1:875 | 8 |
| Highlands, Songhees Nation, Esquimalt Nation | 6,147 | 1:930 | 6 |
| RCMP FTE Total | 210 | ||
| Administrative support (3:1) | 70 | ||
| Total FTE | 281 |
How much space do we need to accommodate this headcount? (20-year population to 2045)
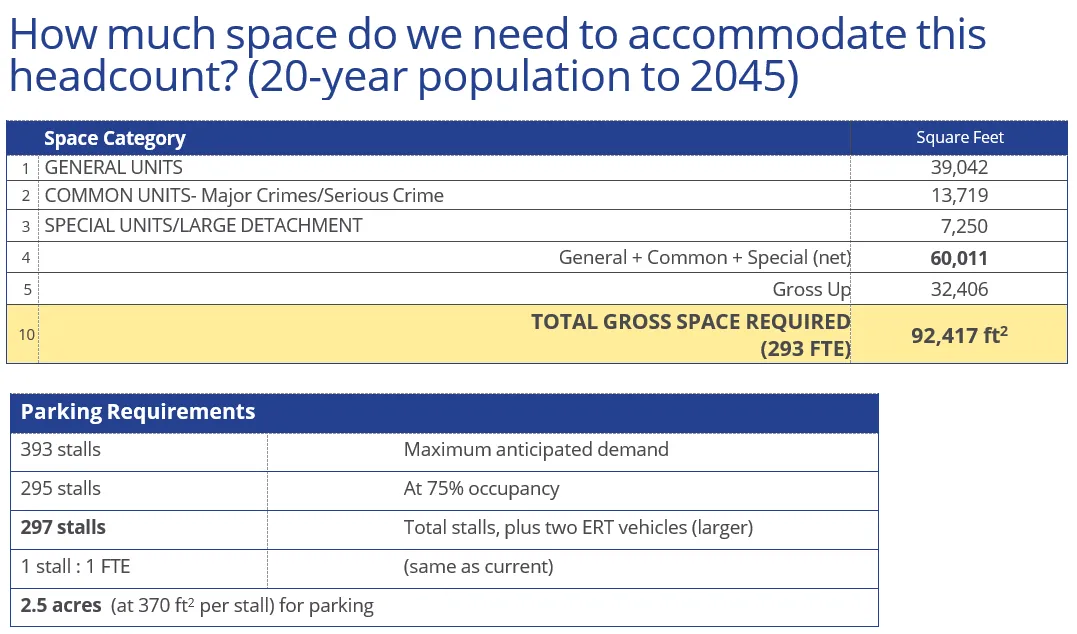
| Space Category | Square Feet | |
|---|---|---|
| 1 | GENERAL UNITS | 39,042 |
| 2 | COMMON UNITS - Major Crimes/Serious Crime | 13,719 |
| 3 | SPECIAL UNITS/LARGE DETACHMENT | 7,250 |
| 4 | General + Common + Special (net) | 60,011 |
| 5 | Gross Up | 32,406 |
| 10 | TOTAL GROSS SPACE REQUIRED (293 FTE) | 92,417 ft² |
Parking Requirements
| 393 stalls | Maximum anticipated demand |
| 295 stalls | At 75% occupancy |
| 297 stalls | Total stalls, plus two ERT vehicles (larger) |
| 1 stall : 1 FTE | (same as current) |
| 2.5 acres (at 370 ft² per stall) for parking |
Benchmarking future space requirements
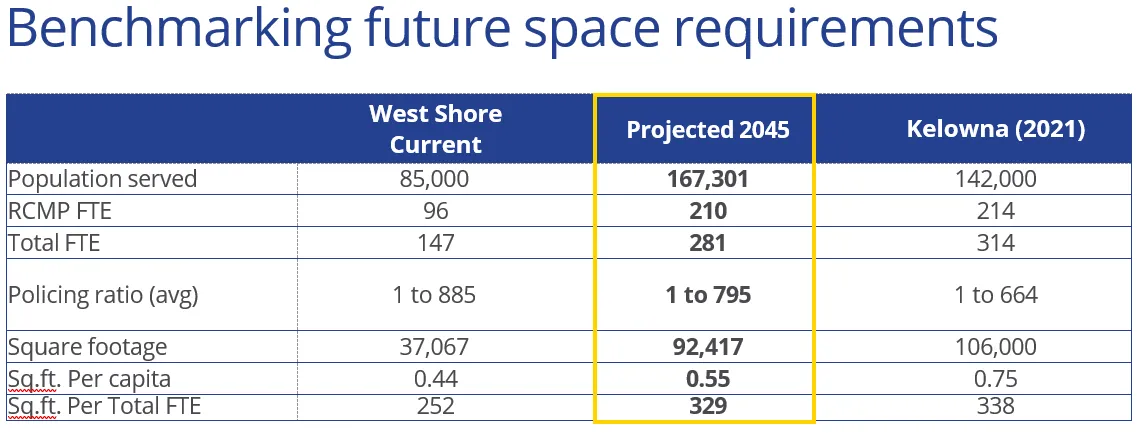
| West Shore Current | Projected 2045 | Kelowna (2021) | |
|---|---|---|---|
| Population served | 85,000 | 167,301 | 142,000 |
| RCMP FTE | 96 | 210 | 214 |
| Total FTE | 147 | 281 | 314 |
| Policing ratio (avg) | 1 to 885 | 1 to 795 | 1 to 664 |
| Square footage | 37,067 | 92,417 | 106,000 |
| Sq.ft. Per capita | 0.44 | 0.55 | 0.75 |
| Sq.ft. Per Total FTE | 252 | 329 | 338 |
Summary Future Requirements to 2045
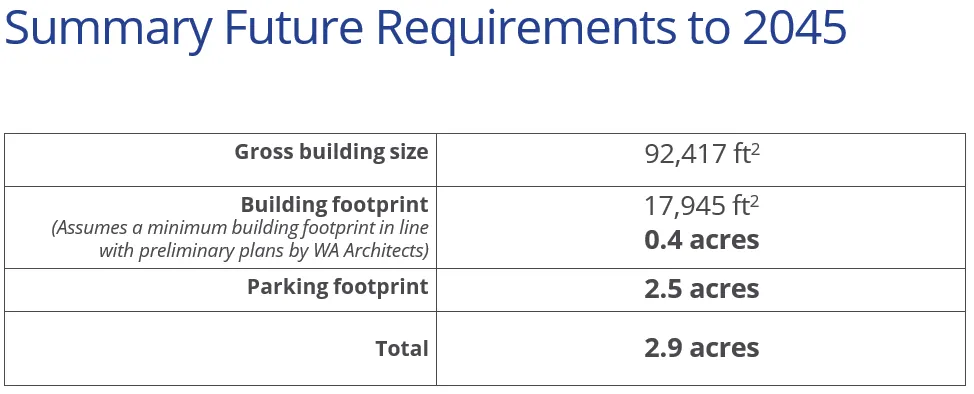
| Gross building size | 92,417 ft² |
| Building footprint (Assumes a minimum building footprint in line with preliminary plans by WA Architects) |
17,945 ft² 0.4 acres |
| Parking footprint | 2.5 acres |
| Total | 2.9 acres |
Site Options
Options to meet future requirements
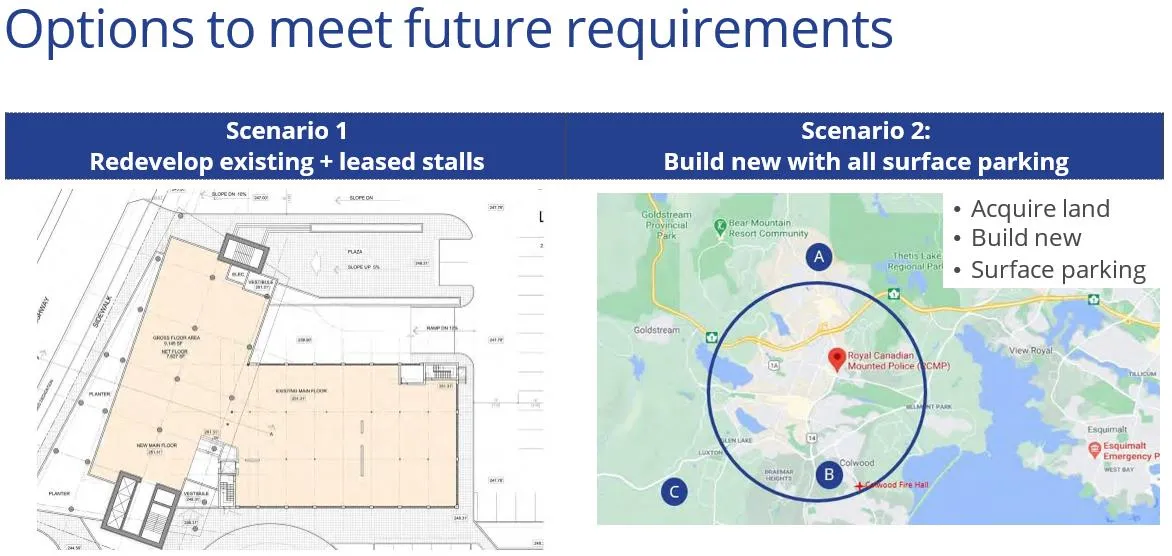
- Scenario 1: Redevelop existing + leased stalls
- Scenario 2: Build new with all surface parking
- Acquire land
- Build new
- Surface parking
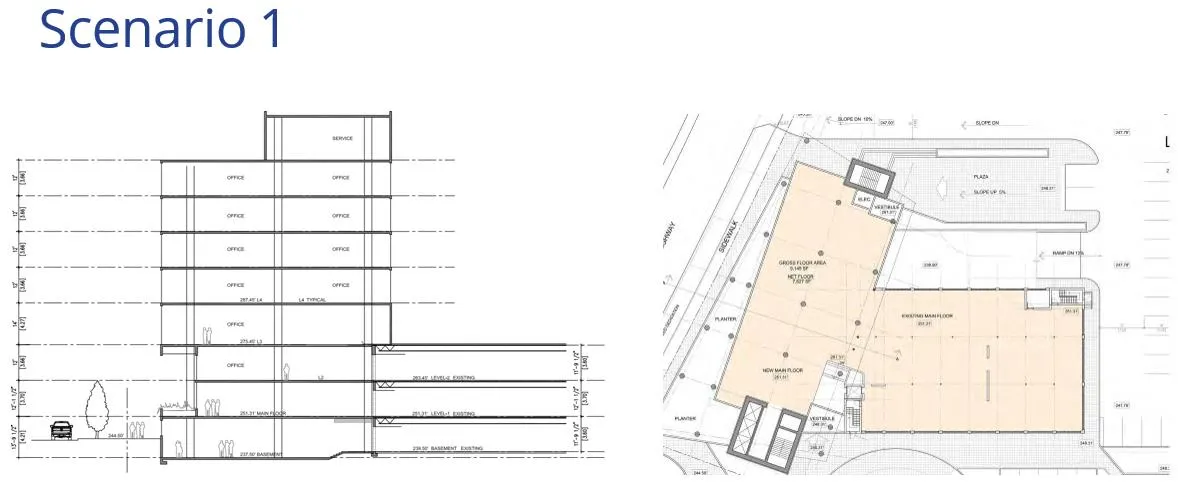
Scenario 1: Redevelop existing
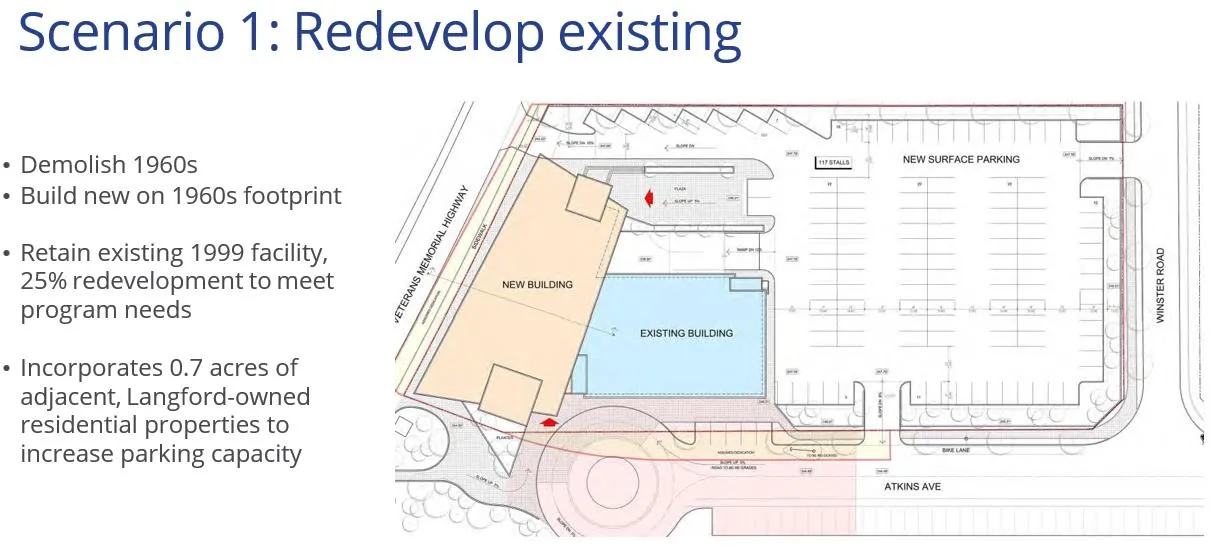
- Demolish 1960s
- Build new on 1960s footprint
- Retain existing 1999 facility, 25% redevelopment to meet program needs
- Incorporates 0.7 acres of adjacent, Langford-owned residential properties to increase parking capacity
Scenario 1: Future parking requirements
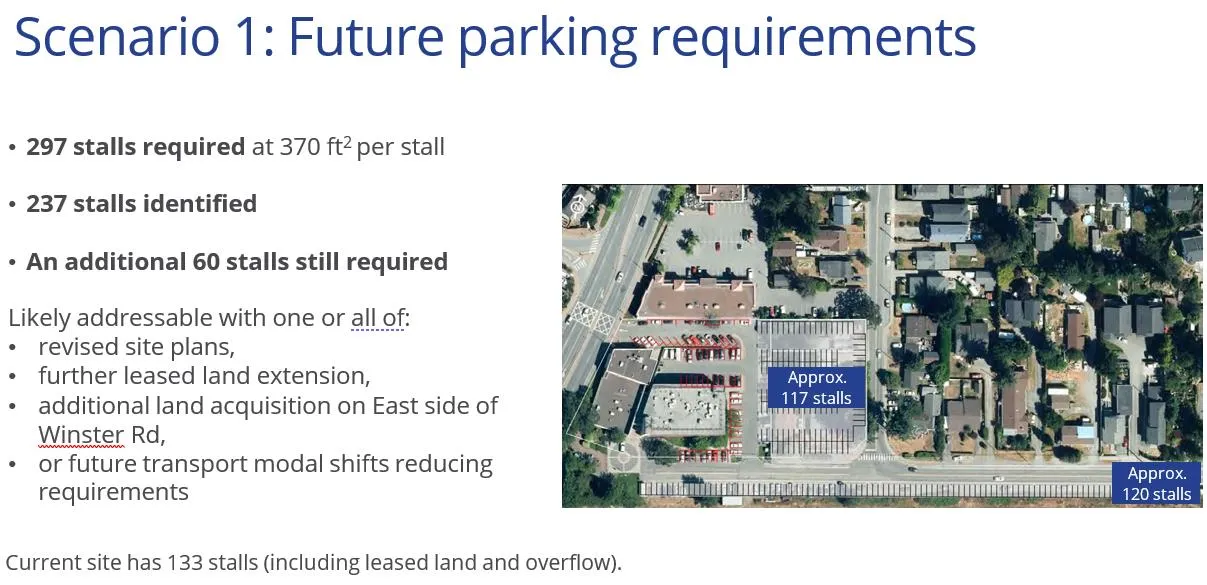
- 297 stalls required at 370 ft² per stall
- 237 stalls identified
- An additional 60 stalls still required
Likely addressable with one or all of:
- revised site plans,
- further leased land extension,
- additional land acquisition on East side of Winster Rd,
- or future transport modal shifts reducing requirements
Current site has 133 stalls (including leased land and overflow).
Scenario 2: Alternative Site Options
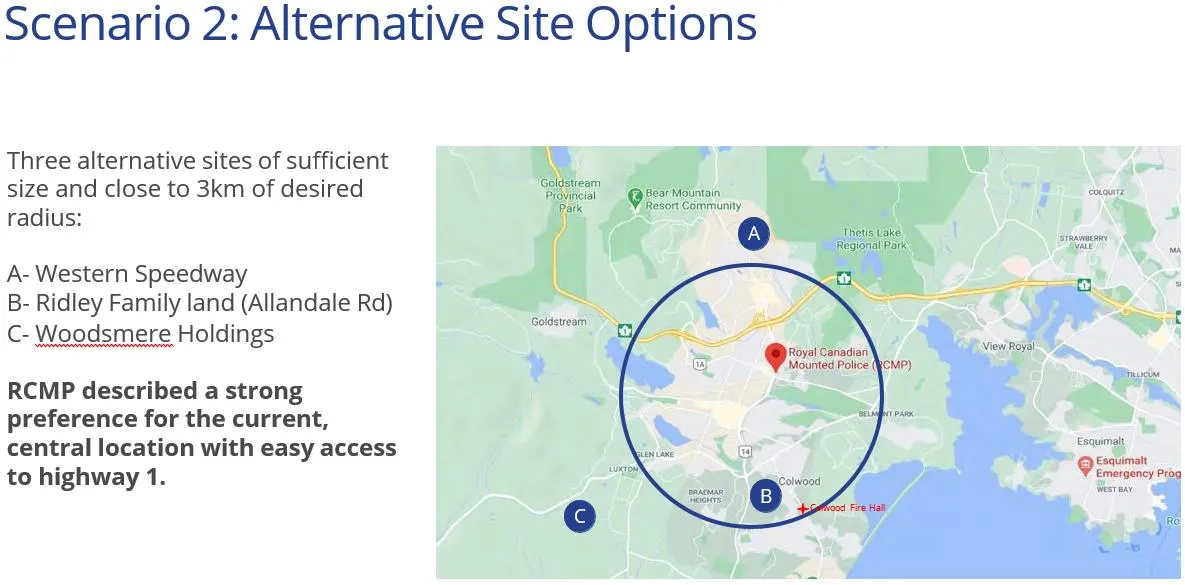
Three alternative sites of sufficient size and close to 3km of desired radius:
- A- Western Speedway
- B- Ridley Family land (Allandale Rd)
- C- Woodsmere Holdings
RCMP described a strong preference for the current, central location with easy access to highway 1.
Options Evaluation
Capital Costs
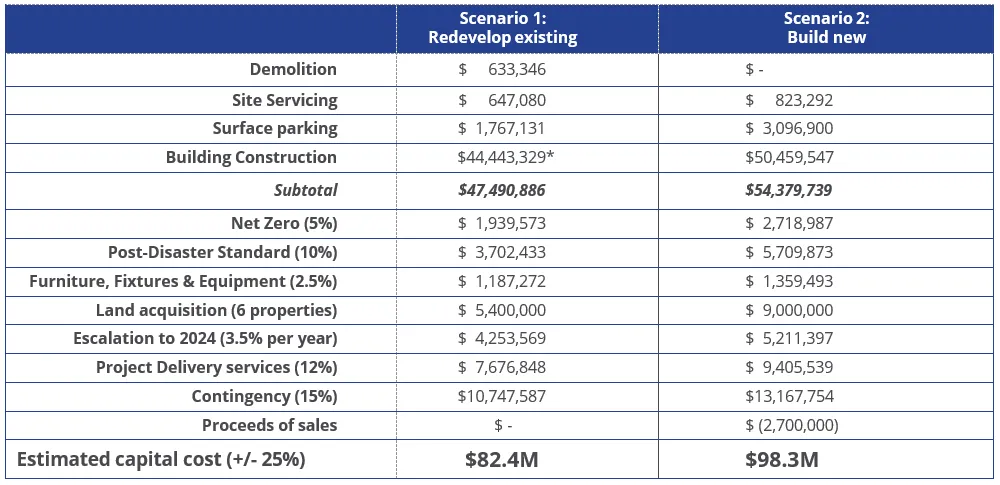
Estimated capital costs: building to 2045
| Category | Scenario 1: Redevelop existing | Scenario 2: Build new |
|---|---|---|
| Demolition | $ 633,346 | $ - |
| Site Servicing | $ 647,080 | $ 823,292 |
| Surface parking | $ 1,767,131 | $ 3,096,900 |
| Building Construction | $44,443,329* | $50,459,547 |
| Subtotal | $47,490,886 | $54,379,739 |
| Net Zero (5%) | $ 1,939,573 | $ 2,718,987 |
| Post-Disaster Standard (10%) | $ 3,702,433 | $ 5,709,873 |
| Furniture, Fixtures & Equipment (2.5%) | $ 1,187,272 | $ 1,359,493 |
| Land acquisition (6 properties) | $ 5,400,000 | $ 9,000,000 |
| Escalation to 2024 (3.5% per year) | $ 4,253,569 | $ 5,211,397 |
| Project Delivery services (12%) | $ 7,676,848 | $ 9,405,539 |
| Contingency (15%) | $10,747,587 | $13,167,754 |
| Proceeds of sales | $ - | $ (2,700,000) |
| Estimated capital cost (+/- 25%) | $82.4M | $98.3M |
*includes $6M in seismic upgrading costs added to the 1999 facility in Scenario 1 to enable useful life beyond 2045
Whole Life Costs
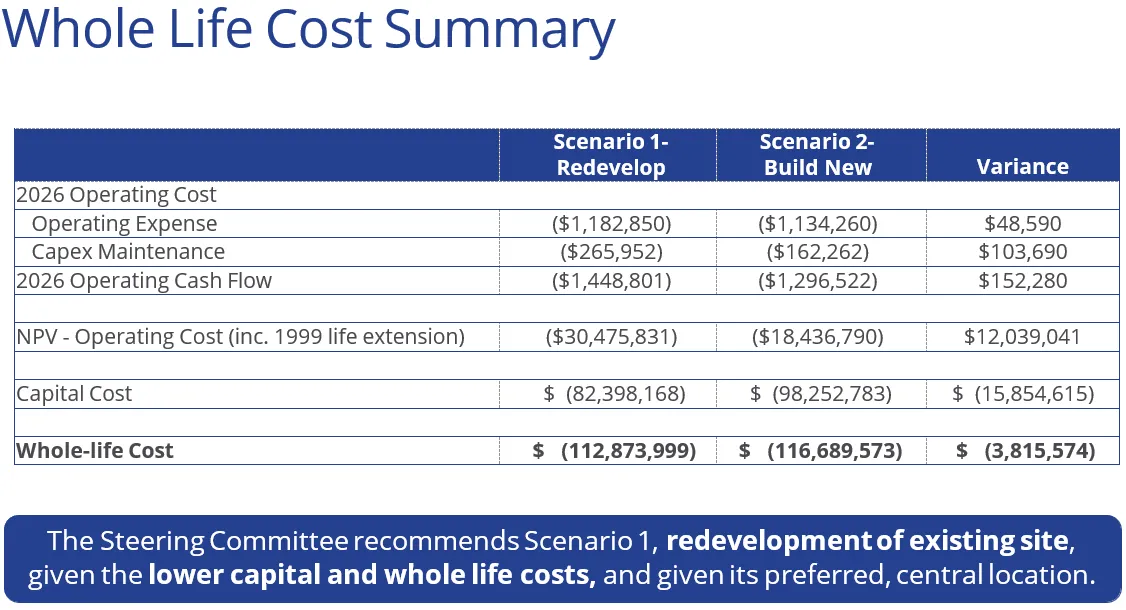
Whole Life Cost Summary
| Category | Scenario 1 - Redevelop | Scenario 2 - Build New | Variance |
|---|---|---|---|
| 2026 Operating Cost | |||
| Operating Expense | ($1,182,850) | ($1,134,260) | $48,590 |
| Capex Maintenance | ($265,952) | ($162,262) | $103,690 |
| 2026 Operating Cash Flow | ($1,448,801) | ($1,296,522) | $152,280 |
| NPV - Operating Cost (inc. 1999 life extension) | ($30,475,831) | ($18,436,790) | $12,039,041 |
| Capital Cost | $ (82,398,168) | $ (98,252,783) | $ (15,854,615) |
| Whole-life Cost | $ (112,873,999) | $ (116,689,573) | $ (3,815,574) |
Steering Committee Recommendation:
The Steering Committee recommends Scenario 1, redevelopment of existing site, given the lower capital and whole life costs, and given its preferred, central location.
Do we build 15, 20, or 25 year requirements?
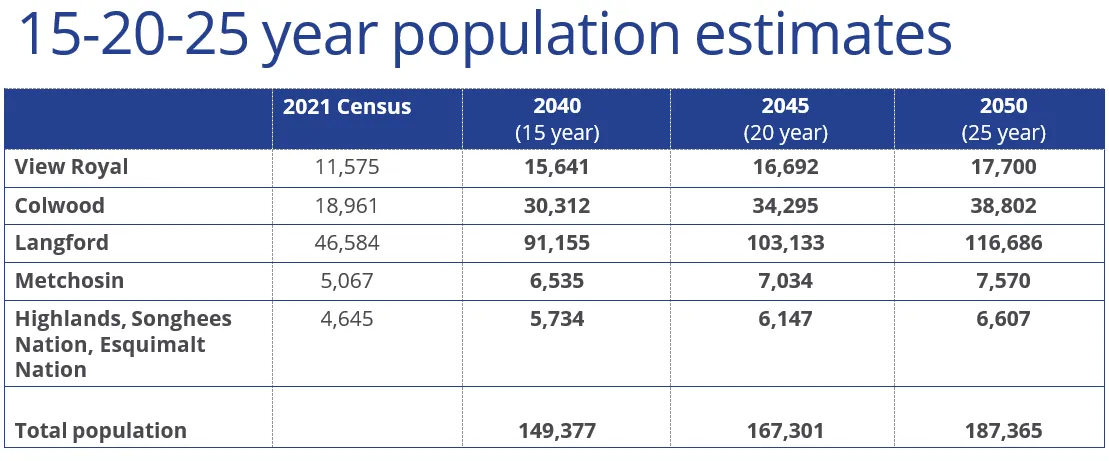
15-20-25 year population estimates
| 2021 Census | 2040 (15 year) | 2045 (20 year) | 2050 (25 year) | |
|---|---|---|---|---|
| View Royal | 11,575 | 15,641 | 16,692 | 17,700 |
| Colwood | 18,961 | 30,312 | 34,295 | 38,802 |
| Langford | 46,584 | 91,155 | 103,133 | 116,686 |
| Metchosin | 5,067 | 6,535 | 7,034 | 7,570 |
| Highlands, Songhees Nation, Esquimalt Nation | 4,645 | 5,734 | 6,147 | 6,607 |
| Total population | 149,377 | 167,301 | 187,365 |
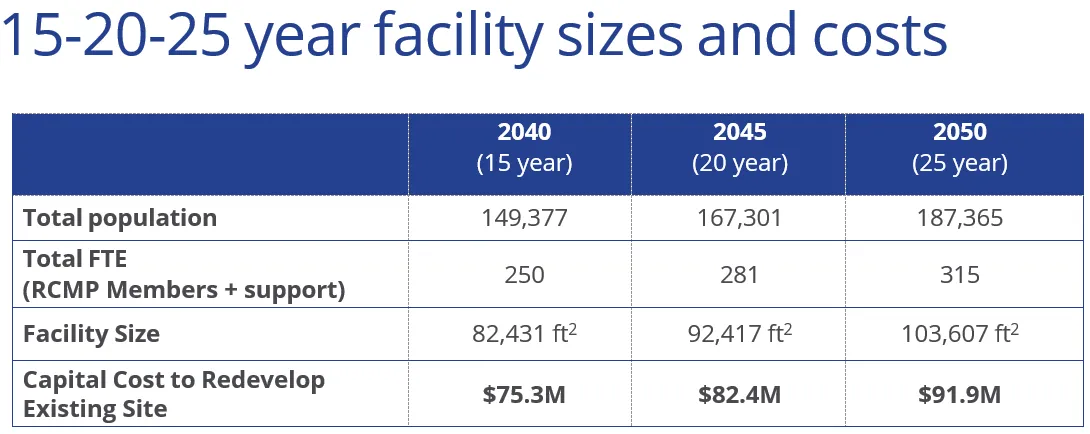
15-20-25 year facility sizes and costs
| 2040 (15 year) | 2045 (20 year) | 2050 (25 year) | |
|---|---|---|---|
| Total population | 149,377 | 167,301 | 187,365 |
| Total FTE (RCMP Members + support) | 250 | 281 | 315 |
| Facility Size | 82,431 ft² | 92,417 ft² | 103,607 ft² |
| Capital Cost to Redevelop Existing Site | $75.3M | $82.4M | $91.9M |
Why build to 2045?
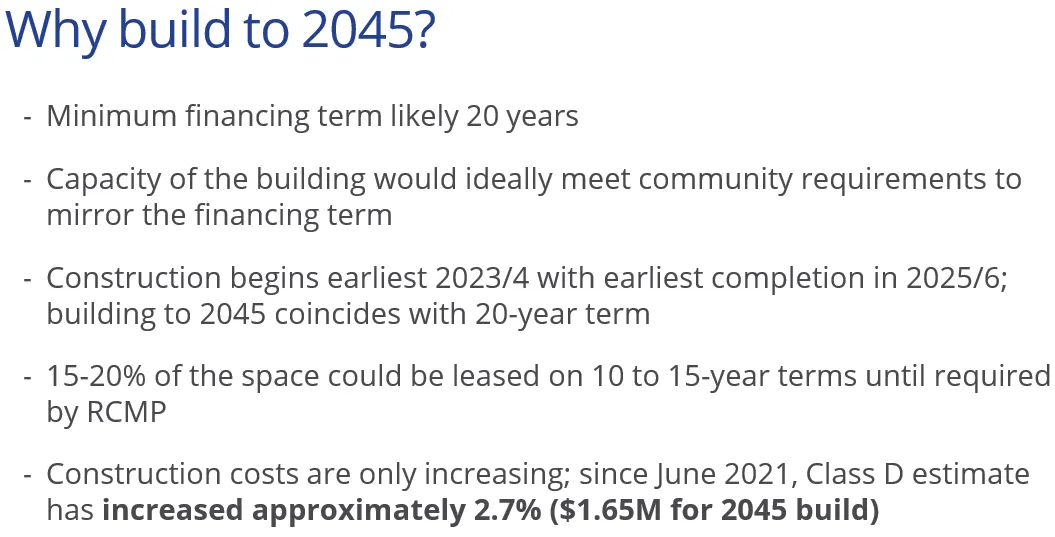
- Minimum financing term likely 20 years
- Capacity of the building would ideally meet community requirements to mirror the financing term
- Construction begins earliest 2023/4 with earliest completion in 2025/6; building to 2045 coincides with 20-year term
- 15-20% of the space could be leased on 10 to 15-year terms until required by RCMP
- Construction costs are only increasing; since June 2021, Class D estimate has increased approximately 2.7% ($1.65M for 2045 build)
Recommendations
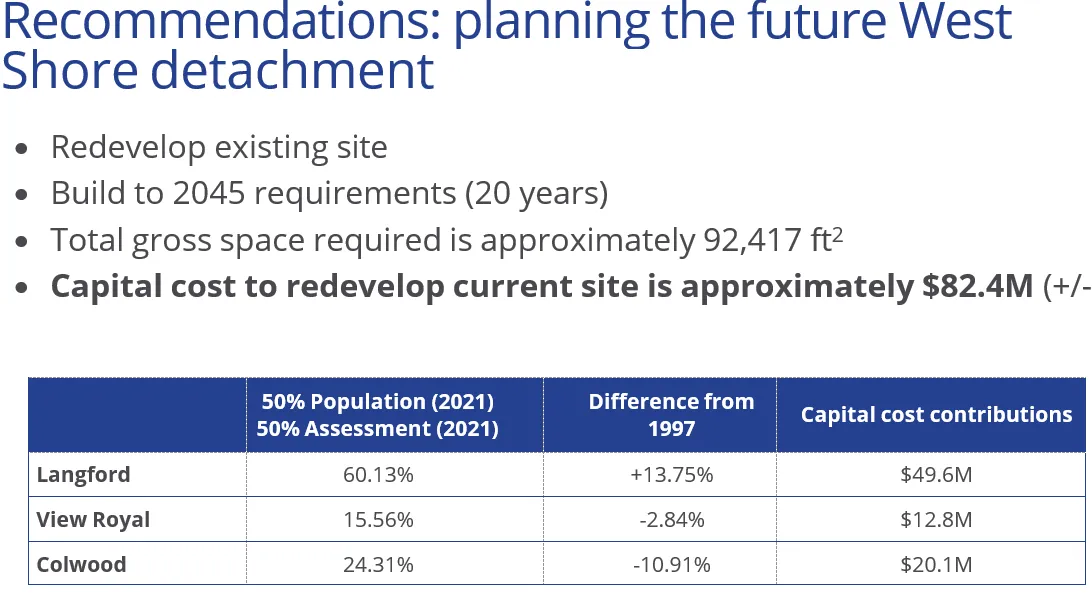
Recommendations: planning the future West Shore detachment
- Redevelop existing site
- Build to 2045 requirements (20 years)
- Total gross space required is approximately 92,417 ft²
- Capital cost to redevelop current site is approximately $82.4M (+/- 25%)
| Municipality | 50% Population (2021) 50% Assessment (2021) | Difference from 1997 | Capital cost contributions |
|---|---|---|---|
| Langford | 60.13% | +13.75% | $49.6M |
| View Royal | 15.56% | -2.84% | $12.8M |
| Colwood | 24.31% | -10.91% | $20.1M |
Indicative Timeline & Next Steps
| Key Actions | Estimated Timing |
|---|---|
| Procure IPD Advisor (Pre-Validation Readiness Work) | By November 2022 |
| Procure IPD Team (Depends on procurement strategy) Complete Owner’s Pre-Validation Preparations | March 2023 |
| IPD Team Validation Phase Starts | April 2023 |
| Validation Report Submission (Including Owner’s Approval to Proceed) | July 2023 |
| Detailed Design & Documentation Phase Starts, followed by Construction Phase (Detailed schedule/planning to be developed by the IPD Team in Validation to align with base Target Cost) | August 2023 |
| Construction Substantial Completion (Estimated 24 months following Validation Report approval) | August 2025 |
| RCMP Moved in and Operationally Ready | Q4 2025 |