Memo—Christie Point TIA Review Response – Bunt & Associates
A response memo addressing 10 specific items raised during the TIA review, including updated cost estimates for road improvements.
MEMO
DATE: April 11, 2017 PROJECT NO: 6143.01 PROJECT: Christie Point SUBJECT: TIA Review Response TO: Deb Becelaere, Town of View Royal PREPARED BY: Jason Potter, Bunt & Associates
Bunt & Associates submitted a draft Transportation Impact Assessment (TIA) report dated September 27, 2016 for the proposed 473 unit rental residential development at Christie Point in View Royal BC. The Draft TIA was reviewed by Opus and Town of View Royal staff. The review and subsequent meeting with Town staff identified 10 specific items for further review. Each item is presented below along with Bunt responses.
Table 1: Issues and Reponses
| ISSUE | RESPONSE |
|---|---|
| 1) Review impact of higher trip rates. Bunt used observed trips rates at the existing Christie Point development. | The existing PM peak hour trip rate was observed to be 0.28 two way trips per peak hour, resulting in an estimated 132 trips per PM peak hour. Exhibit 1 shows the 2018 anticipated opening day operations with the observed 0.28 trips per peak hour rate. Applying the suggested ITE trip rate which is nearly double in magnitude at 0.52 trips per unit results in anticipated operations as presented in Exhibit 2. As shown in Exhibits 1 and 2 the same key operational issues are present regardless of the applied trip rate, they are exacerbated slightly but no new issues requiring mitigation are encountered. It is noted that ITE rates are typically for a suburban context, to be used if no first principal data can be collected. |
Exhibit 3 illustrates the background 2028 operations. Exhibit 4 and Exhibit 5 present the Total 2028 operations again with the observed Christie Point rates and the ITE rates, respectively. Operations in Exhibits 4 and 5 are again similar, suggesting the applied Christie Point trip rate has little significance to the analysis findings.
Furthermore, comparing Exhibit 3 with Exhibits 4 and 5 indicates that the operational issues forecasted during the 2028 PM peak period are existing issues and issues that are a product of the applied background growth rate of 1.5% per year. As shown the issues are encountered regardless of the proposed Christie Point development.
Exhibit 6 illustrates the mitigated (addition of a traffic signal at Shoreline Drive plus westbound lane extension) operations with applied ITE trips rates. This Exhibit indicates that the recommended mitigation remains applicable and is still anticipated to address operational issues.
| ISSUE | RESPONSE |
|---|---|
| 2) Include AM peak period for analysis. | Bunt collected AM peak period traffic volumes on April 4, 2017. The AM peak hour volumes are presented in Exhibit 7. Exhibit 8 presents the modeled operations using the existing 2017 AM peak hour volumes. As shown the same key operational issues are present as found in the PM peak period analysis despite substantial shifts in Island Highway directional traffic. Exhibit 9 presents the 2028 background operations. Exhibit 10 presents the total (with development) 2028 scenario without mitigation. Exhibit 11 presents total 2028 mitigated scenario. Comparing the background operations in Exhibit 9 with the Total operations (Exhibit 10) again illustrates, like the PM peak period, the same key operational issues are encountered during the AM period and will be encountered regardless of the proposed Christie Point development. |
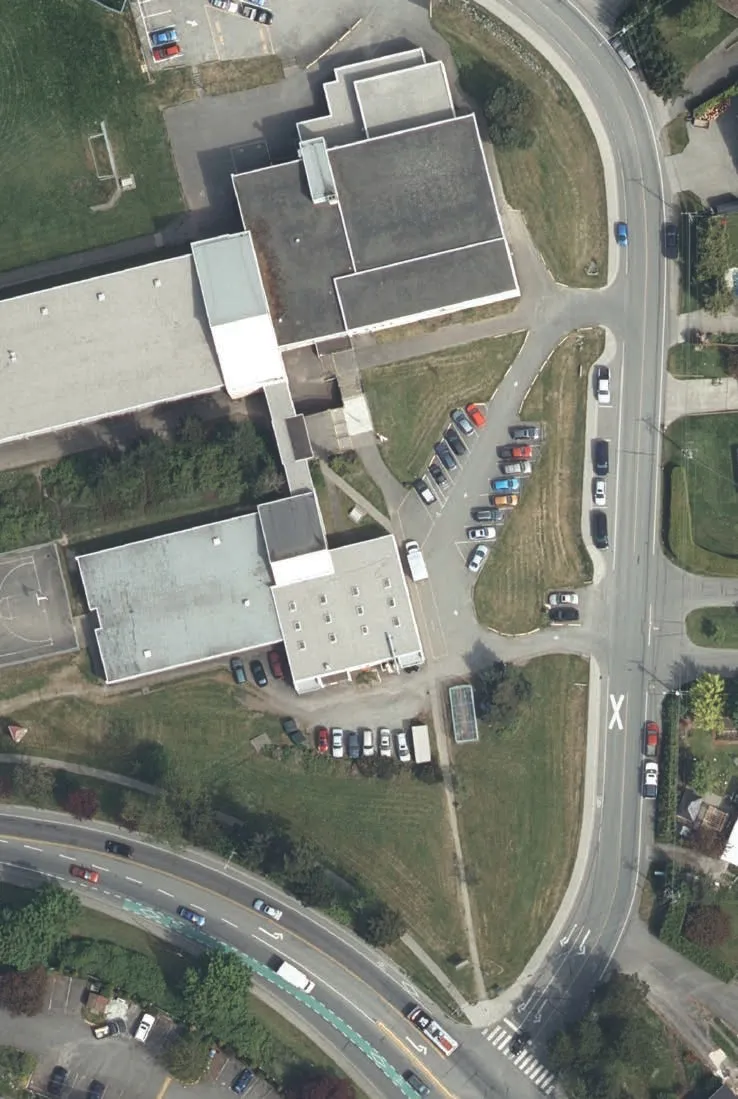
| 3) Sidewalks along Shoreline Drive. | Currently there is one sidewalk along the west edge of Shoreline Drive adjacent to Shoreline Middle School. It does not continue past the school to Christie Point. We recommend the continuation of this sidewalk to Christie Point. Adequate crossing opportunities from the west side of Shoreline Drive to the east side are available at Island Highway and will also be provided on the Christie Point site, it is therefore our opinion that a sidewalk on one side of Shoreline Drive is adequate to accommodate existing and future post-development pedestrian demand. It is also noted that a sidewalk along the west edge of Shoreline Drive would connect with the Shoreline Trail which is discussed below in Issue 4. |
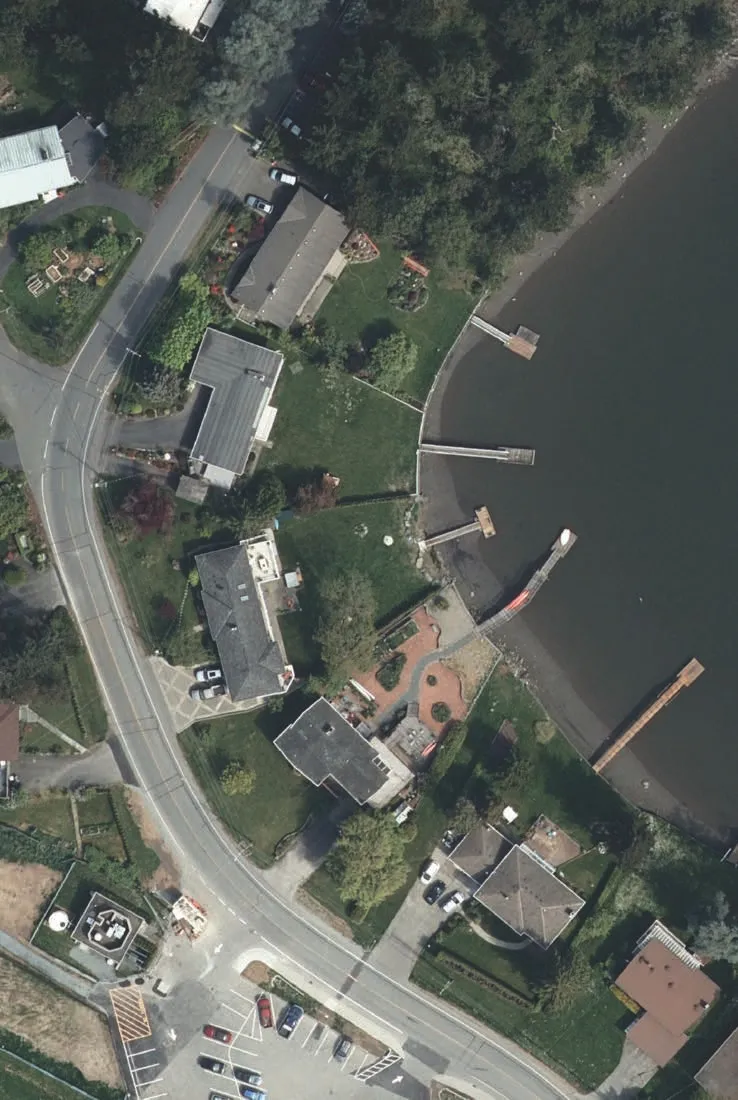
| 4) Trail (adjacent to Inlet) connection from Shoreline Drive to Island Highway | The existing trail from Shoreline Drive to Island Highway that runs along the Inlet presents a strong connection for both pedestrians and cyclists wishing to travel to or from the west and/or connect with the E&N multi-use trail. We recommend improving this trail, specifically we recommend this trail be paved and marked with a yellow painted centre line. In addition, we recommend that the trail join Island Highway similar to the alignment illustrated on Page 4 of Appendix A. |
| 5) Lighting along Shoreline Drive | There are currently three road lights located at the south end of Shoreline Drive. They are located on the east side of Shoreline Drive, opposite the school to take advantage of mounting opportunities on existing power poles. Currently mounted on every second power pole, they are spaced approximately 80m apart. As part of the development’s effort to increase Christie Point walking mode split we encourage additional lighting that would extend from Island Highway to the entry of Christie Point. Shoreline Drive lighting recommendations are based on both local road and collector road classifications from ANSI/IESNA RP-8, American National Standard Practice for Roadway Lighting. Design of Shoreline Drive lighting should be consistent with View Royal current design practises. Recommended is the continued use of existing power poles to achieve a 40 metre spacing from Shoreline Drive’s intersection with Island Highway to the Christie Point entry. There are a total of 11 power poles from Island Highway to the Christie Point entry, therefore the addition of eight lights would be required. Minimal luminescence is recommended to limit glare. Poles higher than 9.0 m shall have pole shafts and davits separated with bolted flange connections. |
| 6) Island Highway lane extension length | Bunt originally suggested a 100m westbound two lane profile extension, plus taper, on Island Highway that would extend west from the Shoreline Drive intersection. This was based on modeling that indicated that merge related spillbacks would be approximately 100m. An example video showing a micro-simulation of this arrangement is attached as a separate file due to file size constraints. We understand the two lane westbound extension aligns with 2007 plans for a 180 m lane extension that was recommended for existing operational issues independent of the Christie Point development. For cost sharing considerations it is important to emphasise that this recommended lane extension is exacerbated by the Christie Point development, however the desire for the two lane extension is a long held desire of View Royal. |
| 7) Speed Boards on Island Highway | The Town of View Royal has expressed interest in the placement of vehicle travel speed reading boards on Island Highway on both the westbound and eastbound approaches to the Shoreline Drive intersection. The purpose is to reduce vehicle speeds along Island Highway during non-peak periods. Our observations did not encounter speed issues but that was due to our observations occurring during peak periods when Island Highway encounters speed limiting congestion. It is our opinion that the speeding issue on Island Highway is independent of the Christie Point development and hence should not be the responsibility of the Christie Point development to provide. We believe the introduction of a traffic signal at the Shoreline Drive and Island Highway intersection will act as a traffic calming or speed reduction measure. We also note that Christie Point related traffic is not anticipated to speed along this area of Island Highway as they will be preparing to turn onto Shoreline Drive. |
| 8) Parking Analysis Breakdown | The exact unit mix for Christie Point is uncertain at this time. As such Bunt has prepared recommended parking rates for each type of rental unit size. Bunt previously recommended a parking rate of 1 space per unit for all unit types which is below View Royal parking bylaw rates of 1.5 spaces for row houses, townhouses and two-bedroom apartments, and 2.0 spaces per unit for 3-bedroom units. Suggested parking rates were selected based on research conducted in the Capital Regional District for rental residential buildings and is detailed greater in the TIA report’s Section 4. Bunt recommends for the Christie Point context the following parking rates: • Studio - 0.7 spaces per unit • One-bedroom – 0.8 spaces per unit • Two-bedroom – 1.1 spaces per unit • Three-bedroom – 1.5 spaces per unit, and • 0.15 spaces per unit for visitors, in addition to the above resident rates. These suggested parking rates are generally consistent with the existing parking demand of the Christie Point site which has a demand rate of approximately 1.32 spaces per unit for its current mix of two and three bedroom units. We feel this is a conservative measure as potential increases in vehicle ownership that accompany new rental units are expected to be offset by improved walking and cycling connections. The suggested visitor parking rate of 0.15 spaces per unit is higher than our typically recommended 0.1 rate due to the sensitivity of potential overflow demand on the adjacent Shoreline Drive area. These rates are anticipated to accommodate peak on-site parking demands. If the supplied parking is lower than the spaces calculated using the above recommended rates than the developer may consider parking in-lieu opportunities. If however the parking supply meets these recommended rates but falls below bylaw rate requirements then it is our view that parking in lieu should not be applied based on our understanding that parking in lieu’s purpose is to bridge the gap between anticipated supply and demand rather than a gap between supply and bylaw. |
| 9) Signal Coordination | A review of the signal timing sheets for Craigflower Road (Island Highway) and Admirals Road intersection indicates that this signal is not coordinated with intersections further west. This provides flexibility as the Craigflower Road and Admirals Road intersection can be set as the master intersection and its cycle length and splits optimized. The two traffic signals optimize (using PM peak hour volumes) at 140 second (Admirals) and 70 second (Shoreline) cycle lengths, these are however considered at the high end of preferred cycle lengths for an urban area, hence the signals were set to 120 second and 60 second cycle lengths respectively, with a minimal 18.5 second Shoreline phase which allows for a 3 second walk time, a 11 second flash don’t walk/ clearance time, 3.5 second yellow time and a one second all-red time. The accompanying micro simulation video, titled SimTraffic PM Total 2028 Mitigated (sent separately due to file size constraints) shows the future Shoreline signal coordinated with the Admirals intersection using the above settings during the PM peak hour. In this video it can be seen that the activation of Shoreline Drive’s green phase is optimized to be timed with the southbound phase of the Admirals Road and Island Highway intersection. Note that without signal activation from the Shoreline Drive approach the Island Highway approaches would continue to rest on green. The resulting Simtraffic report is provided in Appendix B. This Simtraffic analysis examined the PM peak hour period, for the purposes of specifically examining the questioned westbound queues lengths. Separate analysis at the detailed design stage should be undertaken to generate a specific AM peak period coordinated signal timing plans. |
| 10) Cost Estimates Update | Updated conceptual design cost estimates based on items discussed above as well as adjustments to quantities and unit rates is provided in Appendix C. |
Exhibit 1: Christie Point PM Total (2018) Using Observed Trip Rates Operations - No Mitigation
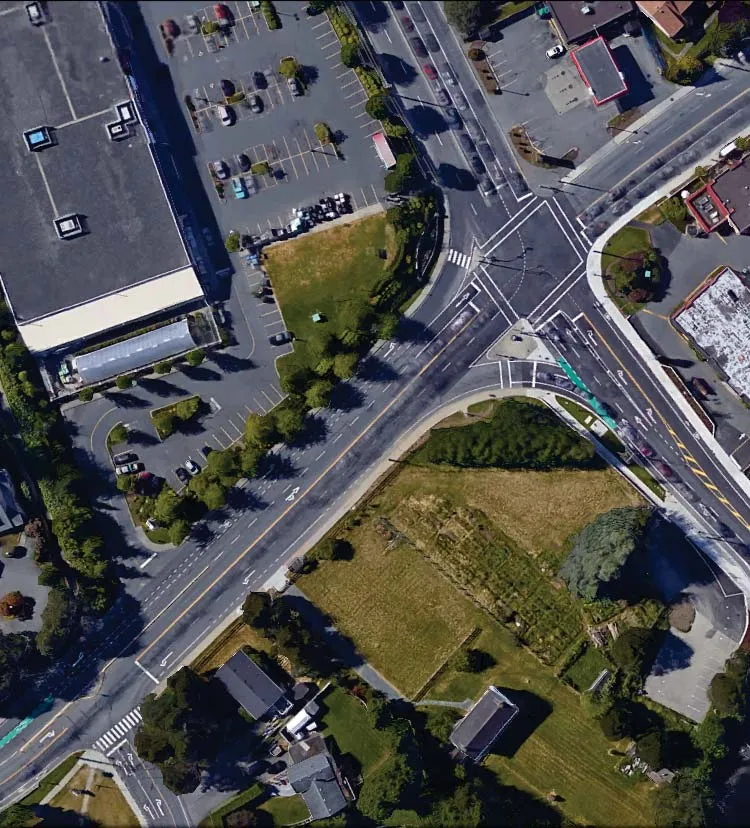
Exhibit 2: Christie Point PM Total (2018) Using ITE Trip Rates Operations - No Mitigation
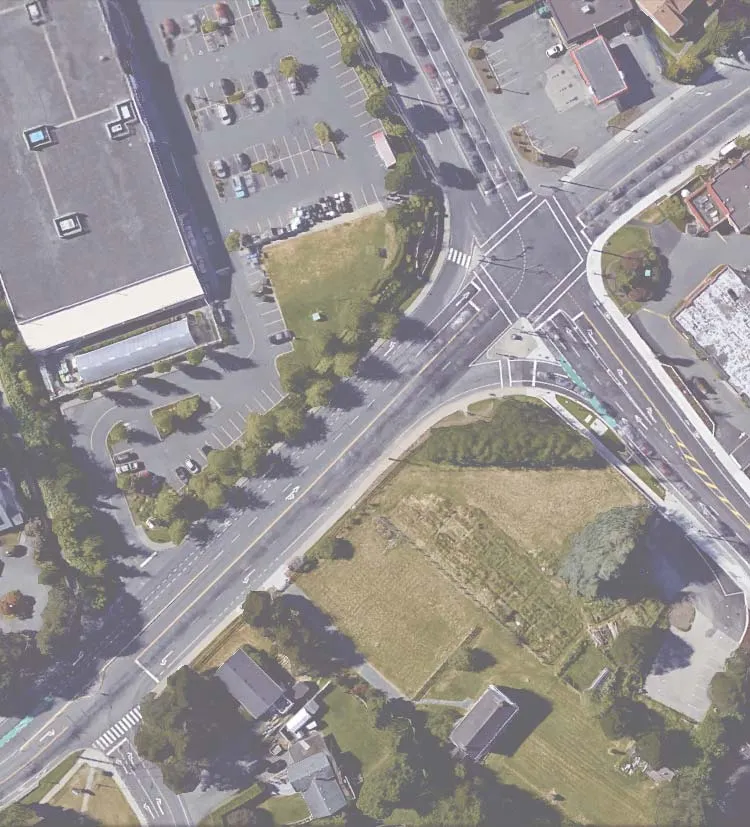
Exhibit 3: Christie Point PM Background 2028 Traffic Performance - No Mitigation
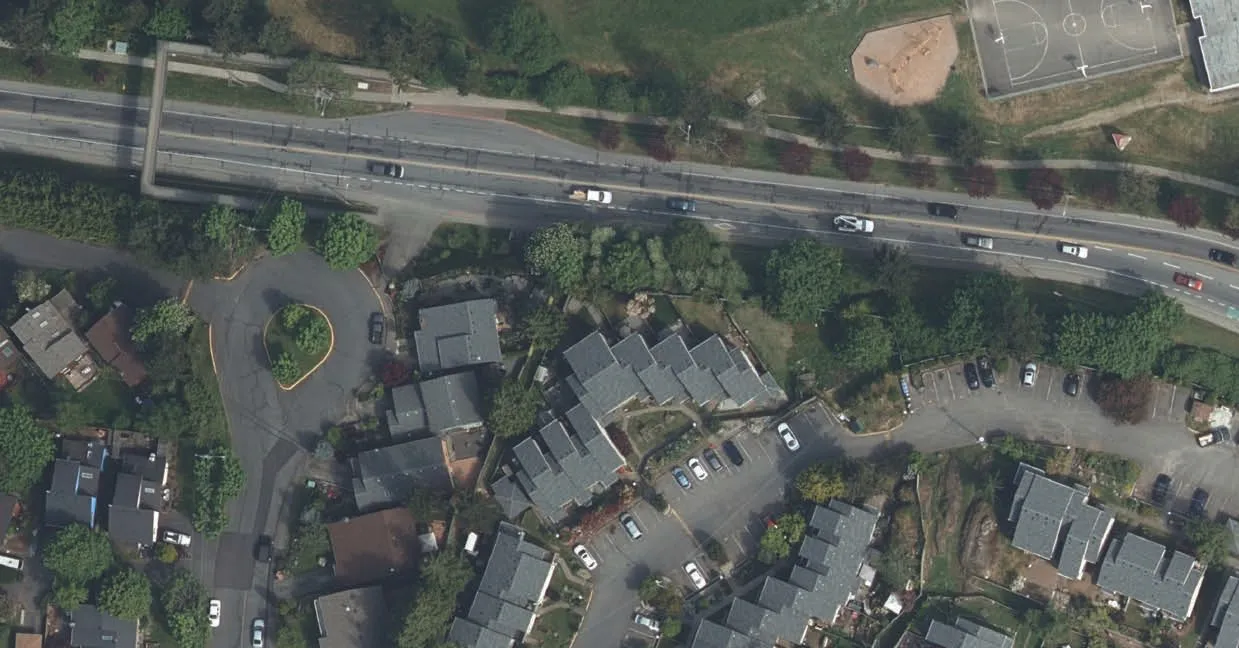
Exhibit 4: Christie Point PM Total (2028) Using Observed Trip Rates Traffic Operations - No Mitigation
Exhibit 5: Christie Point PM Total (2028) Using ITE Rates Traffic Performance - No Mitigation
Exhibit 6: Christie Point PM Total 2028 Performance - ITE Rates + Traffic Signal and Extension of Two Westbound Lanes
Exhibit 7: Christie Point AM Existing Peak Hour Volumes
Exhibit 8: Christie Point AM Existing (2017) Operations - No Mitigation
Exhibit 9: Christie Point AM Background 2028 Operations - No Mitigation
Exhibit 10: Christie Point AM Total 2028 Using ITE Rates Operations - No Mitigation
Exhibit 11: Christie Point AM Total 2028 Using ITE Rates Operations - Signal at Shoreline + WB Lane Extension
Appendix A: Conceptual Road Designs

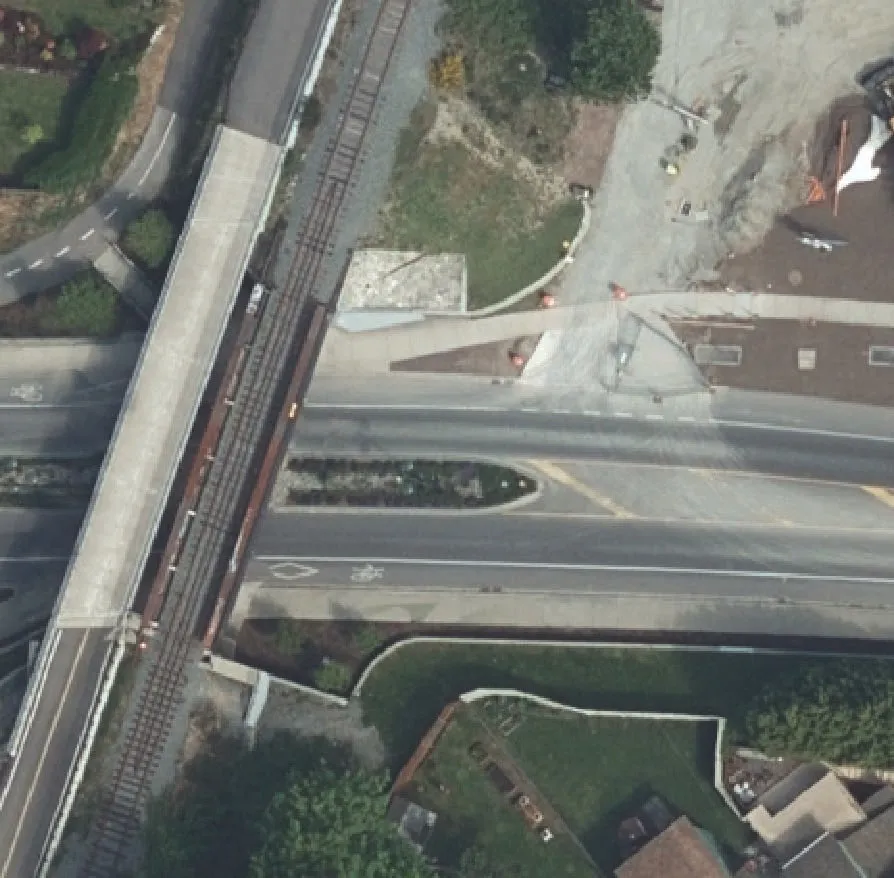
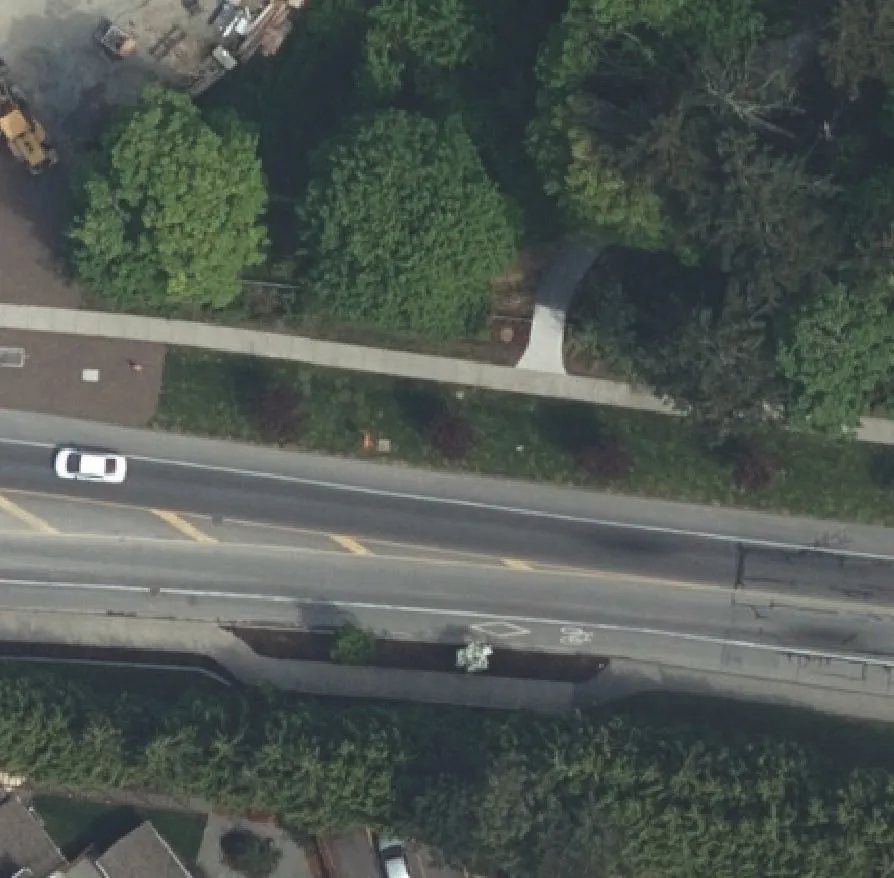
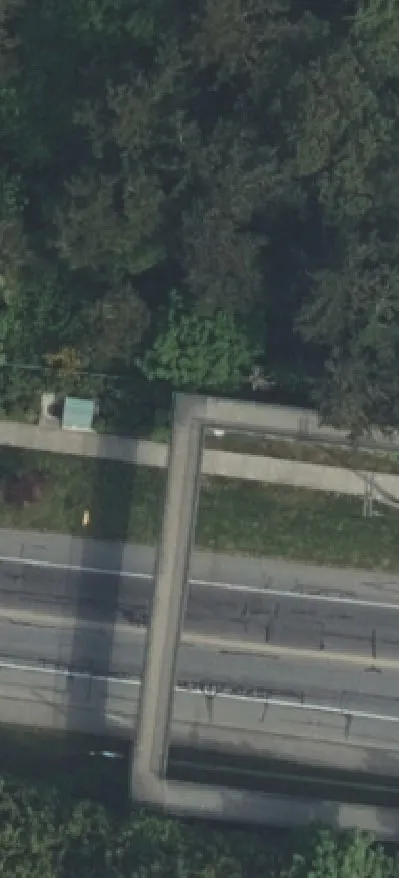
Appendix B: SimTraffic Report – Total 2028 PM Peak Hour Queue Analysis
Queuing and Blocking Report - Baseline
Intersection: 3: Admirals Rd and Craigflower/ Island Highway intersection.
| Movement | EB | EB | EB | WB | WB | NB | NB | NB | SB | SB | SB | SB |
|---|---|---|---|---|---|---|---|---|---|---|---|---|
| Directions Served | LT | T | R | LT | TR | L | L | TR | L | T | T | R |
| Maximum Queue (m) | 142.0 | 131.4 | 16.9 | 65.1 | 59.2 | 88.5 | 92.5 | 105.4 | 42.5 | 98.0 | 114.6 | 19.6 |
| Average Queue (m) | 87.7 | 71.6 | 3.4 | 57.2 | 56.0 | 72.9 | 88.4 | 93.5 | 39.9 | 79.7 | 94.8 | 19.4 |
| 95th Queue (m) | 147.8 | 125.0 | 14.5 | 63.8 | 59.4 | 98.3 | 101.7 | 132.8 | 47.9 | 110.4 | 134.6 | 19.9 |
Intersection: 4: Island Hwy Note: This is the two to one lane Island Highway merge modelled at 100m. 95th percentile queues shown at 108m and 114m.
Intersection: 6: Island Hwy & Shoreline Dr Note: This suggests that peak hour 95th percentile queues of 131m for westbound vehicles at the proposed Shoreline signal. The link distance is approximately 150m.
Appendix C: Conceptual Design Estimates
Conceptual Design Estimate
Project: Christie Point - Shoreline Drive/Island Hwy Improvements Job No: 6143.01 Date: 11-Apr-17 By: DEM Sheet: 1 of 2
| Item | Approximate Quantity | Unit | Unit Price | Amount |
|---|---|---|---|---|
| 1.00 REMOVALS/RELOCATIONS | ||||
| 1.01 Concrete Curb & Gutter | 180 | m | $35.00 | $6,300.00 |
| 1.02 Concrete Median | 85 | m | $35.00 | $2,975.00 |
| 1.03 Stone Retaining Wall | 65 | m | $50.00 | $3,250.00 |
| 1.04 Concrete Sidewalk | 10 | m | $30.00 | $300.00 |
| 1.05 Pavement Marking | 1130 | m | $15.00 | $16,950.00 |
| 1.06 Utility Pole | 3 | each | $40,000.00 | $120,000.00 |
| 1.07 Signs | 2 | each | $200.00 | $400.00 |
| Subtotal | $150,175.00 | |||
| 2.00 NEW CONSTRUCTION | ||||
| 2.01 Concrete Curb & Gutter | 185 | m | $110.00 | $20,350.00 |
| 2.02 Concrete Sidewalk | 10 | m | $100.00 | $1,000.00 |
| 2.03 Retaining Wall | 65 | m | $250 | $16,250 |
| 2.04 Pavement Marking (line) | 1130 | m | $15.00 | $16,950.00 |
| 2.05 Pavement Marking (sym) | 27 | each | $110 | $2,970 |
| 2.06 Roadway Asphalt | 120 | t | $160.00 | $19,200.00 |
| 2.07 Tack Coat | 265 | m² | $20.00 | $5,300.00 |
| 2.08 Roadway Granular | 180 | t | $80 | $14,400.00 |
| 2.09 Misc Earth Excavation | 1 | lump sum | $5,000.00 | $5,000.00 |
| 2.10 Intersection Signalization | 1 | lump sum | $150,000.00 | $150,000.00 |
| 2.11 Signal Advanced Warning EB | 1 | lump sum | $40,000.00 | $40,000.00 |
| Subtotal | $291,420.00 | |||
| 3.00 MISCELLANEOUS | ||||
| 3.01 Traffic Control | 1 | lump sum | $10,000.00 | $10,000.00 |
| 3.02 Tree Protection | 1 | lump sum | $5,000.00 | $5,000.00 |
| 3.03 Environmental Protection | 1 | lump sum | $5,000.00 | $5,000.00 |
| Subtotal | $20,000.00 | |||
| Total | $461,595.00 | |||
| Contingencies | 15% | $69,239.25 | ||
| Sub total | $530,834.25 | |||
| Engineering and Administration | 15% | $79,625.14 | ||
| TOTAL | $610,459.39 | |||
| City Inspection | 4% | $24,418.38 | ||
| GRAND TOTAL | $634,877.76 | |||
| SAY | $635,000.00 |
Notes:
- Prices, quantities and items are approximate and for discussion purposes only.
- This estimate does NOT include applicable taxes.
- Roadway material composition not determined.
- Proposed design of road in Appendix A is conceptual only.
- Removal and reinstatement of existing retaining wall requires detailed review.
- No underground utilities have been confirmed as part of this estimate.
- Estimate does not include any additional intersection lighting hardware that may be required as part of signalization.
- Utility pole relocations are approximate. Alignment of existing poles and available line slack may require additional pole relocations and/or new overhead line to be run.
Conceptual Design Estimate
Project: Christie Point - Shoreline Drive Road Improvements Sheet: 2 of 2 Note: Includes sidewalk on Shoreline Drive and "sharrow" bicycle markings
| Item | Approximate Quantity | Unit | Unit Price | Amount |
|---|---|---|---|---|
| 1.00 REMOVALS/RELOCATIONS | ||||
| 1.01 Asphalt (driveways) | 180 | m² | $20.00 | $3,600.00 |
| 1.02 Earth/Gravel/Top Soil | 1 | lump sum | $5,000.00 | $5,000.00 |
| 1.03 Pavement Marking (line) | 200 | m | $15.00 | $3,000.00 |
| Subtotal | $11,600.00 | |||
| 2.00 NEW CONSTRUCTION | ||||
| 2.01 Concrete Curb & Gutter | 122 | m | $110.00 | $13,420.00 |
| 2.02 Concrete Sidewalk | 122 | m | $100.00 | $12,200.00 |
| 2.04 Pavement Marking (line) | 60 | m | $15.00 | $900.00 |
| 2.05 Pavement Marking (sym) | 6 | each | $110 | $660 |
| 2.06 Misc Granular and Top Soil | 1 | lump sum | $15,000.00 | $15,000.00 |
| 2.09 Misc Earth Excavation | 1 | lump sum | $5,000.00 | $5,000.00 |
| 2.10 Illumination on Hydro Pole | 8 | each | $1,500.00 | $12,000.00 |
| 2.11 Pave Existing Trail | 275 | m | $65.00 | $17,875.00 |
| 2.12 Yellow Centre Line on Trail | 275 | m | $10.00 | $2,750.00 |
| Subtotal | $77,055.00 | |||
| 3.00 MISCELLANEOUS | ||||
| 3.01 Traffic Control | 1 | lump sum | $5,000.00 | $5,000.00 |
| 3.02 Tree Protection | 1 | lump sum | $3,000.00 | $3,000.00 |
| 3.03 Environmental Protection | 1 | lump sum | $5,000.00 | $5,000.00 |
| Subtotal | $13,000.00 | |||
| Total | $101,655.00 | |||
| Contingencies | 15% | $15,248.25 | ||
| Sub total | $116,903.25 | |||
| Engineering and Administration | 15% | $17,535.49 | ||
| TOTAL | $134,438.74 | |||
| City Inspection | 4% | $5,377.55 | ||
| GRAND TOTAL | $139,816.29 | |||
| SAY | $140,000.00 |
Notes:
- Prices, quantities and items are approximate and for discussion purposes only.
- This estimate does NOT include applicable taxes.
- Feasibility of "sharrow" bicycle facility on Shoreline Dr. is conceptual and requires further review.
- No underground utilities have been confirmed as part of this estimate.
- Location of proposed sidewalk is currently along/overtop of an existing ditch, culverts and catch basins. This estimate does NOT include relocation or construction of new drainage infrastructure.