TOWN OF VIEW ROYAL PROPOSED 2021-2025 FINANCIAL PLAN
A staff presentation deck providing an overview of the 2021-2025 Financial Plan, highlighting taxation impacts, operating revenues, and capital spending priorities.
TOWN OF VIEW ROYAL PROPOSED 2021-2025 FINANCIAL PLAN
February 16, 2021
Budget Workshops – Day 1
February 16, 2021
Purpose
To provide Council with information regarding the 2021-2025 Financial Plan
- Schedule and process
- Budget binder organization
- Financial Plan highlights
- Consideration of non-core items (as time permits)
- Recap and next steps

Schedule and process
- February: Workshops
- March: Grants in aid, Online Citizen Budget
- April: Results from online engagement, Approval in principal, Tax rates
- May: Bylaws adoption, Tax notice with informational insert
Budget Workshops
- Less presentation, more conversation

Two speech bubbles icon - Noted
- Shared with all
- Clear direction
Budget binder organization
Distributed February 9, 2021
- Introduction
- Council initiatives
- Tab 1 Consolidated Financial Plan
- Tab 2 Non-core Requests
- Tab 3 Capital Plan
- Tab 4 Service Plans Budget Details
- Tab 5 Project Summaries
- Tab 6 Projected Reserve Balances
Consolidated Financial Plan
Operating Plan
Schedule 1.1 = Schedule 1.2 + Schedule 1.3
Capital Plan
Assessments and Taxation
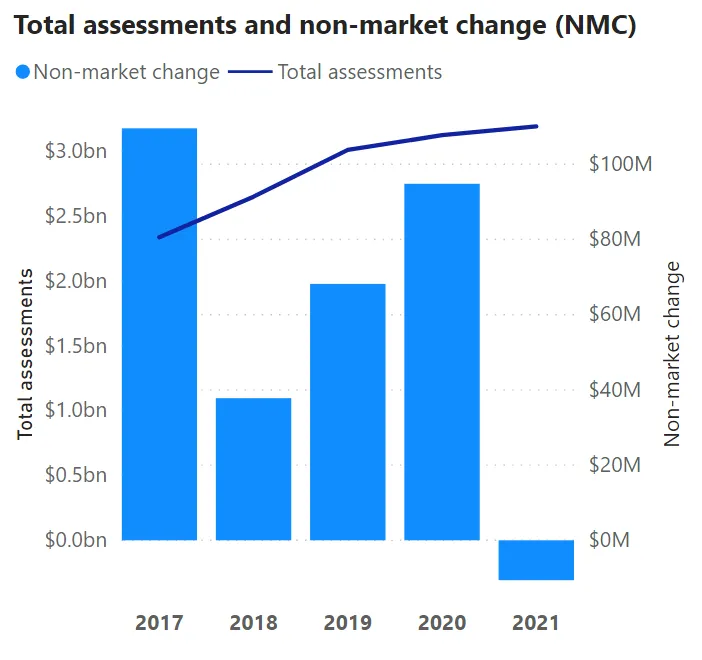
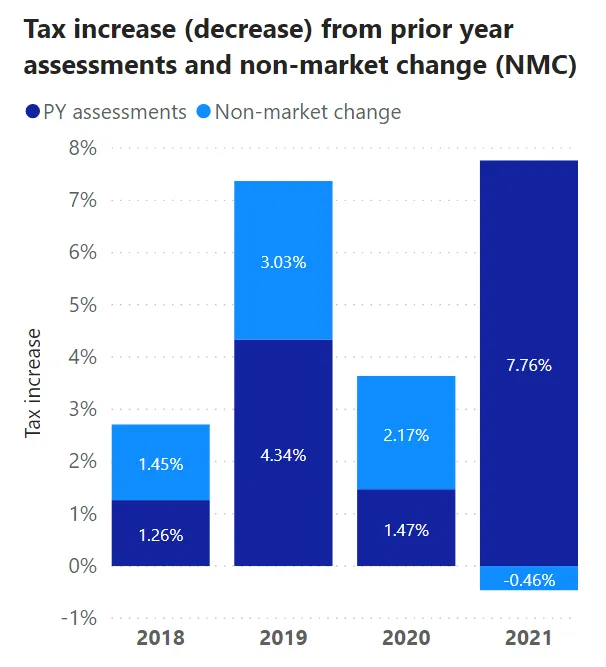
- 2020 tax revenue decrease due to non-market change: 0.48%
- Tax increase if budget is approved “as is”: 7.3%
- Value of 1% tax increase in 2021: $90,200
Operating Revenue
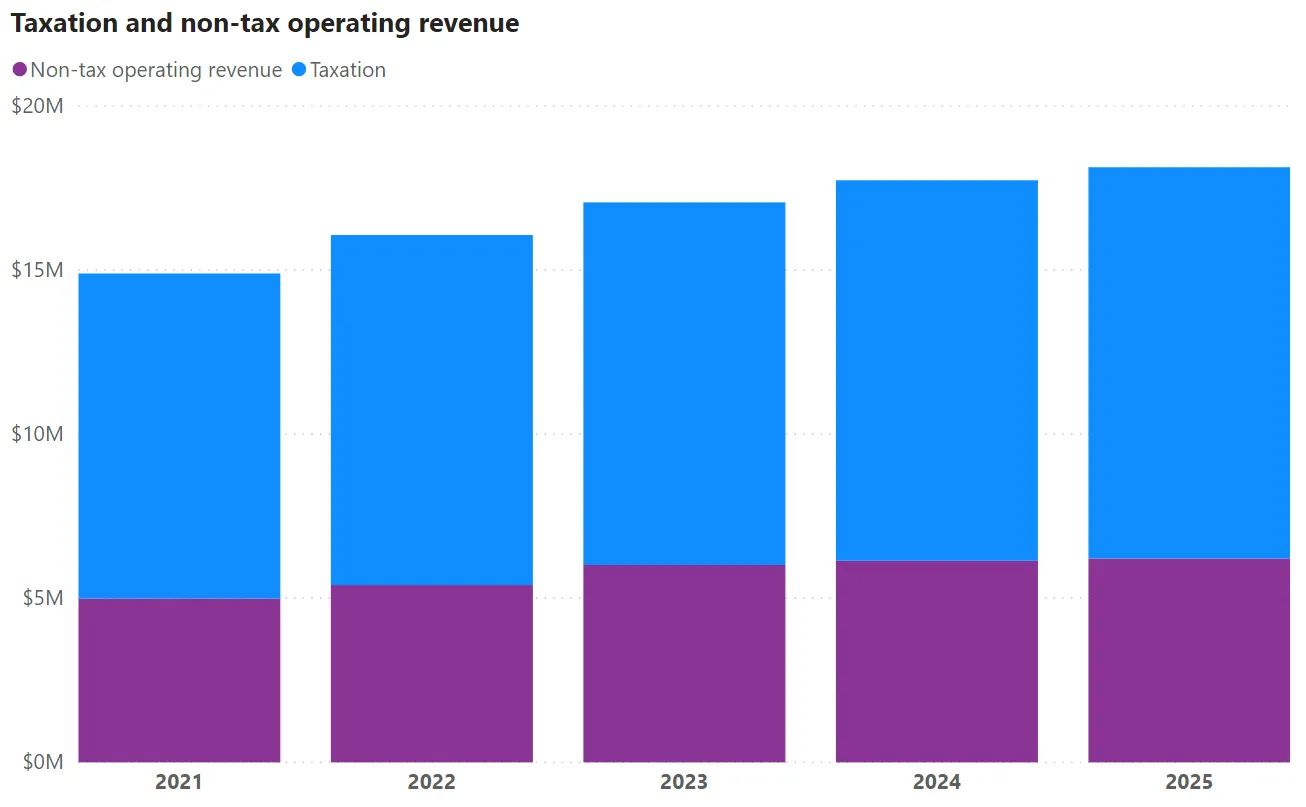
- 2021 total operating revenue: $15 M
- 2021 total non-tax operating revenue: $5 M
Operating Revenue
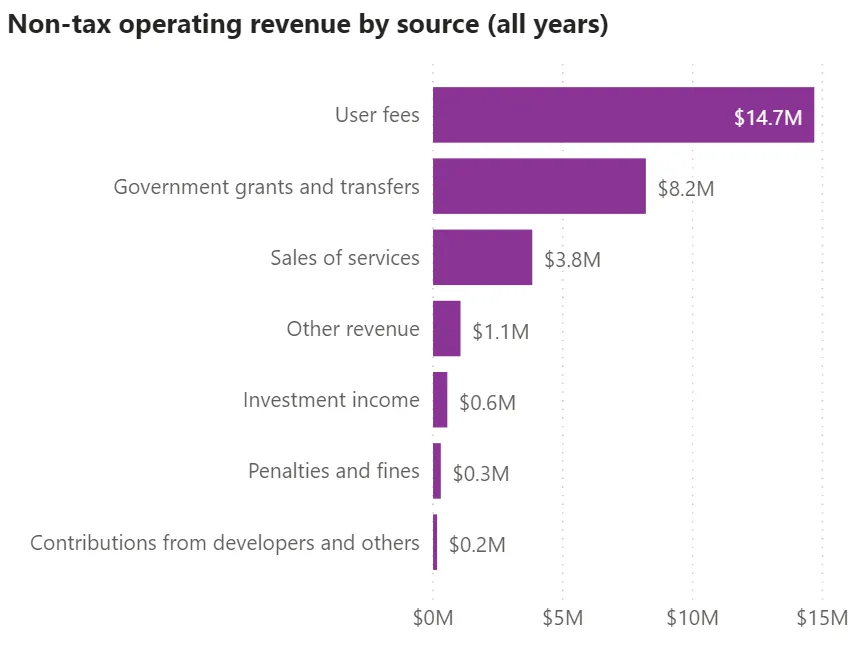
- 2020 total Government grants and transfers: $1 M
- User fees projected annual increase: 1%-2%
Operating Expense
- Average annual operating expenses: $16 M
- 5-year total non-core requests: $2.5 M
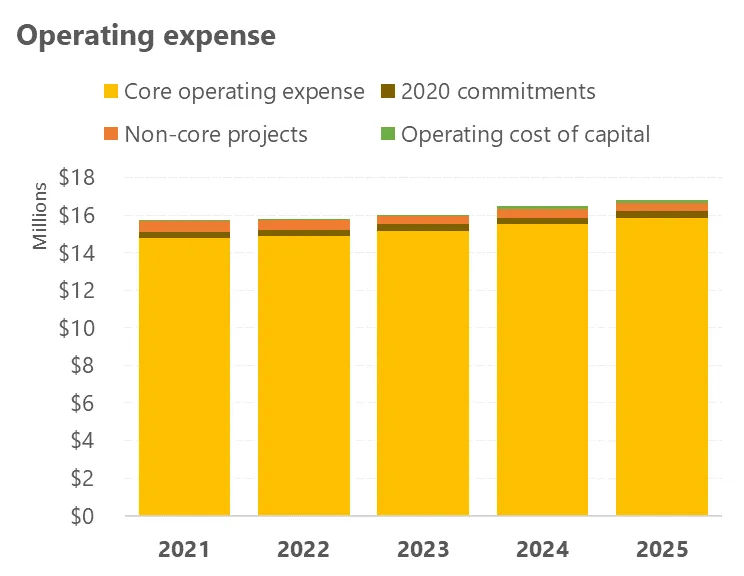
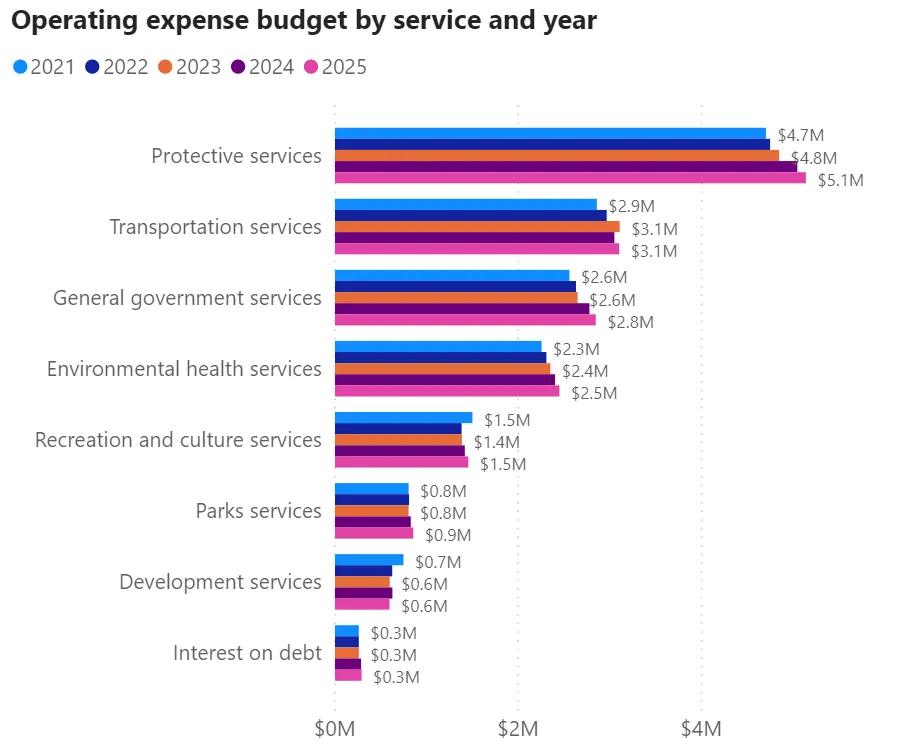
Operating Expense
- Protective and Transportation Services: 48%
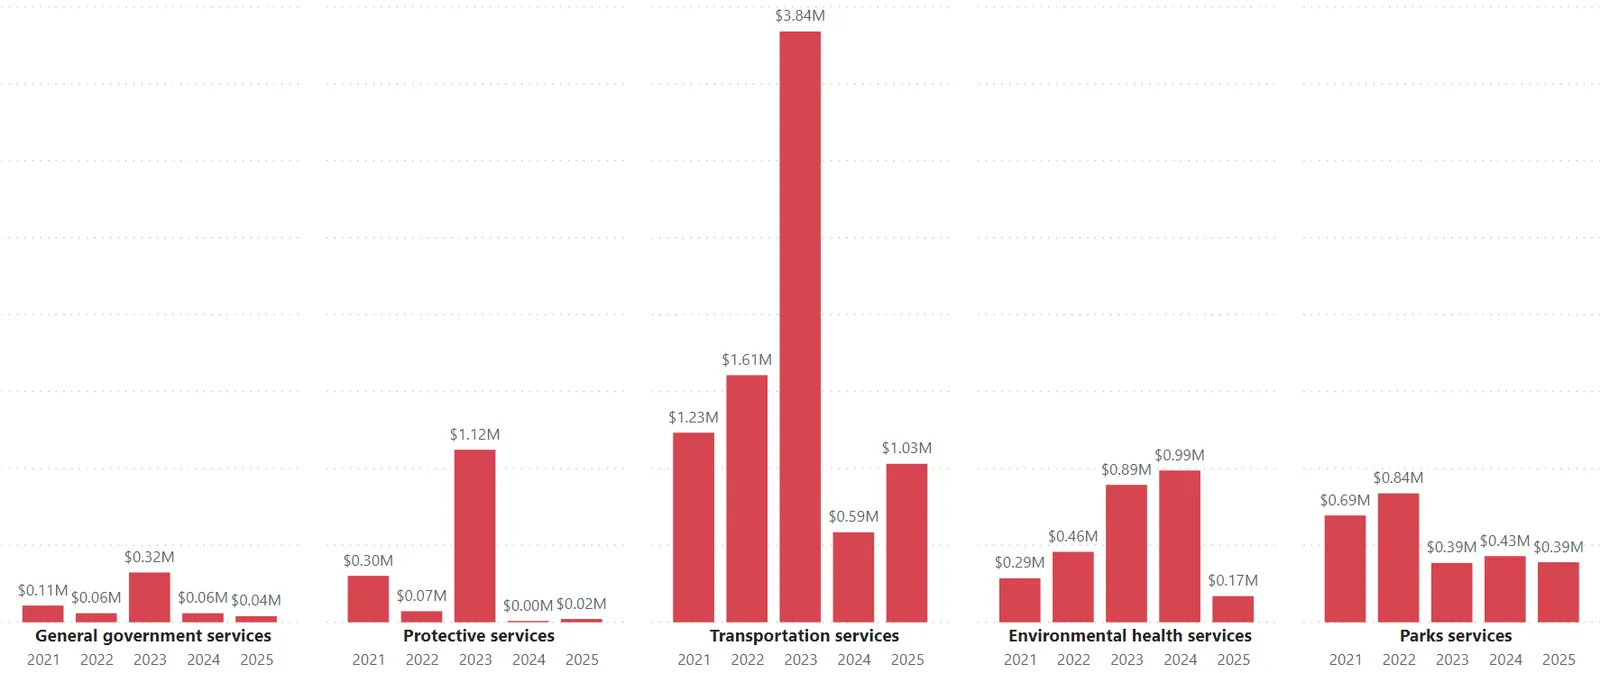
Capital Spending
- 5-year total capital investments: $16 M
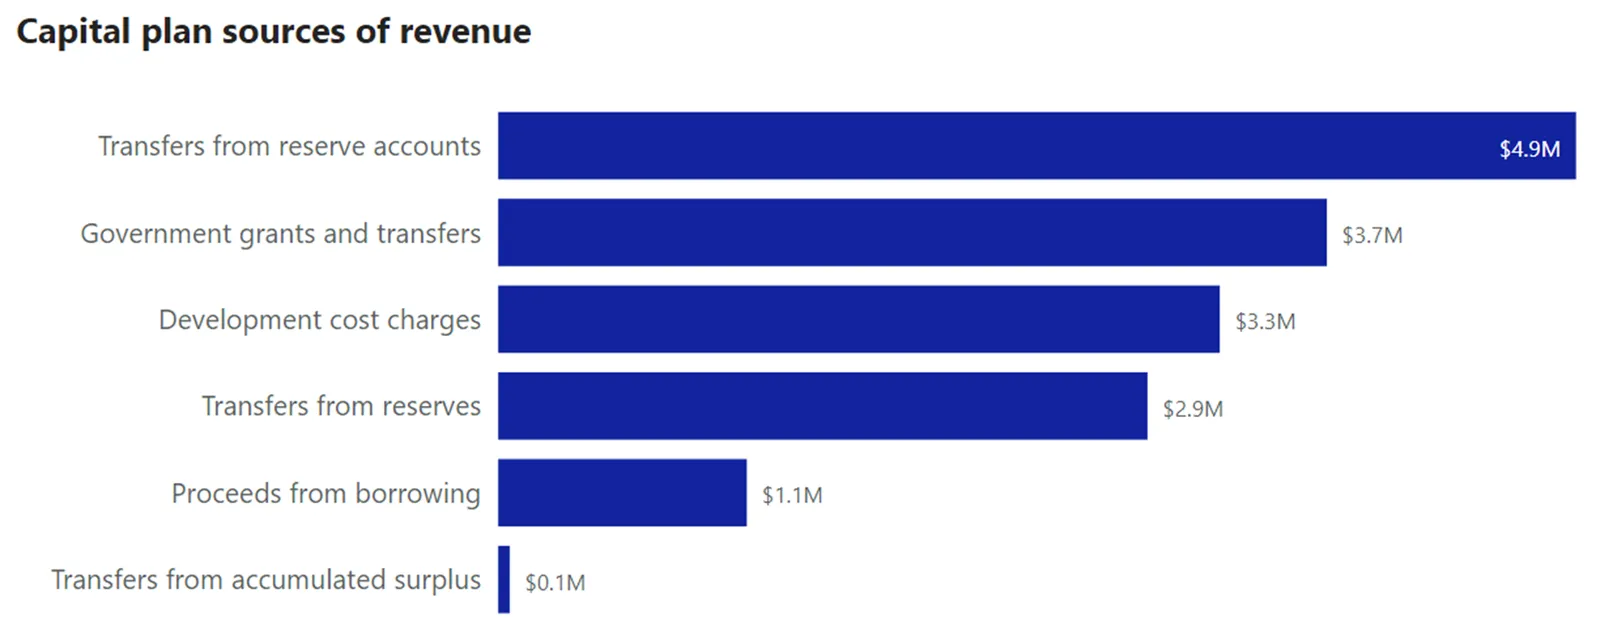
Capital Funding
- Total capital spending funded by Casino revenue and gas tax (Community Works Fund): 30%
5-year Net Change in Reserves
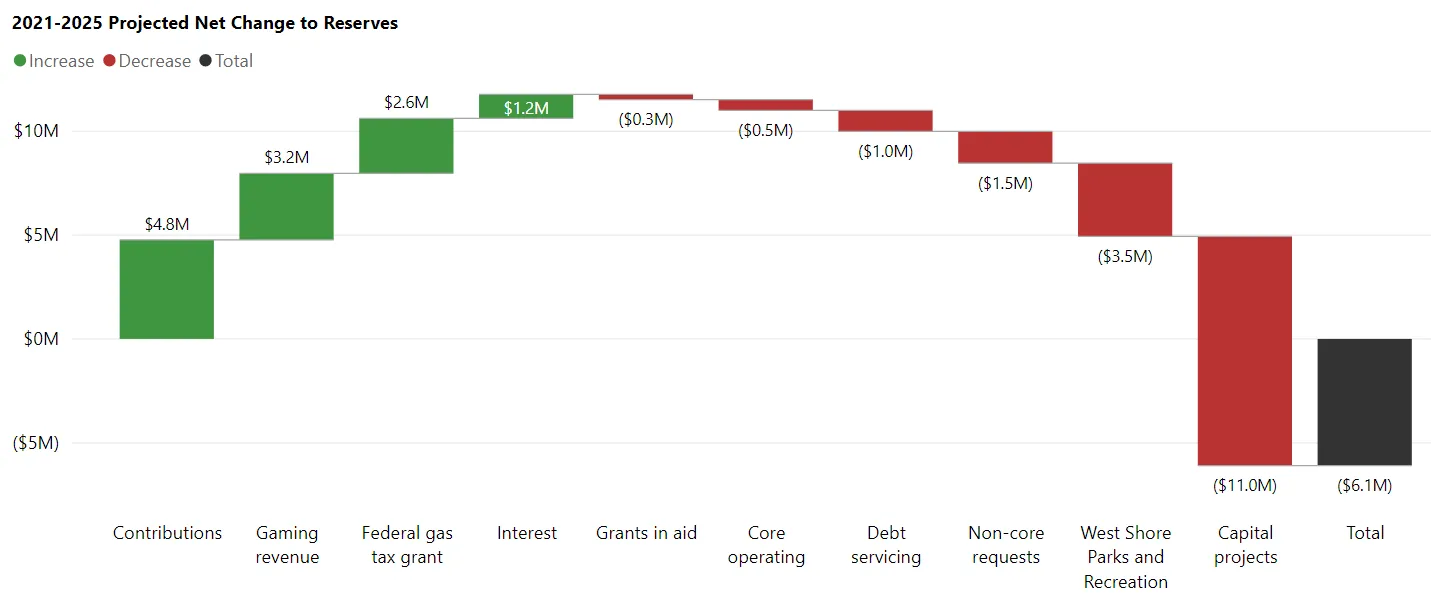
- 5-year net change: - $6.1 M
- Funding for core operations: $4.3 M
- Capital Reserves $109 K net increase
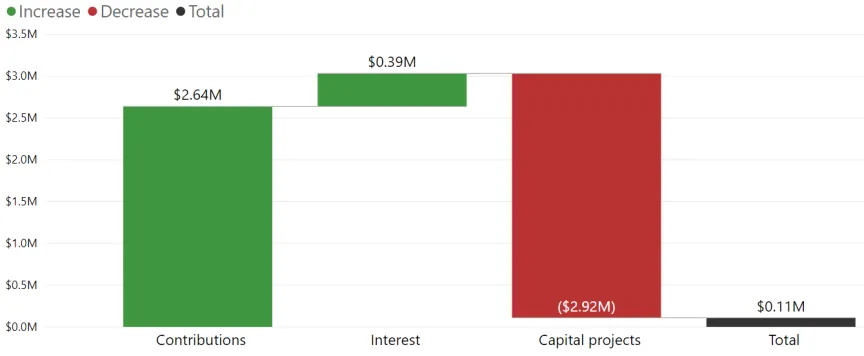
Waterfall chart for Capital Reserves - Operating Reserves $8 K net increase
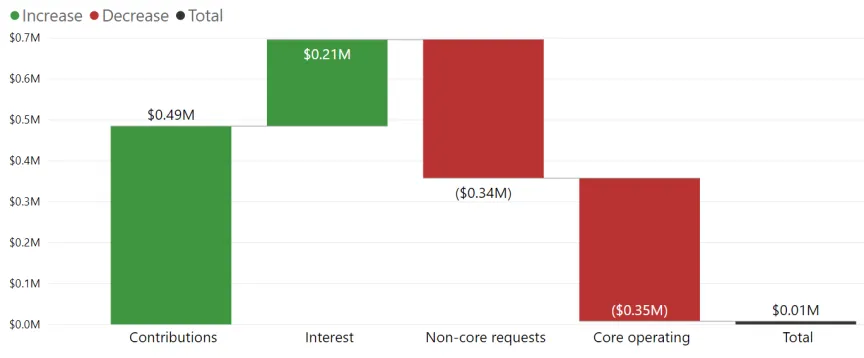
Waterfall chart for Operating Reserves - Statutory Reserves $1.284 M net decrease
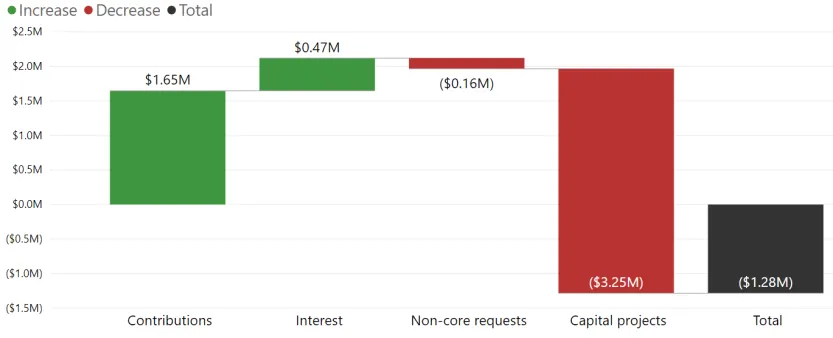
Waterfall chart for Statutory Reserves - Reserve Accounts $4.927 M net decrease
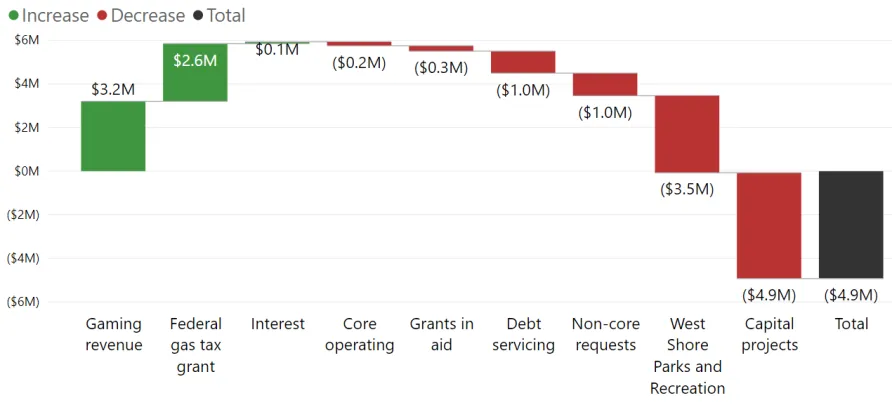
Waterfall chart for Reserve Accounts
Summary – Implications for Taxpayers
Changes to revenues 4.1%
- End of transitional funding for Our Place
- Replace 2020 pandemic relief draw from surplus
- Net decrease in other non-tax revenue
Changes to expenses 3.2%
- 2020 commitments (policing, transportation, parks personnel)
- Labour costs
- Webcasting production
- West Shore Parks and Recreation funding transition
- Non-core requests and operational cost of capital
- Other net increases in expenses
- Reduced reserve contributions
7.3% total 2021 tax revenue increase, if financial plan approved as presented
Summary – Implications for Taxpayers
7.3% total 2021 tax revenue increase, if financial plan approved as presented
The decrease in assessments due to non-market change results in a loss of tax revenue of $43,400 or about a 0.48% tax increase on 2020 assessed properties
| Tax Revenue | % Change | |
|---|---|---|
| Tax revenue from prior year assessed properties | 9,761,621 | 7.78% |
| Tax revenue loss from non-market change | (43,363) | (0.48%) |
| Total property tax revenue | 9,718,258 | 7.30% |
Consolidated Financial Plan Highlights
As presented:
- 7.3% total tax revenue increase
- Average residential home in 2021 assessed at $754,500 (3.4% increase)
- $9 increase for WSPR transition
- $164 increase for all other services
- Supports strategic initiatives and other non-core requests
- $576 thousand in 2021
- $2.5 million total over 5 years
- Funds investments in capital infrastructure renewal or acquisitions
- $2.6 million in 2021
- $15.9 million total over 5 years
- Begins to transition funding for West Shore Parks and Recreation service to taxation, improving future sustainability
- Pauses or reduces some reserve contributions in 2021
- Projects gradual return to normal for Casino revenue starting in 2022
Budget Workshops – Day 1
February 16, 2021
Purpose
To provide Council with information regarding the 2021-2025 Financial Plan
- Schedule and process
- Budget binder organization
- Financial Plan highlights
- Consideration of non-core items (as time permits)
- Recap and next steps
Consideration of Non-core Requests

Project Summary
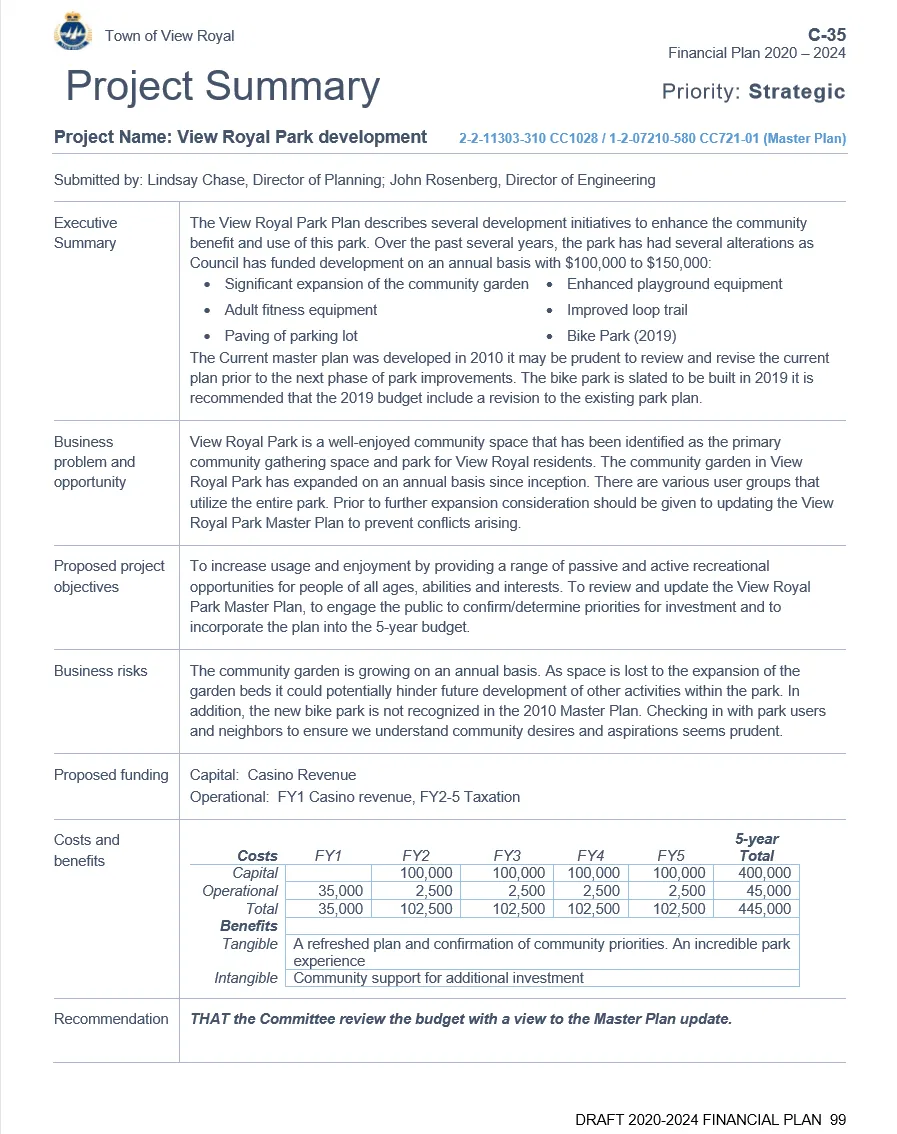
Project Name: View Royal Park development Reference No: C-35 Financial Plan 2020 – 2024 Priority: Strategic
Submitted by: Lindsay Chase, Director of Planning; John Rosenberg, Director of Engineering
Executive Summary: The View Royal Park Plan describes several development initiatives to enhance the community benefit and use of this park. Over the past several years, the park has had several alterations as Council has funded development on an annual basis with $100,000 to $150,000:
- Significant expansion of the community garden
- Enhanced playground equipment
- Adult fitness equipment
- Improved loop trail
- Paving of parking lot
- Bike Park (2019) The Current master plan was developed in 2010 it may be prudent to review and revise the current plan prior to the next phase of park improvements. The bike park is slated to be built in 2019 it is recommended that the 2019 budget include a revision to the existing park plan.
Business problem and opportunity: View Royal Park is a well-enjoyed community space that has been identified as the primary community gathering space and park for View Royal residents. The community garden in View Royal Park has expanded on an annual basis since inception. There are various user groups that utilize the entire park. Prior to further expansion consideration should be given to updating the View Royal Park Master Plan to prevent conflicts arising.
Proposed project objectives: To increase usage and enjoyment by providing a range of passive and active recreational opportunities for people of all ages, abilities and interests. To review and update the View Royal Park Master Plan, to engage the public to confirm/determine priorities for investment and to incorporate the plan into the 5-year budget.
Business risks: The community garden is growing on an annual basis. As space is lost to the expansion of the garden beds it could potentially hinder future development of other activities within the park. In addition, the new bike park is not recognized in the 2010 Master Plan. Checking in with park users and neighbors to ensure we understand community desires and aspirations seems prudent.
Proposed funding:
- Capital: Casino Revenue
- Operational: FY1 Casino revenue, FY2-5 Taxation
Costs and benefits:
| Costs | FY1 | FY2 | FY3 | FY4 | FY5 | 5-year Total |
|---|---|---|---|---|---|---|
| Capital | 100,000 | 100,000 | 100,000 | 100,000 | 400,000 | |
| Operational | 35,000 | 2,500 | 2,500 | 2,500 | 2,500 | 45,000 |
| Total | 35,000 | 102,500 | 102,500 | 102,500 | 102,500 | 445,000 |
| Benefits | |
|---|---|
| Tangible | A refreshed plan and confirmation of community priorities. An incredible park experience |
| Intangible | Community support for additional investment |
Recommendation: THAT the Committee review the budget with a view to the Master Plan update.
Document Images
(9)
Two speech bubbles icon

Two people with a question mark in a speech bubble icon

Email envelope with an @ symbol icon

Compass star icon

Light blue puzzle piece labeled "Core"

Yellow puzzle piece labeled "Non-core"

Dark blue puzzle piece labeled "Capital"

Medium blue puzzle piece labeled "Ops cost of capital"

Purple puzzle piece labeled "Reserves"