GVPL 2017 Provisional Budget and 2017-2021 Five Year Financial Plan
Financial documentation outlining projected revenues, expenses, capital budgets, and municipal contributions for the library system.
2017 Provisional Budget and 2017-2021 Five Year Financial Plan
Approval Dates:
- Finance Committee – October 6, 2016
- Library Board – October 25, 2016
- Municipal Councils –
BUDGET AT A GLANCE
| 2017 | 2016 | |
|---|---|---|
| Operating Budget | $ 17,989,322 | $ 17,622,471 |
| Deduct: Unfunded Amortization | $ (1,758,200) | $ (1,724,200) |
| Funded Operating Budget | $ 16,231,122 | $ 15,898,271 |
| Operating Budget Increase | 2.1% | 3.3% |
| Capital Budget | $ 2,327,948 | $ 2,367,865 |
| Capital Budget Increase (Decrease) | -1.7% | 30.9% ¹ |
| Total Budget - Funded | $ 18,559,070 | $ 18,266,136 |
| Total Budget Increase | 1.6% | 6.2% |
| Municipal contribution - total | $ 16,538,399 | $ 16,065,447 |
| Municipal contribution - increase | $ 472,952 | $ 500,181 |
| Municipal contribution - increase (%) | 2.94% | 3.21% |
| Cost per capita | $ 52.90 | $ 51.39 |
| Cost per capita increase | $ 1.51 | $ 1.36 |
¹ 2016 increase includes one-time capital budget for Langford Heritage Branch start-up to furnish and equip new branch, funded by City of Langford. ² Includes an estimated rate of negotiated wage and benefit increases, which are jointly negotiated through GVLRA.
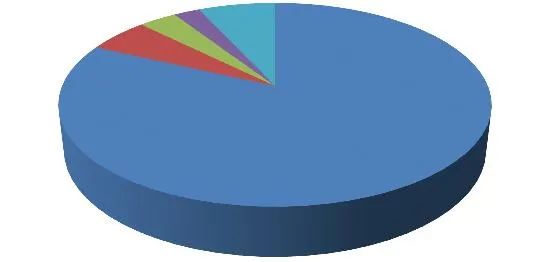
Municipal Contribution Increase $472,952, 2.94%
2017 Budget and Five-Year Financial Plan (Provisional)
| Revenues | 2016 | 2017 | Change | Change% | Notes | 2018 | 2019 | 2020 | 2021 |
|---|---|---|---|---|---|---|---|---|---|
| Municipal contributions - operating | $16,065,447 | $16,538,399 | $ 472,952 | 2.9% | 1 | $16,876,813 | $ 17,098,205 | $17,345,500 | $17,576,994 |
| Municipal contributions - start-up | 747,858 | 772,635 | 24,777 | 3.3% | 2 | 460,000 | - | - | - |
| Provincial grants | 641,527 | 642,339 | 812 | 0.1% | 642,339 | 642,339 | 642,339 | 642,339 | |
| Federal grants | 5,534 | 5,534 | - | 0.0% | 5,534 | 5,534 | 5,534 | 5,534 | |
| Fines, fees and printing | 529,800 | 503,800 | (26,000) | -4.9% | 3 | 484,080 | 466,036 | 449,097 | 433,201 |
| Contracts for service | 27,560 | 28,111 | 551 | 2.0% | 28,673 | 29,246 | 29,831 | 30,428 | |
| Investment income | 85,000 | 74,000 | (11,000) | -12.9% | 4 | 74,000 | 74,000 | 74,000 | 74,000 |
| Donations and other grants | 80,228 | 48,232 | (31,996) | -39.9% | 5 | 37,121 | 30,000 | 30,000 | 30,000 |
| Total Revenues | 18,182,954 | 18,613,050 | 430,096 | 2.4% | 18,608,560 | 18,345,360 | 18,576,301 | 18,792,496 | |
| Expenses | |||||||||
| Salaries and benefits | 12,753,653 | 13,093,485 | 339,832 | 2.7% | 6 | 13,388,477 | 13,583,670 | 13,786,998 | 13,992,513 |
| Library materials | 966,014 | 966,014 | - | 0.0% | 966,014 | 966,014 | 966,014 | 966,014 | |
| Amortization | 1,724,200 | 1,758,200 | 34,000 | 2.0% | 7 | 1,659,800 | 1,530,400 | 1,418,500 | 1,334,400 |
| Supplies and services | 963,575 | 1,037,751 | 74,176 | 7.7% | 8 | 1,069,962 | 1,058,301 | 1,066,623 | 1,059,461 |
| Building occupancy | 855,433 | 783,950 | (71,483) | -8.4% | 8 | 767,342 | 761,350 | 772,578 | 783,869 |
| Other expenses | 359,596 | 349,922 | (9,674) | -2.7% | 8 | 350,209 | 353,152 | 356,215 | 357,766 |
| Total Expenses | 17,622,471 | 17,989,322 | 366,851 | 2.1% | 18,201,804 | 18,252,887 | 18,366,928 | 18,494,023 | |
| Annual Surplus/(Deficit) | 560,483 | 623,728 | 63,245 | 11.3% | 406,756 | 92,473 | 209,373 | 298,473 | |
| Add back: Unfunded Amortization | 1,724,200 | 1,758,200 | 34,000 | 2.0% | 7 | 1,659,800 | 1,530,400 | 1,418,500 | 1,334,400 |
| 2,284,683 | 2,381,928 | 97,245 | 4.3% | 2,066,556 | 1,622,873 | 1,627,873 | 1,632,873 | ||
| Municipal contributions-operating increase | 3.2% | 2.9% | 2.0% | 1.3% | 1.4% | 1.3% |
| 2016 | 2017 | Change | Change% | Notes | 2018 | 2019 | 2020 | 2021 | |
|---|---|---|---|---|---|---|---|---|---|
| Balance forward from Page 1 | 2,284,683 | 2,381,928 | 97,245 | 4% | 2,066,556 | 1,622,873 | 1,627,873 | 1,632,873 | |
| Capital Expenses | |||||||||
| Library collection - operating | 1,343,873 | 1,343,873 | - | 0% | 1,343,873 | 1,343,873 | 1,343,873 | 1,343,873 | |
| Hardware - operating | 106,145 | 96,295 | (9,850) | -9% | 9 | 93,000 | 93,000 | 93,000 | 93,000 |
| Furniture and equipment - operating | 60,000 | 60,000 | - | 0% | 60,000 | 60,000 | 60,000 | 60,000 | |
| Building Improvement - operating | 80,000 | 80,000 | - | 0% | 85,000 | 90,000 | 95,000 | 100,000 | |
| Vehicles - operating | 43,605 | - | (43,605) | -100% | 9 | - | - | - | - |
| Branch Start-ups: | |||||||||
| Library collection - Langford Heritage Branch | 350,000 | - | (350,000) | -100% | 2 | - | - | - | - |
| Library collection - James Bay Branch | - | 300,000 | 300,000 | 100% | 2 | - | - | - | - |
| Library collection - Esquimalt Branch | - | - | - | 0% | 20,000 | - | - | - | |
| Hardware Langford Heritage Branch | 47,320 | - | (47,320) | -100% | 2 | - | - | - | - |
| Hardware James Bay Branch | - | 64,915 | 64,915 | 100% | 2 | - | - | - | - |
| Hardware Esquimalt Branch Relocation | - | - | - | 0% | 69,000 | - | - | - | |
| Furniture & equipment Langford Heritage Branch | 336,922 | - | (336,922) | -100% | 2 | - | - | - | - |
| Furniture & equipment James Bay Branch | - | 382,865 | 382,865 | 100% | 2 | - | - | - | - |
| Furniture & equipment Esquimalt Branch Relocation | - | - | - | 0% | 347,500 | - | - | - | |
| 2,367,865 | 2,327,948 | (39,917) | -2% | 2,018,373 | 1,586,873 | 1,591,873 | 1,596,873 | ||
| Unrestricted donations: Development Assistant | (18,175) | - | 18,175 | -100% | - | - | - | - | |
| Unrestricted donations: Marketing Research | (4,000) | (4,000) | 100% | - | - | - | - | ||
| Contingency Reserve Fund | 20,000 | 36,000 | 16,000 | 80% | 36,000 | 36,000 | 36,000 | 36,000 | |
| Transfers to/(from) Reserve Funds | 1,825 | 32,000 | 30,175 | 1653% | 10 | 36,000 | 36,000 | 36,000 | 36,000 |
| Transfers to/(from) Accumulated Surplus | (109,475) | - | 109,475 | -100% | 11 | ||||
| Debt repayments | 24,468 | 21,980 | (2,488) | -10% | 12 | 12,183 | - | - | - |
| (83,182) | 53,980 | 137,162 | -165% | 48,183 | 36,000 | 36,000 | 36,000 | ||
| Financial Plan Balance | - | - | - | - | - | - | - | - |
2017 MUNICIPAL CONTRIBUTIONS (PROVISIONAL)
| 2016 Share | Total Requisition 2016 | Operating Budget 2017 | Rent Adjustment ¹ | Total Requisition 2017 | Increase $ | Increase % | Building Maint. Costs ² | Total Municipal Budget 2017 | |
|---|---|---|---|---|---|---|---|---|---|
| Central Saanich | 5.21% | $846,232 | $861,651 | $9,310 | $870,961 | $24,728 | 2.92% | $0 | $870,961 |
| Colwood | 4.71% | 762,987 | 778,959 | 6,330 | 785,289 | 22,302 | 2.92% | 26,787 | 812,076 |
| Esquimalt | 5.46% | 873,093 | 902,996 | (4,057) | 898,939 | 25,846 | 2.96% | 0 | 898,939 |
| Highlands | 0.68% | 110,157 | 112,461 | 912 | 113,373 | 3,216 | 2.92% | 3,876 | 117,249 |
| Langford | 10.18% | 1,649,194 | 1,683,609 | 13,346 | 1,696,955 | 47,762 | 2.90% | 57,901 | 1,754,856 |
| Metchosin | 1.57% | 254,316 | 259,653 | 2,170 | 261,823 | 7,507 | 2.95% | 8,933 | 270,756 |
| Oak Bay | 6.44% | 1,029,769 | 1,065,073 | (4,818) | 1,060,255 | 30,486 | 2.96% | 0 | 1,060,255 |
| Saanich | 33.72% | 5,395,089 | 5,576,748 | (22,054) | 5,554,694 | 159,604 | 2.96% | 0 | 5,554,694 |
| Victoria | 28.98% | 4,653,424 | 4,792,828 | (2,346) | 4,790,482 | 137,058 | 2.95% | 67,250 | 4,857,732 |
| View Royal | 3.05% | 491,186 | 504,421 | 1,207 | 505,628 | 14,442 | 2.94% | 4,836 | 510,464 |
| Total | 100% | $16,065,447 | $16,538,399 | $0 | $16,538,399 | $472,952 | 2.94% | $169,583 | $16,707,982 |
¹ The Rent Adjustment is calculated in accordance with Section 8.12 (a), (b) and (c) of the Library Operating Agreement and relates to portions of buildings used to benefit all member municipalities: the Collection and Technical Services section of the Juan de Fuca Branch building and the Administrative portion of the Central Branch building. Municipalities which did not contribute to the initial acquisition of such building or who did not subsequently purchase a portion of such building pays reasonable rent to those Municipalities that did. Rent adjustments are subject to change in the final budget submission, due by March 1, 2017, once property assessment values have been received.
² Building Maintenance Costs for jointly owned buildings are additional municipal budget amounts that are over-and-above the requisition for the library operating budget. The two branches that are jointly owned are the Central Branch and the Juan de Fuca Branch. Similar costs at other branches do not flow through GVPL and are paid by the municipalities directly. Building costs are estimates. Once actual costs are known, GVPL invoices the municipalities. Budgeted building costs for the branch portion of the jointly-owned buildings, excluding administrative area costs that are included in the library operating budget, are as follows:
| Central Branch | Juan de Fuca Branch | Total | |
|---|---|---|---|
| Shared strata costs (repairs, maintenance, MAM projects, cleaning, security, recycling) | 18,774 | - | 18,774 |
| Direct property manager costs (repairs, maintenance, misc.) | 23,292 | 22,389 | 45,681 |
| Building insurance | 17,539 | 10,404 | 27,943 |
| Strata contingency reserve contribution | 12,481 | - | 12,481 |
| Major asset maintenance (MAM) reserve fund contribution | - | 64,704 | 64,704 |
| Total | $ 72,086 | $ 97,497 | 169,583 |
Approved by the Library Board, October 25, 2016
2017 MUNICIPAL PER CAPITA CONTRIBUTIONS
| Total Requisition 2017 | Population ¹ | Cost Per Capita 2017 | Increase per capita | |
|---|---|---|---|---|
| Central Saanich | $870,961 | 15,794 | $55.15 | $1.57 |
| Colwood | 785,289 | 16,636 | 47.20 | $1.34 |
| Esquimalt | 898,939 | 16,207 | 55.47 | $1.59 |
| Highlands | 113,373 | 2,221 | 51.05 | $1.45 |
| Langford | 1,696,955 | 34,677 | 48.94 | $1.38 |
| Metchosin | 261,823 | 4,968 | 52.70 | $1.51 |
| Oak Bay | 1,060,255 | 17,448 | 60.77 | $1.75 |
| Saanich | 5,554,694 | 110,767 | 50.15 | $1.44 |
| Victoria | 4,790,482 | 83,200 | 57.58 | $1.65 |
| View Royal | 505,628 | 10,714 | 47.19 | $1.35 |
| Total | $16,538,399 | 312,632 | $52.90 | $1.51 |
¹ Source of 2016 population figures: BC Stats website: http://www.bcstats.gov.bc.ca/StatisticsBySubject/Demography/PopulationEstimates.aspx, 2014 population estimates, accessed on August 26, 2015.
General note: Percentage share of costs by municipality are determined based on 50% property assessment value and 50% population estimate. More detailed information on assessment values and population are available on request.
Notes to 2017 Budget
1 – Municipal contributions - operating (Increase $472,952)
As shown in the diagram on the Budget at a Glance page, 82% of the increase in municipal contributions is attributed to salaries and benefits, which are jointly negotiated through the GVLRA.
As in subsequent years, our fine and fee revenues overall are budgeted for a further decrease (contributes to 6% of the municipal contribution increase).
A proposed increase to the contribution to the contingency reserve contributes 3% of the municipal increase (Note 10). A budgeted decrease in investment revenues contributes 2% of the municipal contributions (Note 4).
The remaining 7% increase in municipal contributions is due to the loss of one-time funding from accumulated surplus for office space, regarding a lease which will terminate on May 31, 2017 (Note 8 and Note 11). Consequently, this increase is temporary to allow for the final months of the lease in 2017.
2 – Municipal contributions – start-up (Increase $24,777)
These costs relate to individual branch start-up costs to furnish, equip and include a collection inventory for new or relocated branches, which are funded by individual municipalities:
| Langford Heritage Branch – 2016 one-time contribution | Funded by Langford | $747,858 |
| James Bay Branch – 2017 one-time contribution | Funded by Victoria | $772,635 |
| Net budget increase | $24,777 |
The majority of these contributions are for capital expenditures, with a small percentage of start-up funding going towards non-capital costs, such as moving and some supplies below the asset threshold.
3 - Fines, fees and printing revenue (Decrease $26,000)
This revenue is estimated to continue to decline at a rate of 5%. 87% of this reduction is in fines, due to increasing use of e-formats, which do not incur fines. In addition, upon implementation of the new ILS in 2015, text notifications were added for patrons with overdue materials. This decrease includes offsetting increases in both meeting room rentals and printing as the demand for these services is expected to continue to increase. Fines and fees are currently under review and various alternatives for increases in this revenue line are being considered.
4 – Investment Income (Decrease $11,000)
The revenue is conservatively estimated to decline by 12% based on recent historical earnings, and to reflect the low GIC interest rates and projected continuation of modest earnings in the Municipal Finance Authority bond fund.
5 – Donations and Other Grants (Decrease $31,996)
This revenue reduction reflects one-time funding received in 2016 for OLiVe, our new outreach and literacy vehicle, funded by the Friends of the Library, Victoria Foundation, and individual donations. This revenue reduction therefore has a nil impact on the budget proposed for 2017, as budgeted expenditures have been reduced accordingly.
The 2017 budget includes $20,000 funding for the popular Books for Babies program, which represents a commitment to ensure a funding source continues to be available for this program in the future. Previous budgets did not include the revenue or expenditures for this program, reflecting a year-to-year approach.
6 – Salaries and Benefits (Increase $339,832)
The library’s collective agreement expires December 31, 2016. Consequently, we have made a concerted effort to keep non-salary budgets fixed due to the uncertainty this creates. This budget includes an estimated rate of negotiated wage and benefits as well as increases to salaries for two positions involving four employees as a result of job evaluation.
Total full-time equivalent (FTE) count for regularized employees, not including part-time auxiliary employees, has increased from 146.10¹ to 147.46 (increase of 1.36 FTE). This includes the addition of a 0.57 FTE Shuttle Driver fully funded from auxiliary wages and a 0.60 FTE Library Assistant for phasing in of services as a result of adding the Langford Heritage Branch. The remaining increase of 0.19 FTE is a result of positional changes upon retirements. The total increase of 1.36 FTE is fully funded through a combination of part-time staff budget reductions and salary reductions as a result of positional changes.
Part-time wages have increased by the estimated wage increase only. This budget includes employee benefit costs and payroll withholding costs such as EI and CPP. Total benefits are estimated to increase by $172,000. $65,000 of this increase is due to the increased salary base from a wage increase. The balance of $107,000 is a result of increases in BC medical, extended health, and pension, and an increase in the auxiliary pay in lieu of benefits from 13% to 14% (effective in 2016). This brings the total estimated rate of benefits and withholding costs up from 23.5% to 24.5% of total salaries and wages.
¹ 2016 Budget report total FTE’s as 144.09. It excluded 2.01 regularized auxiliary employees in error.
7 – Amortization (Increase $34,000)
This is the estimated amortization expense for tangible capital assets, in accordance with the Board’s Tangible Capital Asset policy. Since this is an unfunded expense, it is added back to the budgeted annual surplus.
8 – Supplies and Services, Building Occupancy and Other (Combined Decrease $6,981)
| Supplies and services | $74,176 |
| Building occupancy | (71,483) |
| Other expenses | (9,674) |
| Total | ($6,981) |
The net decrease is explained as follows:
| Office space lease ended | ($66,674) | On May 31, 2017, the lease for office space ends – personnel located at 747 Fort Street will move into Central Branch – see further explanation below |
| Books for Babies program budget added | 20,000 | Funded by grant revenue; nil impact on municipal contributions |
| One-time network connection | 8,333 | Final costs for office space lease ending May 31, 2017 |
| Branch start-up cost increase | 11,239 | James Bay branch funded by City of Victoria; nil impact on municipal contributions |
| Software licensing increase | 10,000 | Offset by reduction in Hardware as a result of increased virtualization and changes in IT service model for efficiency and effectiveness of service delivery |
| Marketing research for fund development | 4,000 | Funded by donation reserves (Note 10); nil impact on municipal contributions; see explanation below |
| Balance | 6,121 | Explanation below |
| Total | ($6,981) |
The three year lease of office space at 747 Fort Street allowed for the relocation of 17 personnel in the HR, Finance and IT departments, as well as the library’s IT servers, from the Central Branch. The lease met the goals of the Facilities Plan and mitigated risks related to the server room while housed at the Central Branch that resulted in a critical incident in 2013 involving the air cooling system. The move of personnel from the Central Branch to 747 Fort also increased the amount of branch space for public use. A more permanent and secure location has now been found for the library’s IT servers at the University of Victoria. In order to reduce the budget, the office lease will not be renewed and the 17 personnel will be relocated back to the Central Branch, which is the most viable location on a short-term basis. There will be some changes to storage, staffing and service spaces at the branch to accommodate these staff. However, there will be no impact on public service operations.
The market research budget included is to be funded from donation reserves. These funds will be used to gather demographic information about the communities we serve. The research would help us to create targeted marketing materials – up to and including a direct mail campaign – to generate financial support from new donors. A secondary purpose will be to analyze the research and to identify areas of the community that would benefit from library outreach and awareness.
The balance of the increase in the amount of $6,121 is considered reasonable as it is the net result of adding necessary new costs and factoring in savings from various budgets, such as insurance, fuel and phone services. The new costs allow for automated materials handling and vending equipment maintenance costs increased as we add new branches, additional annualized costs for the Langford Heritage Branch (from 9 months in 2016 to a full year), utilities rate increases, a GVLRA fee increase, space lease at the University to provide a secure location for our IT servers, the administrative portion (28%) of short-term security services required at the Central Branch, and hosting fees for replacement of end-of-life equipment at branches to monitor the number of visitors.
9 – Capital Expenditures (Decrease $39,917)
| Hardware | $(9,850) | $7,000 budget moved to Supplies and Services category; $2,850 reduction in United Way funded DigiLab project |
| Vehicles | (43,605) | One-time purchase in 2016 of Outreach Literacy Vehicle (OLiVe) funded by grants and donations; nil impact on municipal contributions |
All other budget variances relate to new branch start-up capital costs, as mentioned in Note 2.
10 – Transfers to/(from) Reserve Funds (Net Transfer To Reserves $30,175)
Unrestricted Donations - $18,175 for Development Assistant – One-time funding in 2015 and 2016 to fund a temporary Development Assistant position.
Unrestricted Donations - $(4,000) for marketing research in 2017 – refer to Note 8 for more information.
Contingency Reserve - $16,000 - As a result of a one-time pension liability in the 2015 fiscal year, the contingency fund was depleted to a zero balance in 2016 in order to replenish a negative balance in the operating fund. Board policy requires that the contingency reserve target 1% of total operating budget within five years. This increased annual contribution to the contingency reserve from $20,000 to $36,000 will replenish the reserve within the time period mandated by the policy, with no further annual increases in subsequent years.
11 – Transfers to/(from) Accumulated Surplus (Reduction in transfers from surplus $109,475)
One-time transfers from accumulated surplus in 2016 are removed in 2017:
| Personnel contingency funding | $29,475 |
| Office space funding | 80,000 |
| 109,475 |
12 – Debt Repayments (Reduction $2,488)
Debt repayments budgeted in 2017 are as follows:
- Microfilm and scanner – capital lease: $ 4,306 (final year)
- Shuttle vehicle loan – MFA: 17,674 (loan maturity 2018)
- Total: $21,980