This site is in beta — data may be incomplete and features are still being added.
Advisory Committee/Documents/Attachment B: UBC Stats for Density
Appendix

Attachment B: UBC Stats for Density

April 25, 2017Page 81 section

A density comparison chart comparing Town of View Royal and PIPS calculations with UBC standards.

PIPS calculation: 473 units on 3.56 ha = 137.8 Units/haTown of View Royal calculation: 473 units on 6.3 ha = 75.0 Units/ha

HOUSING DENSITY SCALE

IN DWELLING UNITS PER HECTARE
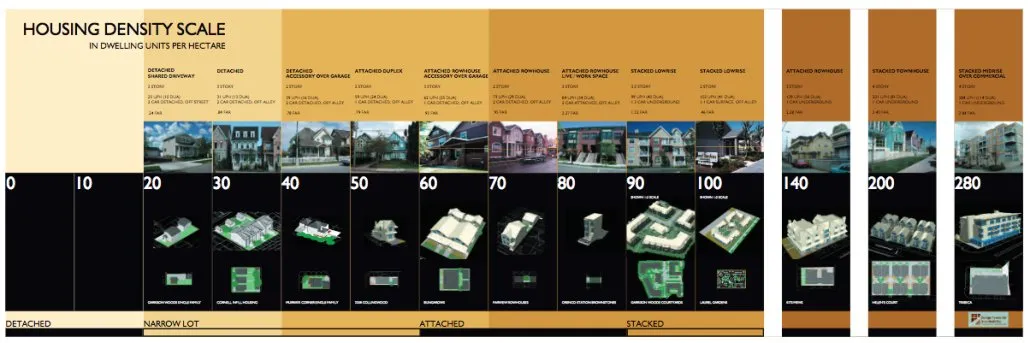
Horizontal chart showing a housing density scale from 0 to 280 dwelling units per hectare with corresponding building types

UBC Stats for Density

  • Medium - 25 - 50 U/ha
  • High - 50 - 80 U/ha

Town of View Royal

Using 75.0 Units per Hectare
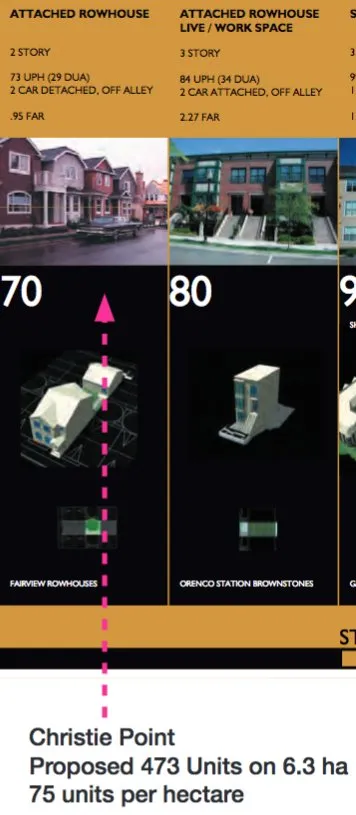
Detailed comparison panels for density levels 70 and 80, showing attached rowhouse and live/work space specifications

Christie Point Proposed 473 Units on 6.3 ha 75 units per hectare


PIPS

Using 137.8 Units / ha - FSR 2.06
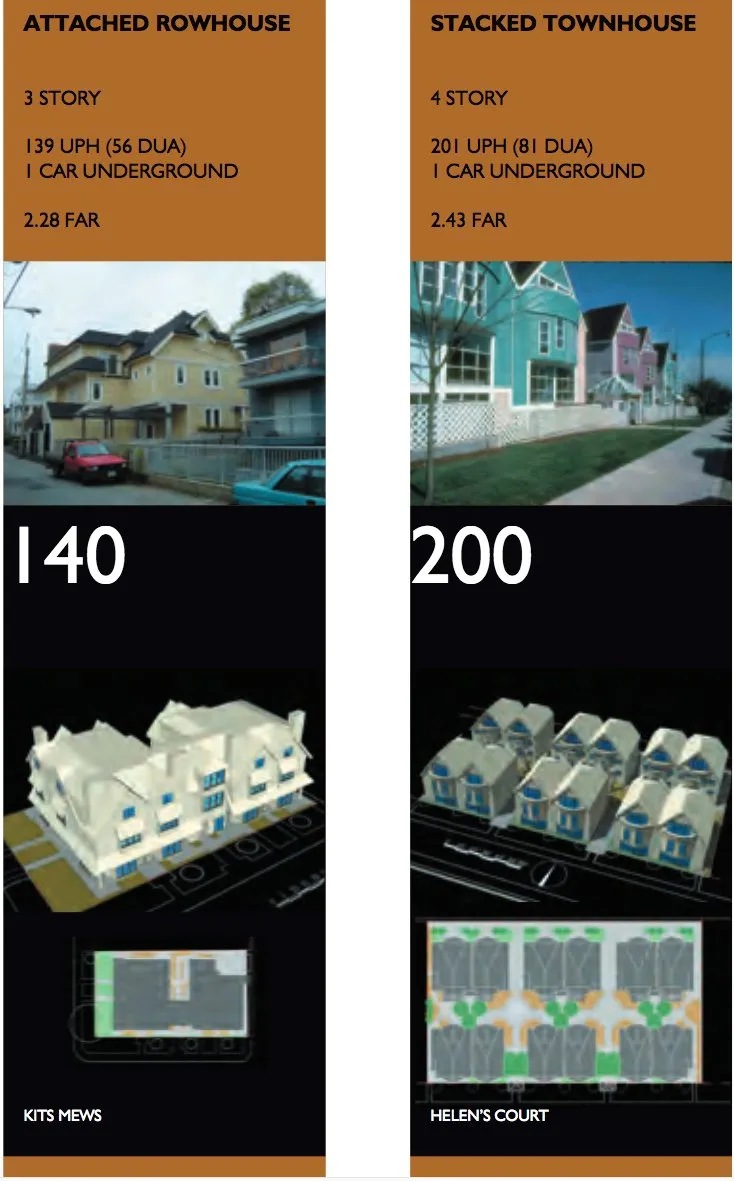
Detailed comparison panels for density levels 140 and 200, showing attached rowhouse and stacked townhouse specifications

PIPS Using 473 Units on 3.56 ha = 137.8 Units / ha

Page 8
Extracted from: 2017 04 25 Joint Advisory Committee Meeting Agenda - Agenda - Pdf