Attachment C: Table 1. Summary data adapted from Desbonnet et al.
Technical table regarding the removal effectiveness of pollutants at different buffer widths.
Attachment C
that concentrate rainfall and snowmelt from impervious surfaces associated with human residential and commercial development and transportation infrastructure. Washington State Department of Ecology, United States Environmental Protection Agency, Puget Sound Partnership Publication Number 07-10-079 (http://www.ecy.wa.gov/pubs/0710079.pdf ); and waste water entering Puget Sound from municipal and industrial facilities. The panel did not address nutrient or pathogens from agricultural sources or residential septic systems.
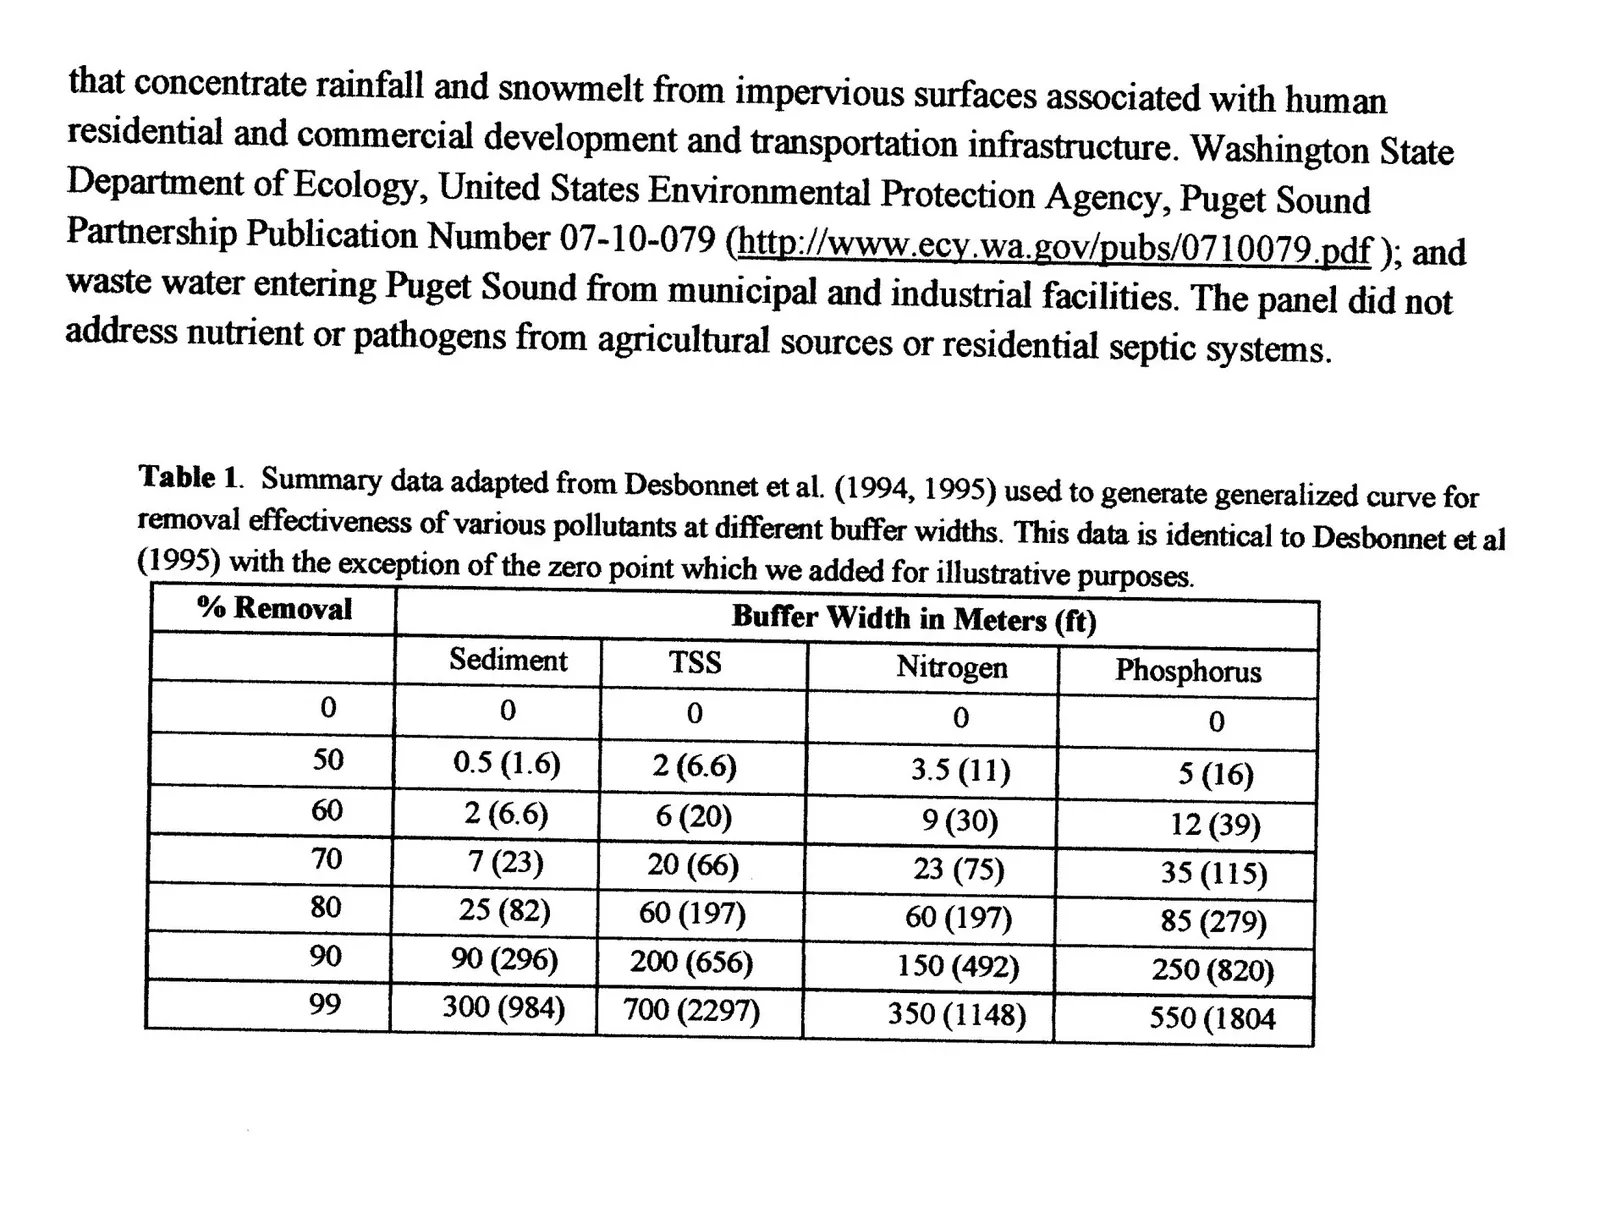
Table 1. Summary data adapted from Desbonnet et al. (1994, 1995) used to generate generalized curve for removal effectiveness of various pollutants at different buffer widths. This data is identical to Desbonnet et al (1995) with the exception of the zero point which we added for illustrative purposes.
| % Removal | Buffer Width in Meters (ft): Sediment | Buffer Width in Meters (ft): TSS * | Buffer Width in Meters (ft): Nitrogen | Buffer Width in Meters (ft): Phosphorus |
|---|---|---|---|---|
| 0 | 0 | 0 | 0 | 0 |
| 50 | 0.5 (1.6) | 2 (6.6) | 3.5 (11) | 5 (16) |
| 60 | 2 (6.6) | 6 (20) | 9 (30) | 12 (39) |
| 70 | 7 (23) | 20 (66) | 23 (75) | 35 (115) |
| 80 | 25 (82) | 60 (197) | 60 (197) | 85 (279) |
| 90 | 90 (296) | 200 (656) | 150 (492) | 250 (820) |
| 99 | 300 (984) | 700 (2297) | 350 (1148) | 550 (1804) |
* Total suspended solids
Table Reference - Protection of Marine Riparian Functions in Puget Sound, WA