Christie Point | Transportation Impact Assessment
A technical report by Bunt & Associates evaluating the transportation impacts of the proposed 473-unit Christie Point redevelopment.
2.2.4 Transit Network
Transit is available with stops on Island Highway approximately 500m to 800m from Christie Point. The westbound and eastbound bus stops on Island Highway are located between Shoreline Drive and the existing Island Highway pedestrian crossings; hence approximately 100m is added to the walking distance for Shoreline Drive transit passengers. The site is serviced with BC Transit route #14 which is a frequent route with 15 minute or less headways. The #14 route connects the site to Victoria General Hospital, Victoria Downtown, University of Victoria and connecting routes.
2.3 Local Area Travel Characteristics
The following describes current travel mode usage and outlines View Royal’s relevant Transportation policies.
2.3.1 Travel Mode Splits
According to the 2011 CRD Origin and Destination Household Travel Survey, when View Royal residents were travelling within the district (area district is defined as View Royal plus Esquimalt Nation and Songhees First Nation) during the PM Peak Hour, 44% of respondents drove, 12% were passengers, 41% walked and 2% cycled. When travelling to View Royal from another district, 68% drove, 16% were passengers, 10% took transit, 2% cycled and 3% walked. Within the local area the data shows a high propensity for walk trips but vehicle trips are still predominant for longer trips.
2.3.2 Transportation Modes Policies & Plans
Christie Point is part of View Royal’s Craigflower District. As part of View Royal’s September 2011 Official Community Plan (OCP) the objective for the Craigflower neighbourhood is to:
Promote new development and public improvements in the Craigflower Neighbourhood to provide housing options, enhance trail connectivity and shoreline access, and increase the customer base for local businesses.
Specifically for Christie Point the OCP states:
Encourage any future redevelopment at Christie Point to include a mix of medium density residential and park uses. Development at this location should be carefully reviewed to ensure that environmentally sensitive areas are protected, potential sea-level rise issues are addressed, and safe and efficient road access from the Island Highway is maintained.
The addition of residential density at this location which has strong non-vehicle transportation mode options is considered to be in line with area policy and progressive step towards the area’s sustainability goals.
2.4 Existing Peak Hour Traffic Volumes
Bunt collected Weekday PM peak period traffic, cyclist and pedestrian volumes at the two study area intersections and also at the entry/exit to the Christie Point complex on Thursday June 16, 2016 from 2:30 pm to 6:00 pm. The counts were scheduled to start early to ensure the afternoon period associated with peak pick up operations at the nearby Shoreline Middle School were included, as well as the peak of adjacent street traffic which typically occurs later in the afternoon.
Based on the data collected, the observed peak hour of traffic over the entire survey period was earlier than typical, at 2:45 PM to 3:45 PM. The resulting early afternoon peak hour traffic volumes are illustrated on Exhibit 2.2.
Note that Bunt’s data indicated that the afternoon peak period of demand on the Island Highway extended atypically for the full period of our count program, from 2:30 PM to 6 PM due to an extended period of demand on the Island Highway.
The traffic generated from the existing Christie Point development is shown in Figure 1 below. As shown the Christie Point development had a consistent peak period throughout the duration of the count program. The 2:45 to 3:45 PM peak hour of adjacent road traffic was also the peak hour for Christie Point trip generation. The combined one hour volumes are shown in Figure 2.
Figure 1: Existing (2016) Christie Point 15 Minute Internal Trip Generation

Figure 2: Existing (2016) Christie Point One Hour Internal Trip Generation

The existing site with 161 2 bedroom residential units generates approximately 45 two-way vehicle trips during the Weekday PM peak hour. This trip generation rate is considerably lower than typical North American Institute of Transportation Engineers (ITE) Trip Generation Manual 9th Edition average rates for the existing land use. This difference between observed trip rates and ITE rates is presumed to be due to the demographics (presumably high percentage of retirees or work-at-home residents) and location of the site in regards to its proximity to transit and walkable amenities.
Given the residential land use of the site, the site generated trips are not considered to be subject to substantial seasonal variation therefore seasonal adjustments were not applied for this analysis.
2.5 Existing Traffic Operations
2.5.1 Analysis Method
A Synchro traffic operations model (Weekday PM peak hour) was prepared covering the Study Area, which included the following intersections:
- Island Highway & Shoreline Drive (unsignalized); and,
- Island Highway & Admirals Road (signalized, advanced left turn phases for north, west and east bound vehicles).
Traffic operations analysis was conducted for the two Study Area intersections to assess existing traffic conditions for the Weekday PM peak hour. Synchro 9.0 software was used for the analysis, based on the procedures outlined in the 2000 Highway Capacity Manual (HCM).
Synchro reports performance criteria including a measure of the intersection traffic volume to capacity (v/c) ratio, and a traffic delay based Level of Service (LOS) measure at each study intersection. A v/c ratio less than 0.90 generally indicates acceptable traffic conditions, with sufficient capacity to accommodate demands; a v/c ratio between 0.90 and 1.00 indicates a near-capacity traffic condition with anticipated delays and vehicle queuing. The LOS rating is based on average vehicle delay and ranges from “A”, which represents minimal delay conditions; to “F”, which represents congestion and/ or considerable delays. For urban areas, a LOS of “E” or better and a V/C ratio of 0.90 or less generally represent acceptable traffic performance.
Existing pedestrian and cyclist volumes were coded into the Synchro model to reflect the traffic operations effects of both pedestrian and cyclist crossings.
Signal timing plans for the signalized Island Highway and Admirals Road intersection were provided by the Town of View Royal and coded into the model.
2.5.2 Traffic Analysis Time Periods
2.5.3 Existing Condition Findings
Exhibit 2.3 summarizes the existing (2016) traffic operations of the Study Area intersections during the Weekday PM peak hour period. The v/c (volume to capacity) ratio and LOS (average delay) are presented for each lane group, as well as LOS for the overall intersection (our Synchro model outputs can be made available to Town staff). Synchro outputs are provided in Appendix A.
As evident from Exhibit 2.3, the Study Area intersections currently operate at or near capacity with operational issues found at both intersections. The key operational issues are described and illustrated in Exhibit 2.4. It is noted that as Bunt’s traffic counts clearly captured “serviced” and not “demand” volumes, the delays and Levels of Service reported herein are likely better than currently experienced.
At the Admirals Road and Island Highway intersection multiple movements are found to operate with LOS D delays. Direct observations in the field confirmed consistent merging issues on the intersections west leg, as three high demand movements feed into two receiving lanes just west of the intersection, which in turn must merge into one lane prior to Shoreline Drive, as the outside westbound curb lane drops at Shoreline Drive. We believe the merging of two westbound Island Highway lanes into one lane impacts the actual operation of the Island Highway & Admirals Road intersection.
At the Island Highway and Shoreline Drive intersection southbound vehicles on Shoreline Drive turning left were predicted by the Synchro software to experience LOS F, with extremely high delays predicted for the southbound left turners. Drivers wishing to turn left from Shoreline Drive onto Island Highway were observed to only be able to turn onto Island Highway when slow moving drivers in westbound vehicles traveling on Island Highway stopped to permit this movement as a courtesy. Even though there is a nearby traffic signal, which would typically create some gaps in traffic flow, because of the two lane to one lane westbound merge operation the gaps afforded by the nearby signal were not evident at Shoreline Drive. The flow of westbound vehicles on Island Highway during the PM peak period at Shoreline Drive was observed to be very slow and nearly constant with no gaps, resulting in high southbound left turn delays when westbound drivers did not stop to permit turns.
Forty-seven (47) vehicles were observed to turn left (from Shoreline Drive to Island Highway) during the PM peak hour. Of these 47 vehicles only 7 are estimated to be generated by the existing 161 Christie Point units. Bunt estimated this split based on the observed 45 total two way peak hour observed Christie Point site trips at the entrance to the site on Craigowan Road, of which 32 were inbound and 13 were outbound. Of the 13 outbound vehicles, seven were presumed to turn left at Island Highway based on observed distribution patterns. The majority of the remaining approximate 40 southbound left turning vehicles are assumed to be a combination of Shoreline Secondary School pick up traffic, and traffic generated by the other residences on Shoreline Drive and Craigowan Road.
2.6 Mitigation Existing Conditions
2.6.1 Island Highway and Admirals Road
The key westbound operational challenge at this intersection is related to the high volumes of vehicles travelling west, feeding the westbound receiving lanes from the westbound through, northbound left and southbound right turning movements. The queue created by the two lane to one lane merge point/lane drop at Shoreline Drive essentially backs up into this intersection. Extending the two westbound lanes on Island Highway through the Shoreline Drive intersection will help alleviate spillback into the intersection, however, without signal control, provision of two lanes westbound on Island Highway through the Shoreline intersection may increase westbound travel speeds in this section and make the southbound left turns from Shoreline Drive more difficult. Less westbound drivers, we expect, would have the courtesy to stop for southbound left turners if there were two westbound lanes and faster vehicle speeds were possible.
2.6.2 Island Highway and Shoreline Drive
The critical operational issue at this intersection is the difficulty for southbound drivers to turn onto the Island Highway and in particular, to turn left onto the Island Highway. One mitigation approach to this challenge is to consider alternative traffic control at this intersection.
Install Roundabout
A roundabout configuration for this intersection was examined but is not considered appropriate for the Island Highway and Shoreline Drive intersection for various reasons:
- Three leg intersection; roundabouts more typical for intersections with four or more intersection legs,
- Two of the three legs have substantially higher volumes than the third Shoreline Drive intersection,
- Larger intersection footprint.
Modeling by Bunt of a roundabout at this location indicated continued high delays for Shoreline Drive drivers, who would have considerable difficulty entering the circulatory roadway on the roundabout due to the very high demand volumes created by the westbound Island Highway through traffic.
Install Half Signal
A half traffic signal at the Island Highway and Shoreline Drive intersection could be installed that just controlled westbound Island Highway traffic to allow southbound to eastbound left turners to turn into the protected eastbound lane. This signal would be activated by detectors on the Shoreline Drive approach to Island Highway and could be set back from the stop bar, so that the left turn phase would be called a minimum number of times.
As indicated in Exhibit 2.5 (using existing traffic volumes) the introduction of a Half Signal at Island Highway and Shoreline Drive is shown to alleviate Shoreline delays. However, there is considerable negative impact is to the westbound Island Highway movement which has only one through lane and is expected to experience a V/C ratio greatly in excess of 1.0.
A Half Signal and its increased westbound vehicle delays will result in further spillback into the Island Highway & Admirals Road intersection. Evaluating the impact of these additional delay is not possible using a “meso-scopic” software tool such as Synchro/ SimTraffic as it is not capable of properly modelling the westbound two lane to one lane merge point. Currently the roadway segment between Shoreline Drive and Admirals Road on Island Highway is at capacity with slow moving vehicles navigating the merge from two travel lanes into one travel lane. This merge delay was observed to impact operations at the Island Highway and Admirals Road intersection. It is Bunt’s view that adding any level of further impediment to this movement will certainly have further spillback impacts.
Install Full Traffic Signal with Provision for Pedestrians
Based on Transportation Association of Canada (TAC) signal warrant analysis as provided in Appendix B, a traffic signal is not warranted at this location based on traffic volumes alone, however, with just 10 pedestrians attracted to this location, a signal would be warranted. Such a modest increase in pedestrian demand is not considered unrealistic particularly with the redevelopment of Christie Point, the presence of the school and the shopping centre to the south.
The Town of View Royal has previously expressed a hesitance to introduce a traffic signal at this intersection due to its close proximity to the traffic signal on Island Highway at Admirals Road approximately 150m to the east. However, to allow densification of the Christie Point site as contemplated by the Town and site developer, as well as of the overall neighbourhood, it is Bunt’s view that signalization should be considered to ensure safe movements are possible to/from the only neighbourhood access to the Island Highway. Signal coordination with the Admirals signal could be employed to minimize, as far as possible, queue overflow issues caused by the close spacing of the two signals.
However, signalization should only be considered along with the development of two westbound through lanes at Shoreline Drive, and a shift of the two lane to one lane merge point further to the west. Exhibit 2.6 illustrates the potential reconfiguration of this intersection, which will require the removal of the protected receiving lane for the southbound to eastbound left turn lane, and reconfiguration of the westbound and eastbound through travel lanes, and the eastbound bicycle lane.
With a full traffic signal, protected pedestrian crossings could be provided via push buttons. This of course requires stopping both eastbound and westbound Island highway traffic. Providing for pedestrians would increase the stop time for Island Highway traffic (approximately 14 seconds versus 11 seconds). This signal could operate in 3 basic modes:
- Rests on green for Island Highway traffic in both westbound and eastbound directions,
- Stop westbound traffic when southbound Shoreline vehicles activate the signal,
- Stop westbound and eastbound traffic when signal is activated by a pedestrian.
Signalization would significantly improve operating conditions for southbound Shoreline Drive, and shifting the two to one lane westbound merge point to the west will result in reduced afternoon operational impacts on the critical Island Highway & Admirals Road intersection in the Study Area.
Retain Existing Configuration
The existing configuration of the Shoreline Drive intersection may in fact be the most cost efficient, but the operations of the critical southbound left turn movement from Shoreline Drive to Island Highway would continue to be largely dependent on westbound Island Highway vehicles permitting the Shoreline Drive southbound to eastbound left movement. This behavior adaptation is not possible to model with Synchro. We do not advocate reliance on an unpredictable behavior action that runs counter to provided traffic control.
Exhibit 2.3: Christie Point Existing (2016) Traffic Performance

Exhibit 2.4: Existing Traffic Operation Comments

Exhibit 2.5: Existing Operations with Shoreline Traffic Signal

Exhibit 2.6: Conceptual Road Design - Island Highway and Shoreline Drive
3. TRAFFIC IMPACT ANALYSIS
The following Site Traffic Impact Analysis examines the anticipated traffic impact of the proposed development. This section is structured as follows:
- Proposed development;
- Peak hour vehicle trip generation estimates;
- Total condition traffic operations (with proposed development); and,
- Mitigation options for Post-Development road network.
3.1 Proposed Development
The proposed Christie Point development consists of 473 rental residential units. The size of the units and unit mix is expected to be consistent with the existing site.
As shown in the site plan illustrated in Exhibit 3.1, the access to the site will remain in its current location. The internal site roadway will be improved to include a sidewalk adjacent to the roadway.
Exhibit 3.1: Site Plan

3.2 Christie Point Development Generated Traffic
3.2.1 Existing Site Trip Generation
The existing site with 161 residential units (2-bedroom plus units) currently generates approximately 45 two-way vehicle trips during the Weekday PM peak hour. This rate was the highest during the adjacent street peak period and also for the existing Christie Point development. The trip rate remained at this level from approximately 2:30 PM to 5:00 PM. This trip generation rate is lower than typical North American Institute of Transportation Engineers (ITE) Trip Generation Manual 9th Edition rates. The ITE trip rates applied to the existing Christie Point development are shown below in Table 3.2.
Table 3.2: Vehicle Trip Generation Rates– Observed Versus ITE Rates
| LANE USE | SOURCE | VARIABLE | ITE TRIP RATES (In/Out/Total) | TOTAL TRIPS (In/Out/Total) |
|---|---|---|---|---|
| Low-Rise Apartment | ITE 221 | 161 Units | 0.37 / 0.21 / 0.58 | 59 / 34 / 93 |
| Mid-Rise Apartments | ITE 223 | 161 Units | 0.23 / 0.16 / 0.39 | 37 / 26 / 63 |
| Residential Condo/Townhouse | ITE 230 | 161 Units | 0.35 / 0.17 / 0.52 | 57 / 27 / 84 |
| Observed | Observed | 161 Units | 0.20 / 0.08 / 0.28 | 32 / 13 / 45 |
* ITE Land Use 224 Rental Townhouse was not used as the sample size was just one building.
The ITE Trip Generation Manual is the industry-wide standard in North America for assessing vehicle trip generation for new developments. However, its focus is primarily on non-rental suburban sites where the automobile is the dominant transportation mode, and this is acknowledged on page 80 in the ITE Handbook as follows:
“The focus of the data presented throughout the trip generation is on sites in suburban settings with limited or no transit service and free parking” and that site selection is based on “limited ability for pedestrians to walk into the site from nearby parcels”.
Given that this is not the case for the proposed rental development and considering the proposed development is consistent in terms of proposed land use and expected demographics we have calculated trip rates based on existing trip rate generation rates.
The currently proposed 473 unit development is therefore expected to generate approximately 132 total two-way trips in the Weekday PM peak hour (94 inbound and 38 outbound). The net new traffic is 65 vehicles inbound and 26 vehicles outbound per Weekday PM peak hour. To be conservative our analysis retained trip generation estimates based on a previously proposed larger 517 unit site plan (71 inbound and 29 outbound trips).
3.2.2 Trip Distribution and Assignment
The distribution of the future Christie Point site-generated traffic was assigned to the adjacent road network based on existing traffic patterns. For example, on Shoreline Drive at its intersection with Island Highway 47% of the exiting traffic traveled to the west by turning right and 53% turned left onto Island Highway eastbound. The model does not account for motorist behaviour adaption, such as detouring to avoid high delay movements.
Bunt’s modelled ‘Traffic Flow Diagrams’ are provided in Appendix A.
3.3 Future Total Traffic Conditions
Total future traffic consists of the proposed development site-generated traffic volumes added to the forecasted background traffic volumes. Future background volumes were calculated using a 1.5% annual growth rate. Our study assumed 2018 for our “Opening day” model. Future calculated traffic volumes are shown in Appendix A.
Exhibit 3.2 and 3.3 present the Synchro forecasted future Background 2028 and Total 2028 traffic conditions for the Weekday PM peak hour respectively. As expected, the applied approximate 28% growth in volumes at the Study Area intersections results in significant operational issues. However, the future volumes are overstated as the network in its current configuration does not have capacity to add such an increase in vehicles to the network. Instead increased volumes are expected to spread out from the peak hour resulting in a longer period of peak hour conditions. As such our modeling of potential mitigation scenarios presented in Exhibit 3.4 and 3.5 layers development traffic onto 2016 existing volumes (analysis discussed in Section 3.5.2) as we believe these volume scenarios are more in line with probable future traffic conditions.
Comparison of Exhibits 3.2 and 3.3 does however importantly illustrate the relatively modest net impact of the proposed development from a traffic capacity perspective. Key operation issues encountered in the future horizon year model scenarios are discussed for each intersection below.
3.3.1 Island Highway and Admirals Road Intersection
The proposed development has little marginal impact to the Island Highway and Admirals Road intersection. This is due to the considerable traffic flows already at all four legs of the intersection. Christie Point development traffic is expected to add an approximate 1.8% more vehicle trips to this intersection. This magnitude of increase is considered negligible.
As discussed prior, this intersection would likely benefit from the retention of two westbound lanes west of the intersection as this merge appears to be responsible for significant spill back into the intersection.
3.3.2 Island Highway & Shoreline Drive
Long delays for Shoreline Drive vehicles will continue into future years. The increase in delay will be related mostly to the increase in development traffic as expected increase in Island Highway volumes will be small because of overall network capacity constraints. The impact of the proposed Christie Point is an increase of vehicles on Shoreline Drive which will encounter the significant southbound to eastbound left turn delay. Our site trip assignment results in an estimate of approximately 15 southbound to eastbound left turning vehicles being added to the intersection during the PM peak hour (when opposing westbound Island Highway volume are highest) and approximately 35 trips per peak hour during the AM peak hour period when a higher percentage of Christie Point vehicles exit the site (but coincides with reduced westbound Island Highway traffic volumes).
3.4 SimTraffic Analysis
The adjacent road network was also examined using the SimTraffic software package. SimTraffic is a more robust queue analysis tool as it examines the study area road network as a whole by taking into account gaps in traffic created by nearby intersections and traffic signals rather than examining each intersection in isolation as the Synchro traffic model does.
The SimTraffic software generally indicates the same operational issues as identified by Synchro. Despite typically being used for network analysis (rather than individual intersections) it did not in our opinion fully account for described Island Highway merge issues.
3.5 Site Impact Mitigation for Total Traffic Scenarios
3.5.1 Island Highway and Admirals Road
The key operational constraint appears to be the high volumes of vehicles traveling or wishing to travel west. This is made worse by the westbound direction on Island Highway merging from two to one lane with its lane drop at Shoreline Drive. Extending the two-lane profile of Island Highway away from its intersection with Admirals will help alleviate spillback into the intersection.
3.5.2 Island Highway and Shoreline Drive
The intersection’s southbound to westbound right turn movement continues to operate within capacity. Various mitigation measures for lowering southbound delays were considered as discussed in Section 2.6.2.
According to TAC’s Traffic Signal Warrant (Appendix B) a signal is not warranted regardless of the proposed Christie Point development volumes, however if pedestrian crossings (an assumed latent demand) are added to the volume inputs a signal becomes warranted.
The introduction of a traffic signal at Island Highway & Shoreline Drive without the two lane extension is shown (Exhibit 3.5) to alleviate southbound Shoreline Drive delay, but results in a westbound Island Highway volume / capacity ratio of 1.03, suggesting this westbound movement will be over capacity.
As shown in Exhibit 3.6 the extension of two westbound Island Highway through lanes through Shoreline Drive results in improved operations that are within design criteria.
Exhibit 3.2: Christie Point Background (2028) Traffic Performance
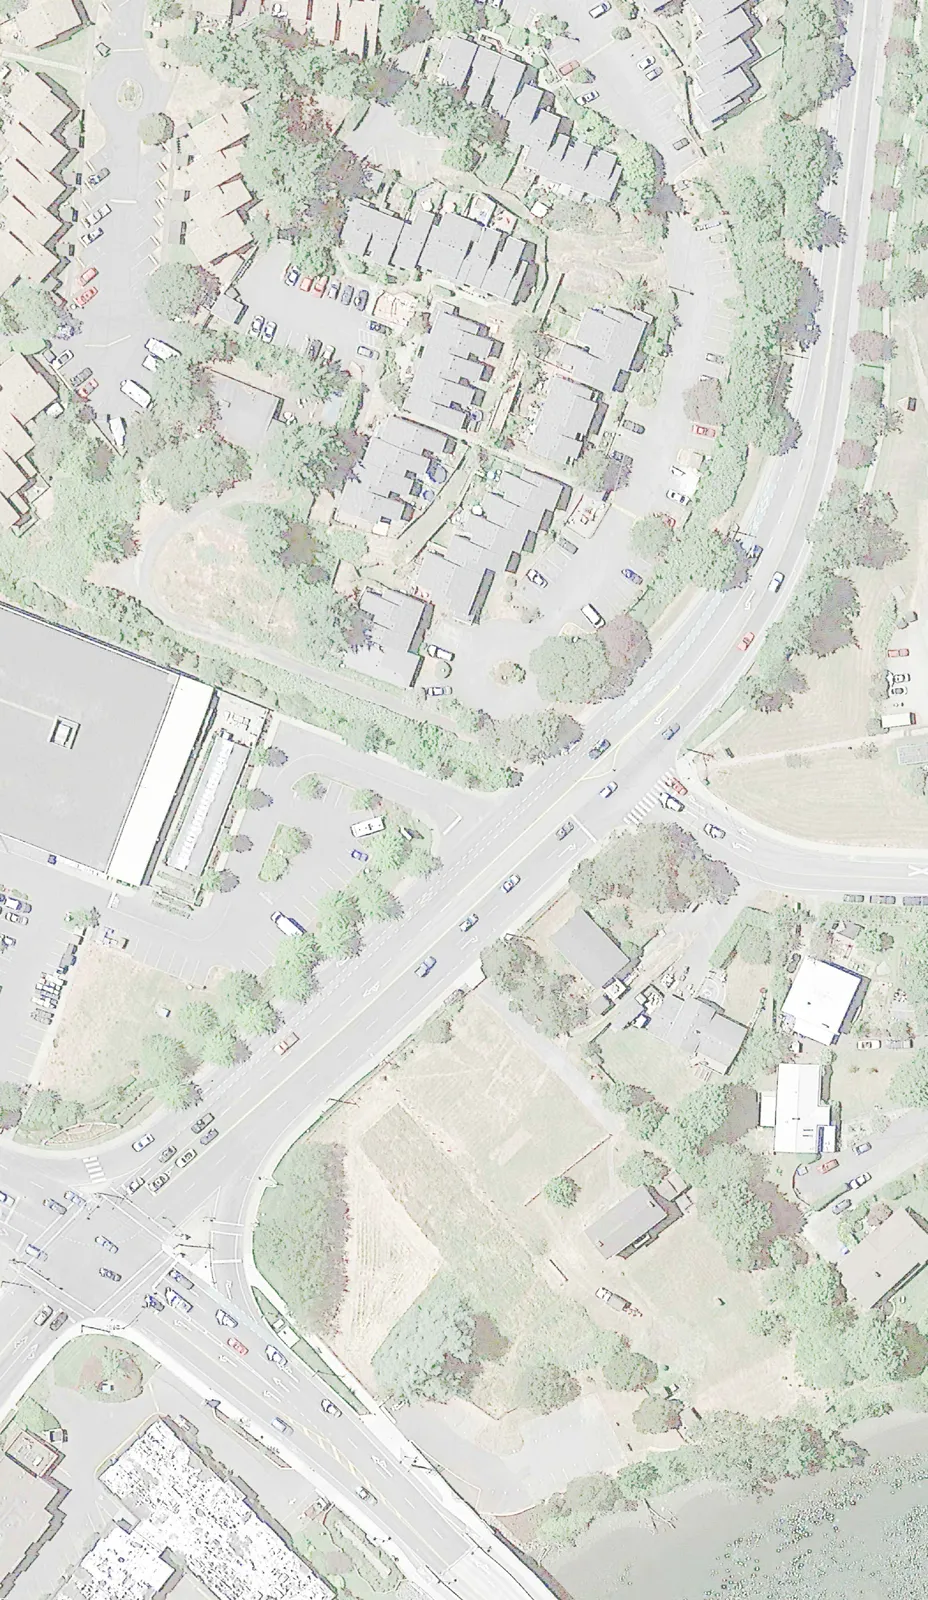
Exhibit 3.3: Christie Point Total (2028) Traffic Performance - No Mitigation

Exhibit 3.4: Christie Point Total (Dev. + Existing Vol.) Performance - No Mitigation

Exhibit 3.5: Christie Point Total (Dev. + Existing Vol.) Performance - Traffic Signal at Island Highway and Shoreline Drive

Exhibit 3.6: Christie Point Total Performance - Traffic Signal and Extension of Two Westbound Island Highway Lanes
The primary benefit of introducing a traffic signal at the Island Highway and Shoreline Drive intersection is an improvement for Shoreline Drive southbound delays. Another positive impact of a Traffic Signal introduction is the potential inclusion of a pedestrian activated crossing of Island Highway. It is noted that the nearest crossing points are 150 m to the east at the Admirals intersection or 250m to the west where there is an overhead mid-block crossing.
In exchange for these traffic signal benefits, further westbound Island Highway delays are anticipated. As the Shoreline Drive leg of the intersection has much lower volumes than Island Highway this additional delay is expected to delay a greater number of vehicles.
It is recommended that the Town of View Royal introduce a full traffic signal with inclusion of a pedestrian crossing of Island Highway in combination with the extension of the two westbound through lanes on Island Highway. The merge from two to one westbound Island Highway through lane should be moved at minimum 100m west of the Shoreline Drive access.
4. PARKING
4.1 Existing Parking Supply and Demand
4.1.1 Existing On-Site Vehicle Parking Supply
There are currently 265 on-site vehicle parking spaces, 23 of these are visitor spaces. The remaining 242 resident spaces equates to the provision of 1.5 spaces per unit. The 23 visitor spaces equates to approximately 0.14 visitor spaces per unit.
4.1.2 Existing On-Site Vehicle Parking Demand
Of the existing 242 resident spaces, 213 are currently occupied by residents. This equates to an average demand rate of 1.32 spaces per unit.
4.2 Development Vehicle Parking Demand
4.2.1 Town of View Royal Bylaw Vehicle Parking Requirements
View Royal’s Off-Street Parking Bylaw Schedule A suggests a minimum residential vehicle parking provision of 1.5 parking spaces per dwelling unit for row houses, townhouses and two-bedroom apartments. For three bedroom apartments the minimum rate is 2 spaces per unit.
If the 1.5 spaces per unit rate is applied to the proposed 473 unit Christie Point development this would result in the requirement of 710 parking spaces.
These bylaw parking requirements do not take into account the specific location of the development site. The site’s strong multi-modal connections will support moving towards a lower resident parking supply rate. A reduced parking supply will also support View Royal’s goals of shifting current residents from private automobile to other more sustainable transportation modes.
4.2.2 Rental Multi-Family Residential
Tenure (strata vs. Rental) is significant factor that influences auto ownership. All residential units at Christie Point will be rental units. A wide range of research has suggested renting residents have lower vehicle ownership per household rates when compared to market or strata tenure.
A key finding in Metro Vancouver’s 2012 Apartment Parking Study was that rental residential buildings have significantly lower parking demand over strata buildings. This is illustrated in the Figure shown below.
Figure 1: Rental Parking Demand Versus Strata

Bunt has also conducted research on 13 rental residential buildings near Victoria’s downtown as part of a 2012 Parking Demand Study in James Bay. We believe the Christie Point and James Bay area are a reasonable comparison as both are in walkable locations with various transportation options. This James Bay Study identified vehicle ownership rates consistently lower than 1 space per unit with an average rate of 0.66 spaces per unit.
In addition to resident parking demands, previous research conducted by Bunt together with the findings by others (e.g., Metro Vancouver Apartment Parking Study – 2012) has consistently identified a Visitor peak parking demand rate of 0.10 to 0.15 visitor parking spaces per residential unit.
We believe the proposed parking supply rate of 1.1 space per rental unit plus 0.15 Visitor spaces per unit to be appropriate for the Christie Point development context.
Table 4.1 presents the Christie Point proposed parking supplies compared to Bylaw requirements.
Table 4.1: Bylaw Required Vehicle Parking Supply versus Proposed On-Site Parking Supply
| LAND USE | DEVELOPMENT SIZE | BYLAW MIN. RATE (PER UNIT) | BYLAW REQ. MIN. PARKING SPACES | PROPOSED PARKING RATE | PROPOSED PARKING SPACES | VARIANCE FROM BYLAW |
|---|---|---|---|---|---|---|
| Residential Rental | 473 units | 1.5 spaces per unit | 710 | 1.1 spaces per unit | 520 | -190 |
| Residential Visitors | 473 units | Inclusive of residential rate | - | 0.15 per unit | 71 | +71 |
| TOTAL CHRISTIE POINT | 776 | - | 595 | -119 |
As shown in Table 4.1 the proposed parking supply is 119 spaces under the minimum parking supply requirement of the Town of View Royal Zoning Bylaw.
We believe the proposed total parking supply of 593 parking spaces (520 resident plus 71 additional Visitor spaces) as shown in Table 4.1 will provide good balance between the sustainable transportation objectives of the Town and this development while still ensuring the viability of the project and protecting against parking spillover impact into the adjacent roadways.
We recommend that the parking spaces be unbundled from the unit costs (rental of vehicle spaces separate from unit rentals). This will help reduce unit costs for residents who do not wish to not have a vehicle and will allow residents who desire more than one parking space the opportunity to rent more than one space. Parking pricing helps realize the true costs of parking spaces and is in itself a strong Transportation Demand Management strategy.
4.3 Bicycle Parking
The City’s bylaw requirement for bicycle parking spaces for an apartment, row house or townhouse is one ‘Class 1’space per unit and a ‘Class 2’ 6-space rack at each apartment entrance.
“Class 1” bicycle parking is a secure, weather-protected bicycle parking facility used to accommodate long-term parking, for residents or employees, usually within a room or covered, fenced area.
“Class 2” refers to a short-term visitor bicycle parking facility provided near a building entry in a well lit, preferably covered area, for example a bike rack at a building’s entrance.
The Christie Point development with 473 residential units would therefore require 473 ‘Class 1’ spaces along with a ‘Class 2’ 6-space rack at each building entrance.
The recently built E&N Rail Trail provides a substantial opportunity to increase the site’s cycling mode split.
To do this we recommend the site provide Class A and Class B bicycle parking beyond bylaw requirements.
The current site plan provides 1.1 Class 1 bicycle spaces for each unit, which is greater than the bylaw required supply and will be a critical component of the development’s Transportation Demand Management strategy. The site will also have at minimum one Class 2 bicycle rack at each building entry.
4.4 Parking Summary
- Our analysis suggests the proposed vehicle parking supply of 593 spaces for Christie Point will accommodate peak period demands for both residents and visitors.
- Christie Point proposes bicycle parking supplies that are in excess of minimum Bylaw requirements.
5. LOADING
Christie Point will be serviced predominately by garbage and recycling vehicles. The site will also need to be accessed by emergency vehicles with fire response vehicles being the largest vehicles.
Vehicle turning path analysis of the Christie Point site was conducted using AutoTURN software. Exhibit 5.1 illustrates the ability of garbage and recycling collection vehicles to access the buildings collection areas as well as the turnaround ability of a fire truck at the properties north end.
Exhibit 5.1: AutoTURN Turn Paths

6. TRANSPORTATION DEMAND MANAGEMENT
Transportation Demand Management seeks to decrease private vehicle use by promoting other more sustainable modes of transportation.
The following elements are proposed as part of the Transportation Demand Management (TDM) plan intended to further encourage the future residents of the Christie Point development to use alternative travel modes to the private automobile, i.e., walking, cycling and public transit trips.
6.1 Infrastructure & Site Design
To promote transit use the proposed development will ensure strong internal pedestrian routes that connect the entry of each building to the site’s access.
6.2 Information Brochure
Transportation Demand Management is about changing travel behaviour. A new address is an ideal opportunity to reshape travel patterns. Experience has shown the best results are achieved through promoting a positive message and involving residents and employees in the process as early as possible. This approach can be most successful when material is supplied prior to occupation, for instance, providing an Information Brochure for new residents.
Clear and simple messages such as cost savings and health benefits, along with practical information about local transit services, walking and cycle routes to key locations, carpooling and car-sharing services, can help encourage residents to use more sustainable transportation modes. The Information Brochure can be made available to all future residents within the development. This information can also be provided on community message boards located in the residence lobbies, and made available at residential strata meetings.
The Brochure should include:
- Map showing local cycling routes and connections to E&N Trail (can be obtained from Town of View Royal website);
- Map showing local transit routes (can be obtained from BC Transit website);
- Map showing amenities within a typical walking catchment of 800m (can be obtained from Walk Score website: www.walkscore.com);
- Information on ride-share organizations.
The developer will provide a commitment to design such a Transportation Information Brochure and make available to new residents.
6.3 Parking Pricing
Pay parking is an effective tool in shaping travel behaviour. We recommend that the parking spaces be unbundled from the unit costs (rental of vehicle spaces separate from unit rentals). This will help reduce unit costs for residents who do not wish to not have a vehicle and disincentive unnecessary vehicle ownership. Parking pricing helps realize the true building costs of vehicle parking spaces.
6.4 Car Sharing
Car Sharing clubs have developed significantly in the last 5-10 years and allow people to have access to a car in their area without having to buy or maintain their own vehicle. A “pay as you go” approach is adopted as members pay by the hour and/ or kilometre when they use a vehicle. Currently Zipcar has vehicles in Victoria but not in View Royal. The developer has agreed to promote car-sharing in this area by providing one car-share parking space to a local car-share provider at no cost.
6.5 Ride-Share
Ride-share involves two or more people sharing a car rather than driving as a single occupancy. The cost of the journey (fuel, tolls, parking, etc) can be split between the driver and passengers, resulting in savings for all. This also reduces the number of vehicle trips and parking demands.
A ride-share initiative can be as simple as the residential complex providing a common area erasable public notice board asking for:
- Preferred destination,
- Preferred departure time, date,
- Preferred return time,
- Contact information.
Those with a vehicle review the board and contact potential passengers if they wish to ride-share. Each passenger is asked to share costs of the trip dependent on trip costs.
An example of a successful ride-share initiative is passenger Mary needing to buy groceries, Mary fills out public board info: “Thrifty’s, Tuesday’s, an hour”. Now Mary rides with Joan, Mary buys Joan lunch.
With the provision of an erasable public notice board containing areas for residents to input the information listed above this initiative is self managing.
6.6 Bicycle Amenities
As discussed in Bicycle Parking Section 4.3 we recommend the Christie Point development provide bicycle parking in excess of that required by Town of View Royal Bylaw. Current plans consider the provision of two Class 1 Bicycle spaces per residential unit, which is double Bylaw minimum requirements.
To support resident cycling the developer has agreed to provide a bicycle repair station within the Christie Point site.
7. CONCLUSIONS & RECOMMENDATIONS
7.1 Conclusions
- Existing traffic conditions in the Study Area are generally at or over capacity during observed peak periods.
- The currently proposed 473 unit development is expected to have the same trip generation rate as the current site due to its consistent land use, unit sizes and expected demographics, this calculates to anticipated site vehicle trip generation of approximately 132 total two-way trips in the Weekday PM peak hour (94 inbound and 38 outbound).
- The site generated trips add approximately 15 vehicles per Weekday PM peak hour to the Study Area’s most critical movement which is the southbound to eastbound left turn movement at the Island Highway and Shoreline Drive intersection. This number of left turns is expected to be greater in the AM peak period when a higher portion of residents are leaving Christie Point, however reduced opposing westbound volumes on Island Highway are also expected in the AM peak period.
- Site generated trip impact to operations at the Island Highway and Admirals Road intersection are anticipated to be in the magnitude of 1.5 to 2%, this increase and its impact are expected to be negligible.
- The proposed vehicle parking supply is considered to be appropriate for this site’s land uses and location. While the supply is lower than View Royal’s minimum bylaw requirement, the site’s strong multi-modal transportation connections provide a variety of transportation options for residents. The proposed parking supply aligns with View Royal’s goals of promoting more sustainable transportation modes.
7.2 Recommendations
It is recommended that the Town of View Royal introduce a traffic signal with a pedestrian crossing of Island Highway in combination with the extension of the two westbound through lanes on Island Highway to a point west of Shoreline Drive. The merge from two to one westbound Island Highway through lane would be moved at minimum 100m west of the Shoreline Drive intersection with Island Highway.
Of the total (post-development) future forecasted 62 per peak hour vehicles turning left from Shoreline Drive onto Island Highway during the weekday PM peak hour, approximately 32% are forecasted to be Christie Point vehicles. The majority of the vehicles are anticipated to continue to be generated by Shoreline Middle School. If the Town wishes to pursue signalization of this intersection we suggest a cost-sharing arrangement be established to determine the developer’s contribution.
Residential parking should be unbundled from the residential units and paid for separately.
The developer will provide bicycle parking that exceeds Bylaw requirements.
The developer will provide a bicycle repair station for resident use.
The developer will provide a Transportation Information Brochure for future residents.
The developer will provide an erasable public notice board for the exchange of ride-share information.

