2013 West Shore RCMP Annual Year End Report
Comprehensive annual report detailing crime statistics, policing priorities, and resources for the West Shore RCMP detachment in 2013.
2013 West Shore RCMP Annual Year End Report
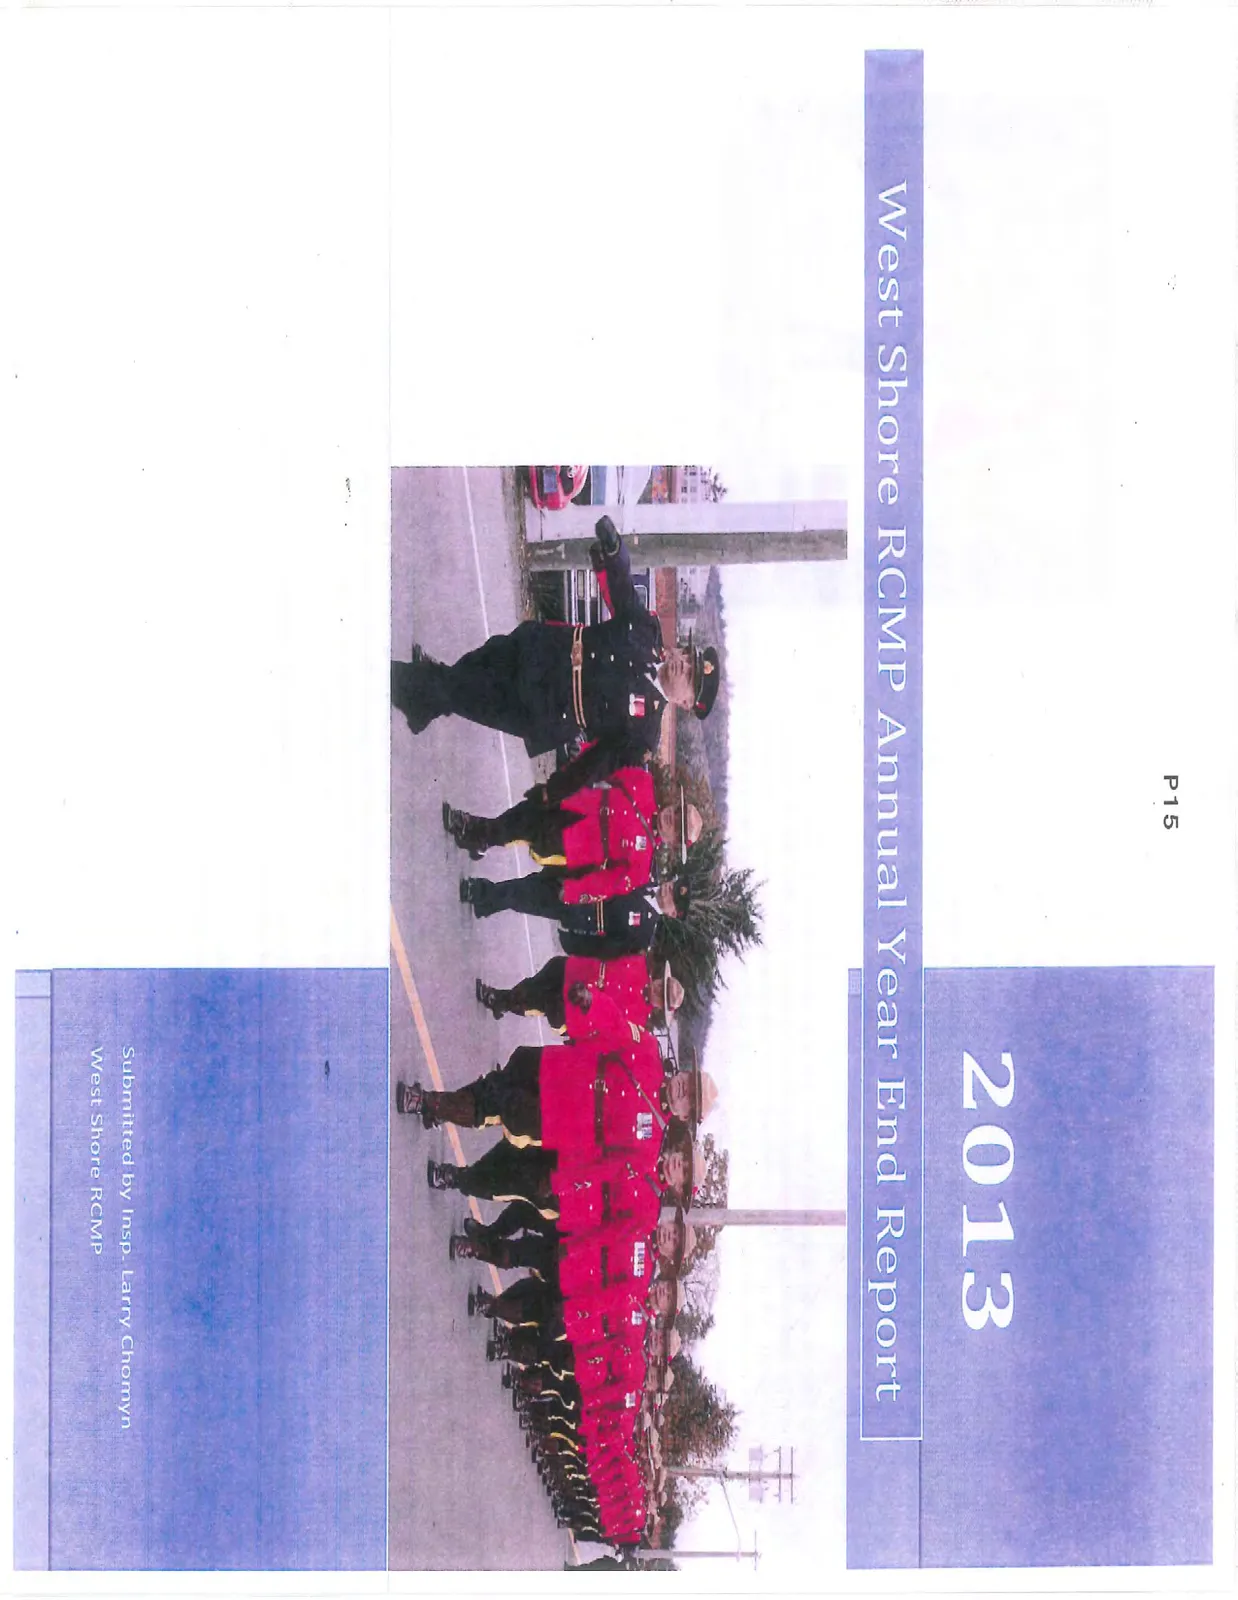
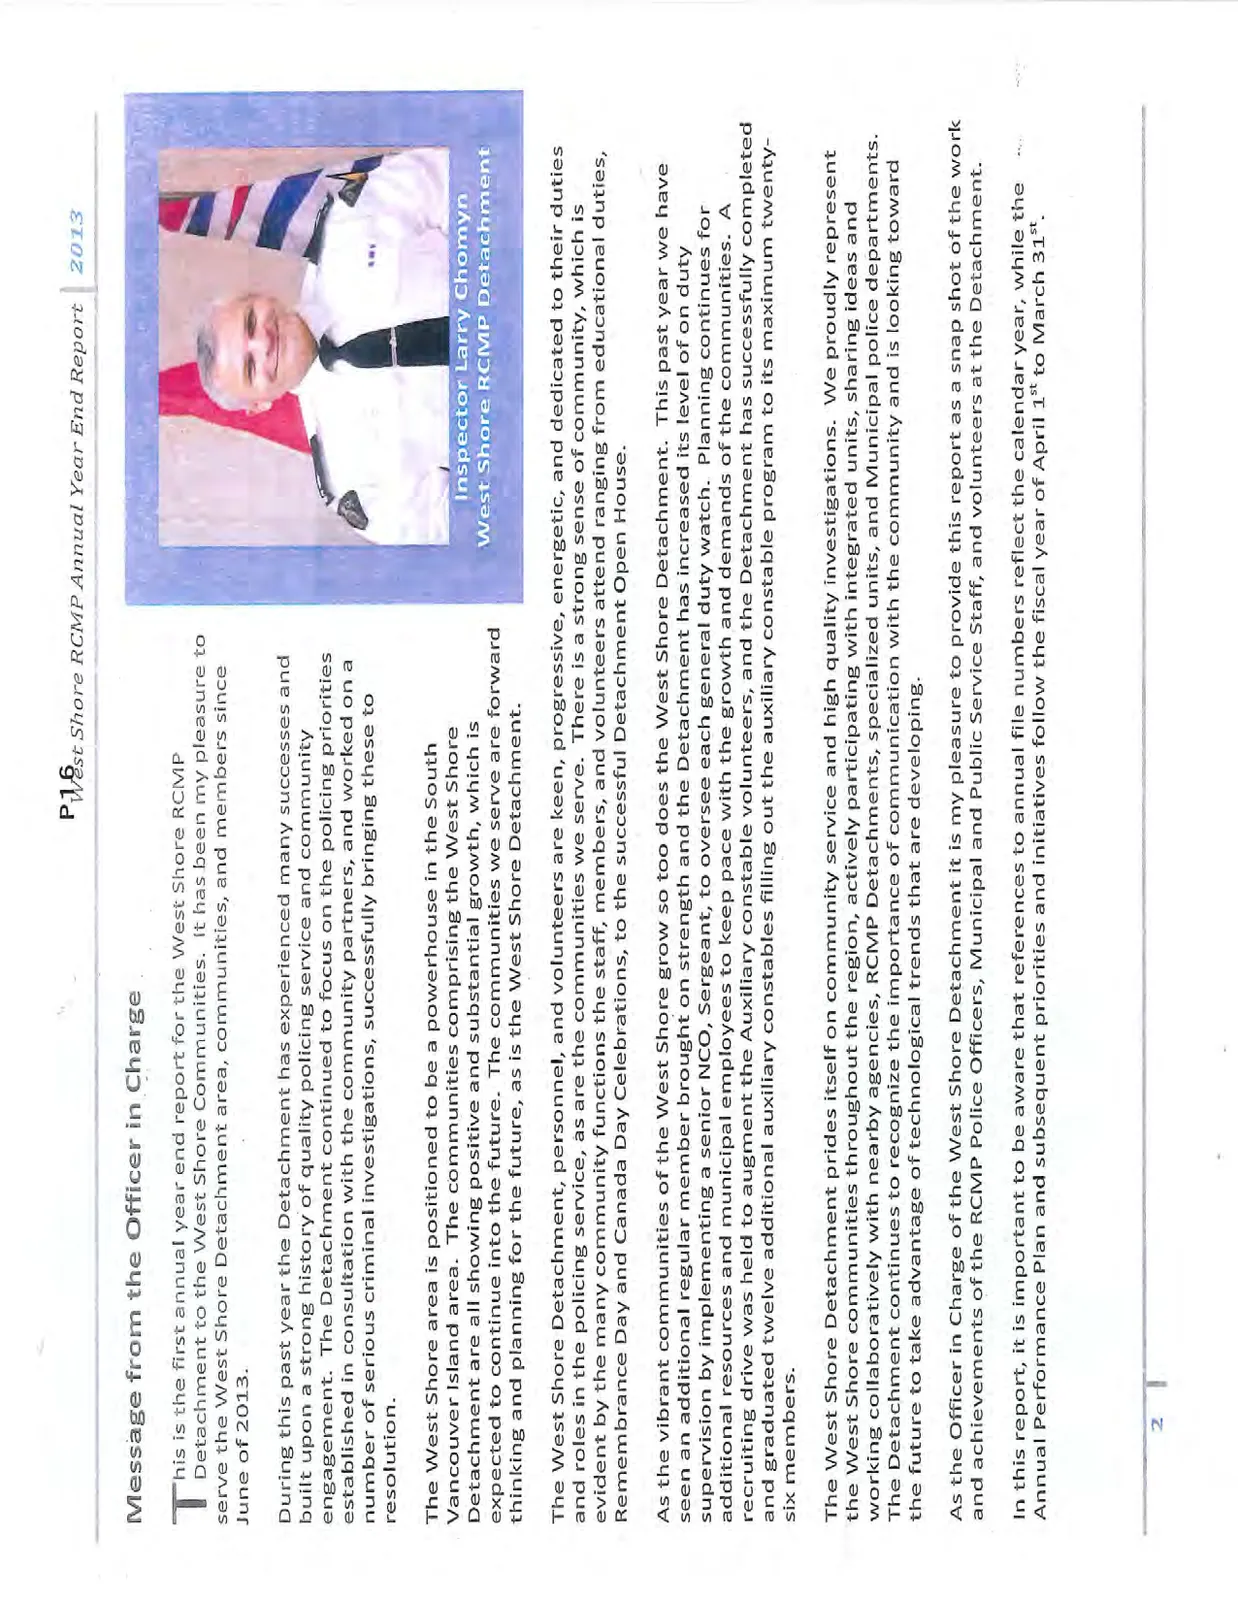
Submitted by Insp. Larry Chomyn West Shore RCMP
Message from the Officer in Charge
This is the first annual year end report for the West Shore RCMP Detachment to the West Shore Communities. It has been my pleasure to serve the West Shore Detachment area, communities, and members since June of 2013.
During this past year the Detachment has experienced many successes and built upon a strong history of quality policing service and community engagement. The Detachment continued to focus on the policing priorities established in consultation with the community partners, and worked on a number of serious criminal investigations, successfully bringing these to resolution.
The West Shore area is positioned to be a powerhouse in the South Vancouver Island area. The communities comprising the West Shore Detachment are all showing positive and substantial growth, which is expected to continue into the future. The communities we serve are forward thinking and planning for the future, as is the West Shore Detachment.
The West Shore Detachment, personnel, and volunteers are keen, progressive, energetic, and dedicated to their duties and roles in the policing service, as are the communities we serve. There is a strong sense of community, which is evident by the many community functions the staff, members, and volunteers attend ranging from educational duties, Remembrance Day and Canada Day Celebrations, to the successful Detachment Open House.
As the vibrant communities of the West Shore grow so too does the West Shore Detachment. This past year we have seen an additional regular member brought on strength and the Detachment has increased its level of on duty supervision by implementing a senior NCO, Sergeant, to oversee each general duty watch. Planning continues for additional resources and municipal employees to keep pace with the growth and demands of the communities. A recruiting drive was held to augment the Auxiliary constable volunteers, and the Detachment has successfully completed and graduated twelve additional auxiliary constables filling out the auxiliary constable program to its maximum twenty-six members.
The West Shore Detachment prides itself on community service and high quality investigations. We proudly represent the West Shore communities throughout the region, actively participating with integrated units, sharing ideas and working collaboratively with nearby agencies, RCMP Detachments, specialized units, and Municipal police departments. The Detachment continues to recognize the importance of communication with the community and is looking toward the future to take advantage of technological trends that are developing.
As the Officer in Charge of the West Shore Detachment it is my pleasure to provide this report as a snap shot of the work and achievements of the RCMP Police Officers, Municipal and Public Service Staff, and volunteers at the Detachment.
In this report, it is important to be aware that references to annual file numbers reflect the calendar year, while the Annual Performance Plan and subsequent priorities and initiatives follow the fiscal year of April 1st to March 31st.
The statistical data utilized in this report is derived from the BC Police Records Information Management Environment (PRIME) system. This system is always in a state of flux as offences and files are cleared, added or require scoring changes. The majority of the data used was captured at a specific point in time to allow for accurate comparisons, although it should be recognized that late reporting does occur.
The Annual Statistical Report provides information on crimes against the person, crimes against property, traffic offences, drug offences, other calls for service, and various subjects of interest. Trends are summarized using both numbers and percentages. The total number of offences and calls for service is significant from a work load perspective while percentages are an indicator of change over time. Actual file counts are used to document statistical reporting requirements for violent and other crimes committed for Statistics Canada. Distinctions will be noted on each page. All other statistics are taken from Statistics Canada and Police Resources in BC from the Police Services Division, Ministry of Justice, December 2013.
Table of Contents
| Subject | Page |
|---|---|
| Message from the OIC | 2 |
| Table of Contents | 3 |
| West Shore RCMP Jurisdictions | 4 |
| Structure and Support Units | 5 |
| Total Files | 6 |
| Number of Files/Population | 7 |
| Comparison to other Municipalities | 7 |
| Police Resources in West Shore | 8 |
| Crime Severity Index | 9 |
| Criminal Code Offences | 10 |
| Strategic Policing Priorities (APP) | 11 |
| Prolific Offender Management | 14 |
| Licensed Premise Checks | 15 |
| Traffic | 16 |
| Moving Forward | 18 |
West Shore RCMP Annual Report - 2013
West Shore RCMP proudly serves approximately 64,000 people and reports to 5 municipalities including the City of Langford, the City of Colwood, the Town of View Royal, the District of Metchosin and the District of Highlands. West Shore RCMP also proudly serves the Songhees and Esquimalt First Nations. West Shore RCMP polices everything from commercial/industrial zones to residential neighborhoods, waterfront recreational areas, provincial parks and the main Island Highway.
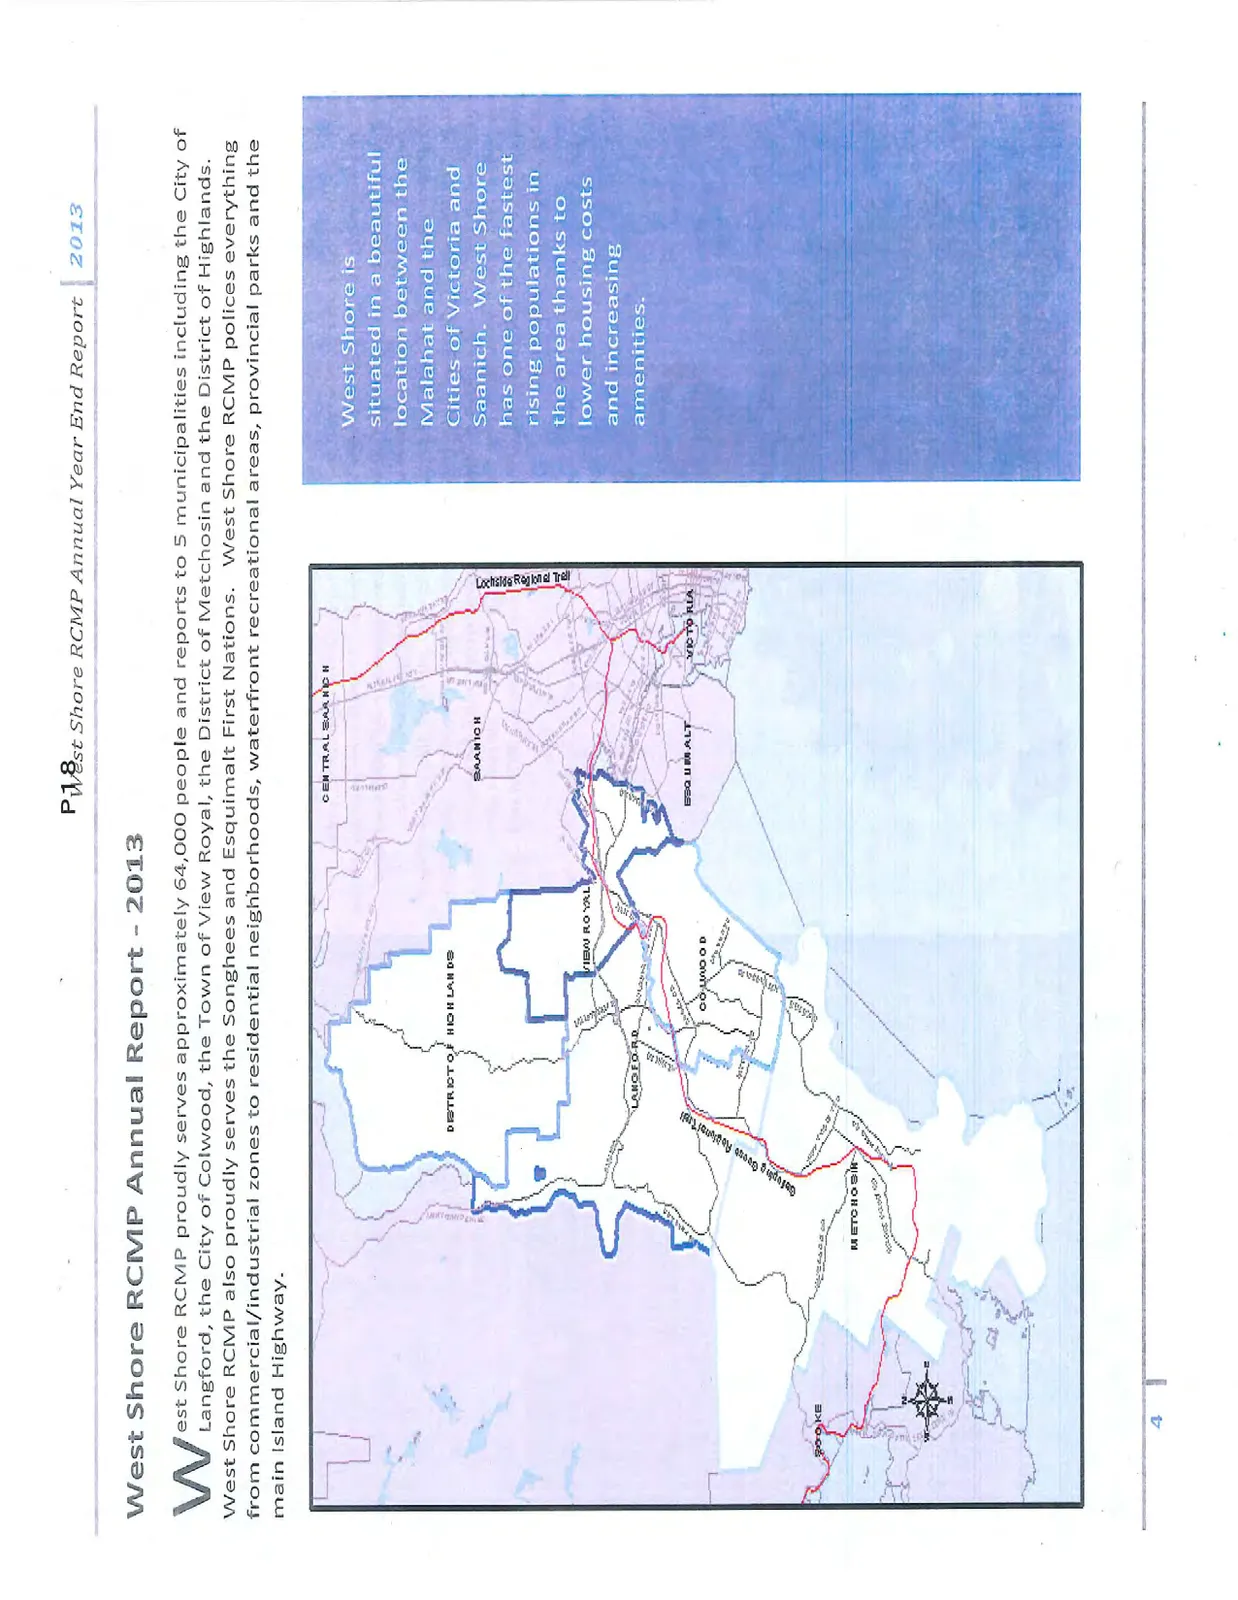
West Shore is situated in a beautiful location between the Malahat and the Cities of Victoria and Saanich. West Shore has one of the fastest rising populations in the area thanks to lower housing costs and increasing amenities.
West Shore RCMP
In 2013, West Shore RCMP was staffed by 61 sworn officers, and 17.5 civilian staff members who together handled more than 18,569 calls for service.
Organization Chart
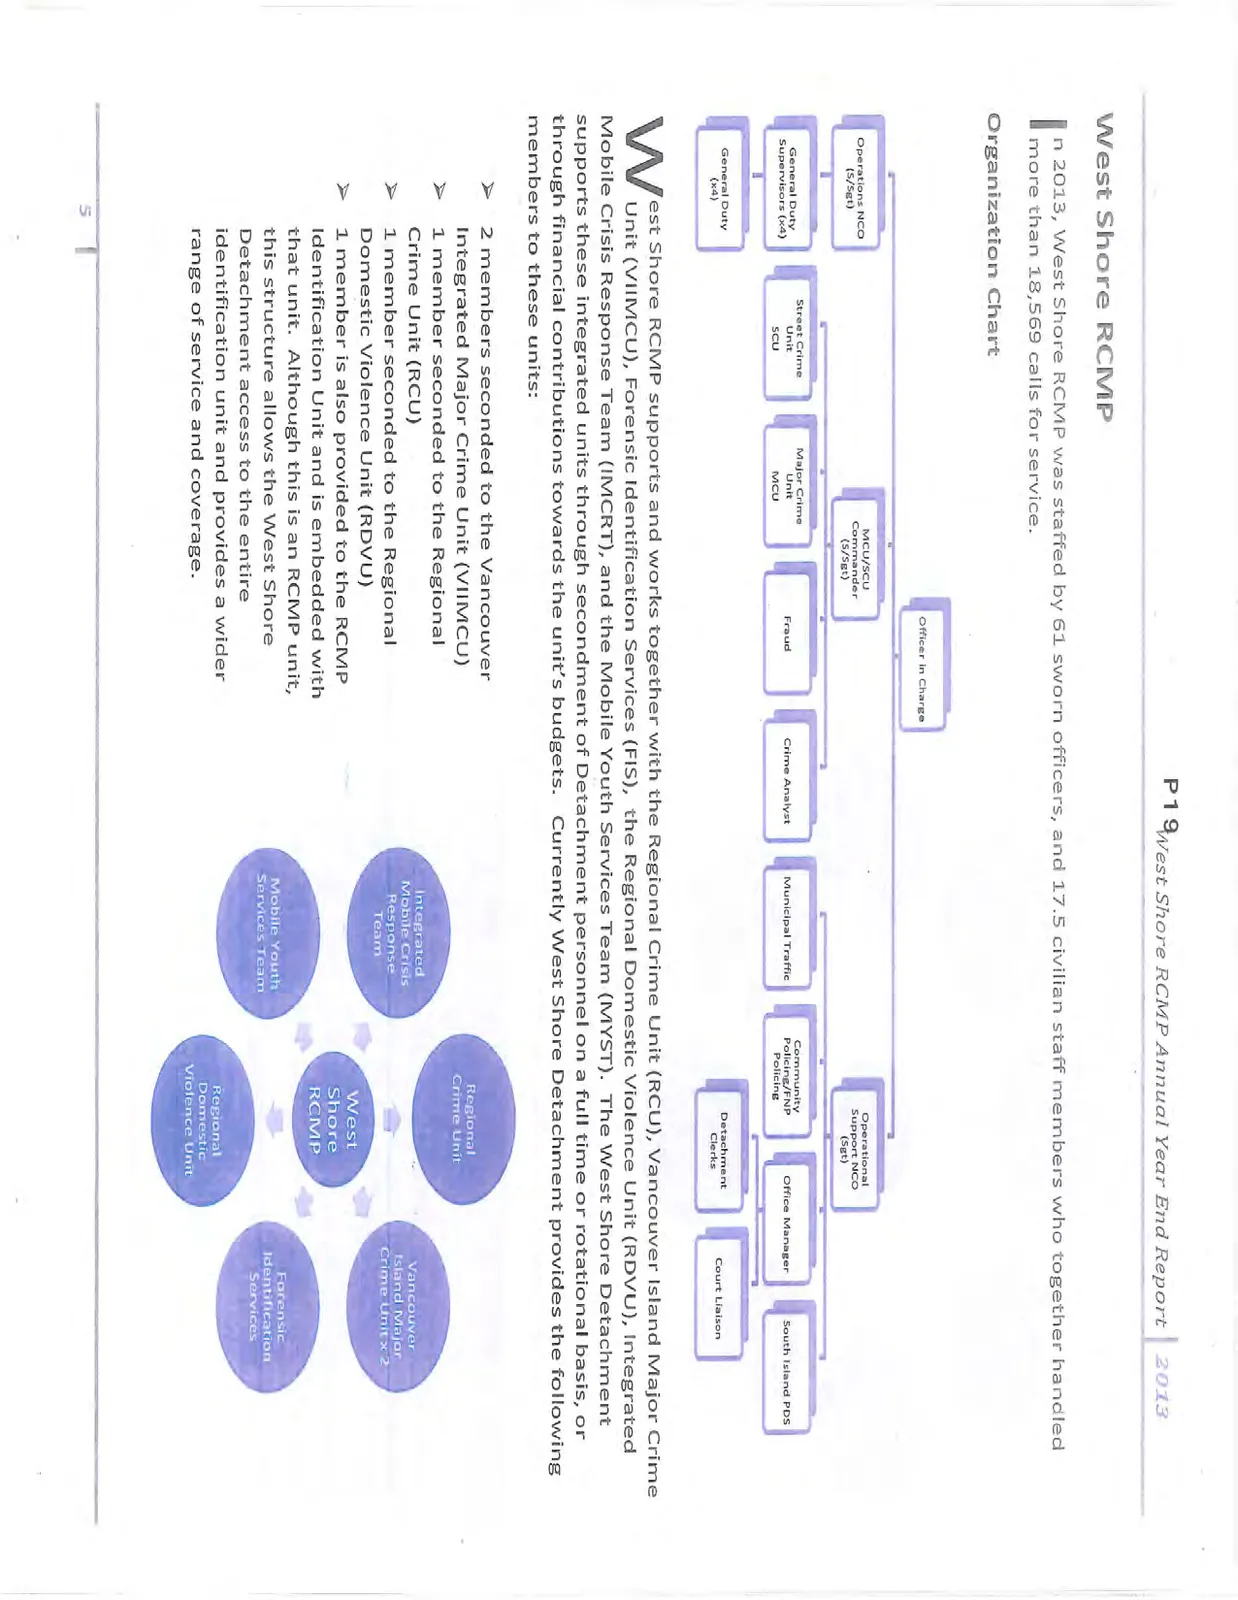
West Shore RCMP supports and works together with the Regional Crime Unit (RCU), Vancouver Island Major Crime Unit (VIIMCU), Forensic Identification Services (FIS), the Regional Domestic Violence Unit (RDVU), Integrated Mobile Crisis Response Team (IMCRT), and the Mobile Youth Services Team (MYST). The West Shore Detachment supports these integrated units through secondment of Detachment personnel on a full time or rotational basis, or through financial contributions towards the unit's budgets. Currently West Shore Detachment provides the following members to these units:
- 2 members seconded to the Vancouver Integrated Major Crime Unit (VIIMCU)
- 1 member seconded to the Regional Crime Unit (RCU)
- 1 member seconded to the Regional Domestic Violence Unit (RDVU)
- 1 member is also provided to the RCMP Identification Unit and is embedded with that unit. Although this is an RCMP unit, this structure allows the West Shore Detachment access to the entire identification unit and provides a wider range of service and coverage.
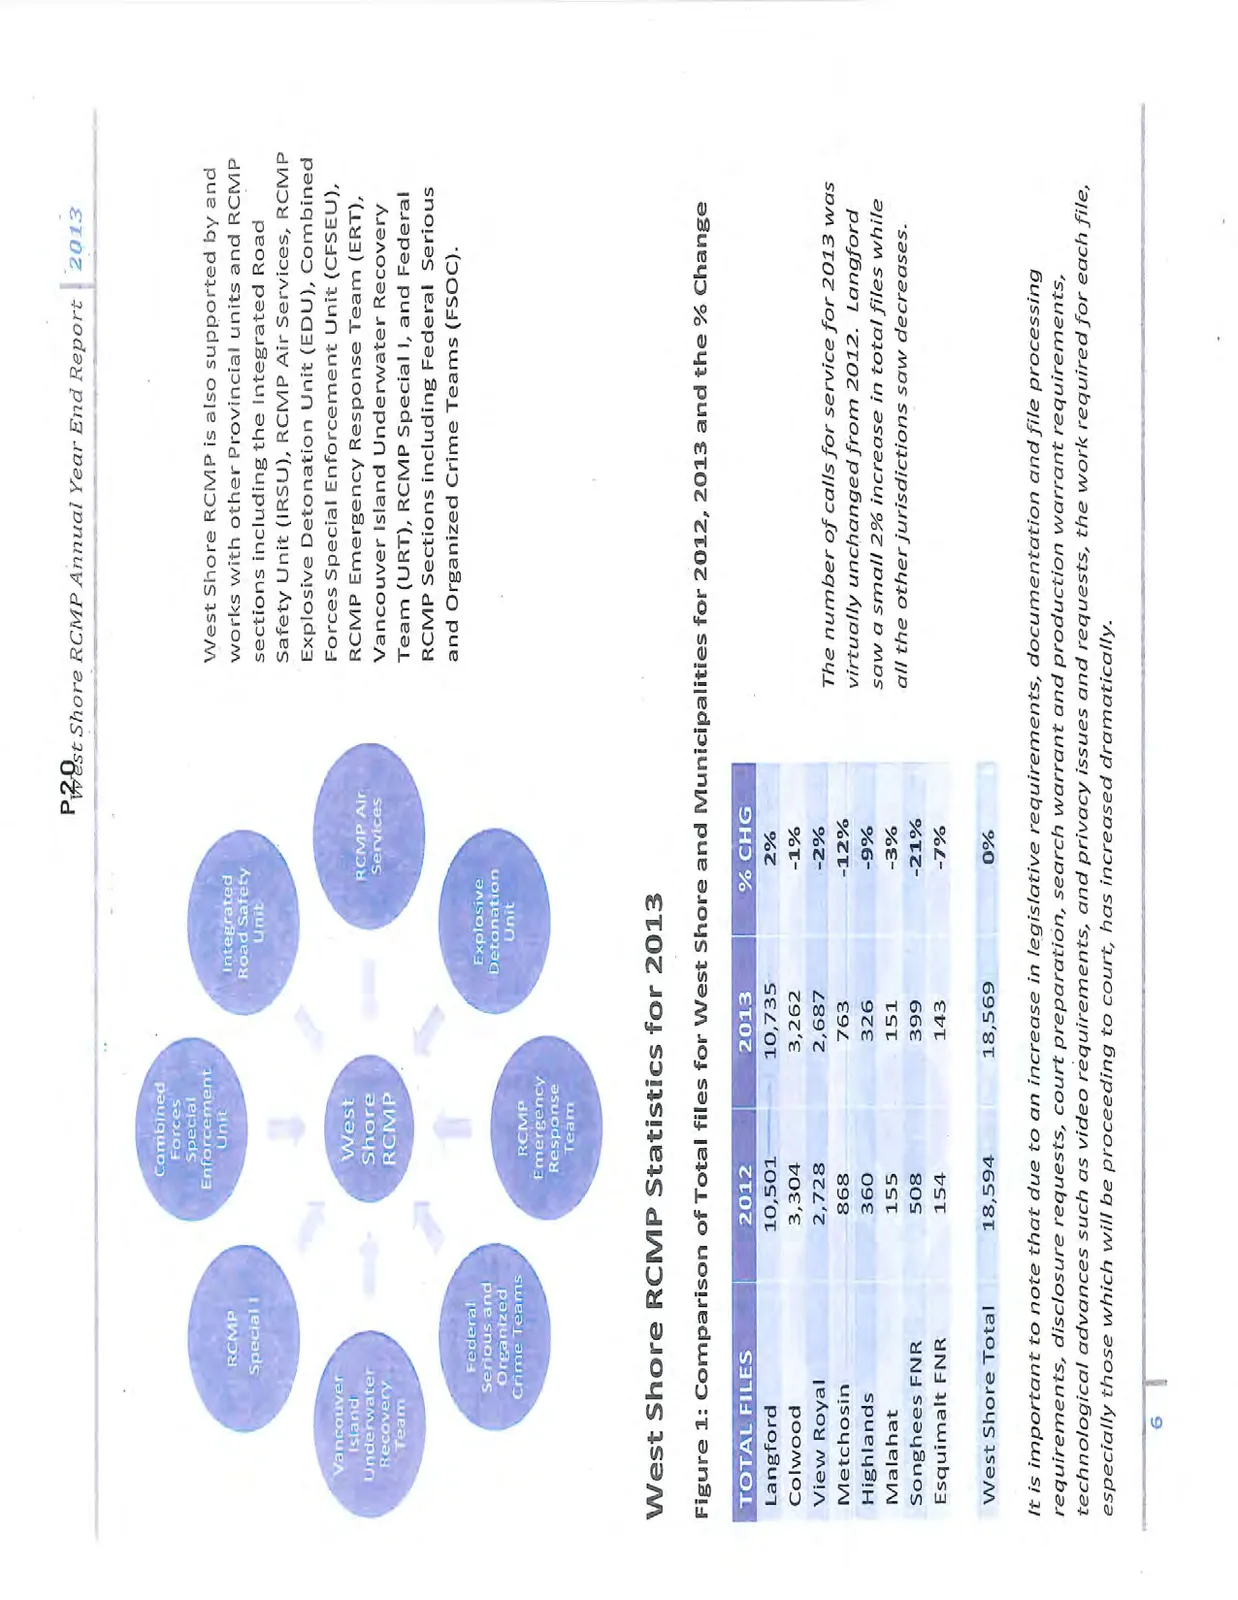
West Shore RCMP is also supported by and works with other Provincial units and RCMP sections including the Integrated Road Safety Unit (IRSU), RCMP Air Services, RCMP Explosive Detonation Unit (EDU), Combined Forces Special Enforcement Unit (CFSEU), RCMP Emergency Response Team (ERT), Vancouver Island Underwater Recovery Team (URT), RCMP Special I, and Federal RCMP Sections including Federal Serious and Organized Crime Teams (FSOC).
West Shore RCMP Statistics for 2013
Figure 1: Comparison of Total files for West Shore and Municipalities for 2012, 2013 and the % Change
| TOTAL FILES | 2012 | 2013 | % CHG |
|---|---|---|---|
| Langford | 10,501 | 10,735 | 2% |
| Colwood | 3,304 | 3,262 | -1% |
| View Royal | 2,728 | 2,687 | -2% |
| Metchosin | 868 | 763 | -12% |
| Highlands | 360 | 326 | -9% |
| Malahat | 155 | 151 | -3% |
| Songhees FNR | 508 | 399 | -21% |
| Esquimalt FNR | 154 | 143 | -7% |
| West Shore Total | 18,594 | 18,569 | 0% |
The number of calls for service for 2013 was virtually unchanged from 2012. Langford saw a small 2% increase in total files while all the other jurisdictions saw decreases.
It is important to note that due to an increase in legislative requirements, documentation and file processing requirements, disclosure requests, court preparation, search warrant and production warrant requirements, technological advances such as video requirements, and privacy issues and requests, the work required for each file, especially those which will be proceeding to court, has increased dramatically.
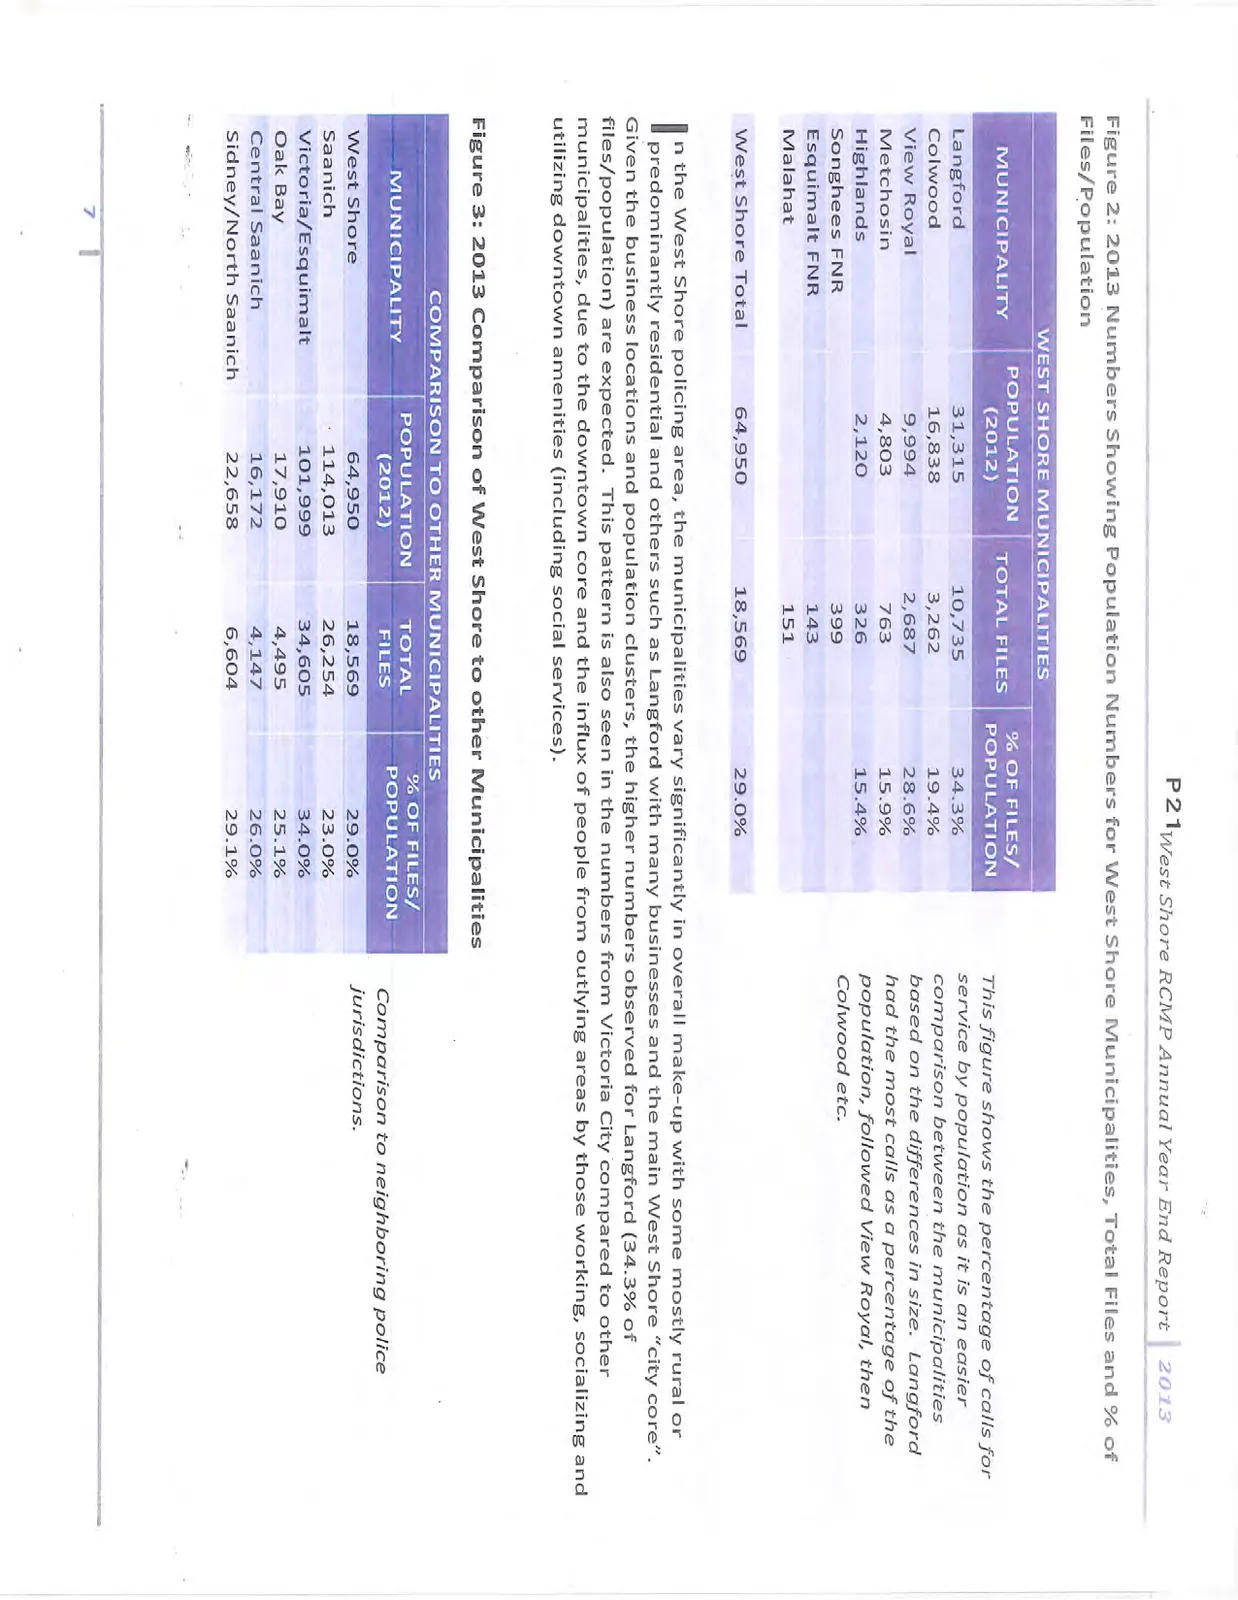
Figure 2: 2013 Numbers Showing Population Numbers for West Shore Municipalities, Total Files and % of Files/Population
| WEST SHORE MUNICIPALITIES | POPULATION (2012) | TOTAL FILES | % OF FILES/ POPULATION |
|---|---|---|---|
| Langford | 31,315 | 10,735 | 34.3% |
| Colwood | 16,838 | 3,262 | 19.4% |
| View Royal | 9,994 | 2,687 | 26.8% |
| Metchosin | 4,803 | 763 | 15.9% |
| Highlands | 2,120 | 326 | 15.4% |
| Songhees FNR | 399 | ||
| Esquimalt FNR | 143 | ||
| Malahat | 151 | ||
| West Shore Total | 64,950 | 18,569 | 29.0% |
This figure shows the percentage of calls for service by population as it is an easier comparison between the municipalities based on the differences in size. Langford had the most calls as a percentage of the population, followed View Royal, then Colwood etc.
In the West Shore policing area, the municipalities vary significantly in overall make-up with some mostly rural or predominantly residential and others such as Langford with many businesses and the main West Shore "city core". Given the business locations and population clusters, the higher numbers observed for Langford (34.3% of files/population) are expected. This pattern is also seen in the numbers from Victoria City compared to other municipalities, due to the downtown core and the influx of people from outlying areas by those working, socializing and utilizing downtown amenities (including social services).
Figure 3: 2013 Comparison of West Shore to other Municipalities
| COMPARISON TO OTHER MUNICIPALITIES | POPULATION (2012) | TOTAL FILES | % OF FILES/ POPULATION |
|---|---|---|---|
| West Shore | 64,950 | 18,569 | 29.0% |
| Saanich | 114,013 | 26,254 | 23.0% |
| Victoria/Esquimalt | 101,999 | 34,605 | 34.0% |
| Oak Bay | 17,910 | 4,495 | 25.1% |
| Central Saanich | 16,172 | 4,147 | 26.0% |
| Sidney/North Saanich | 22,658 | 6,604 | 29.1% |
Comparison to neighboring police jurisdictions.
Police Resources in West Shore and Neighboring Jurisdictions
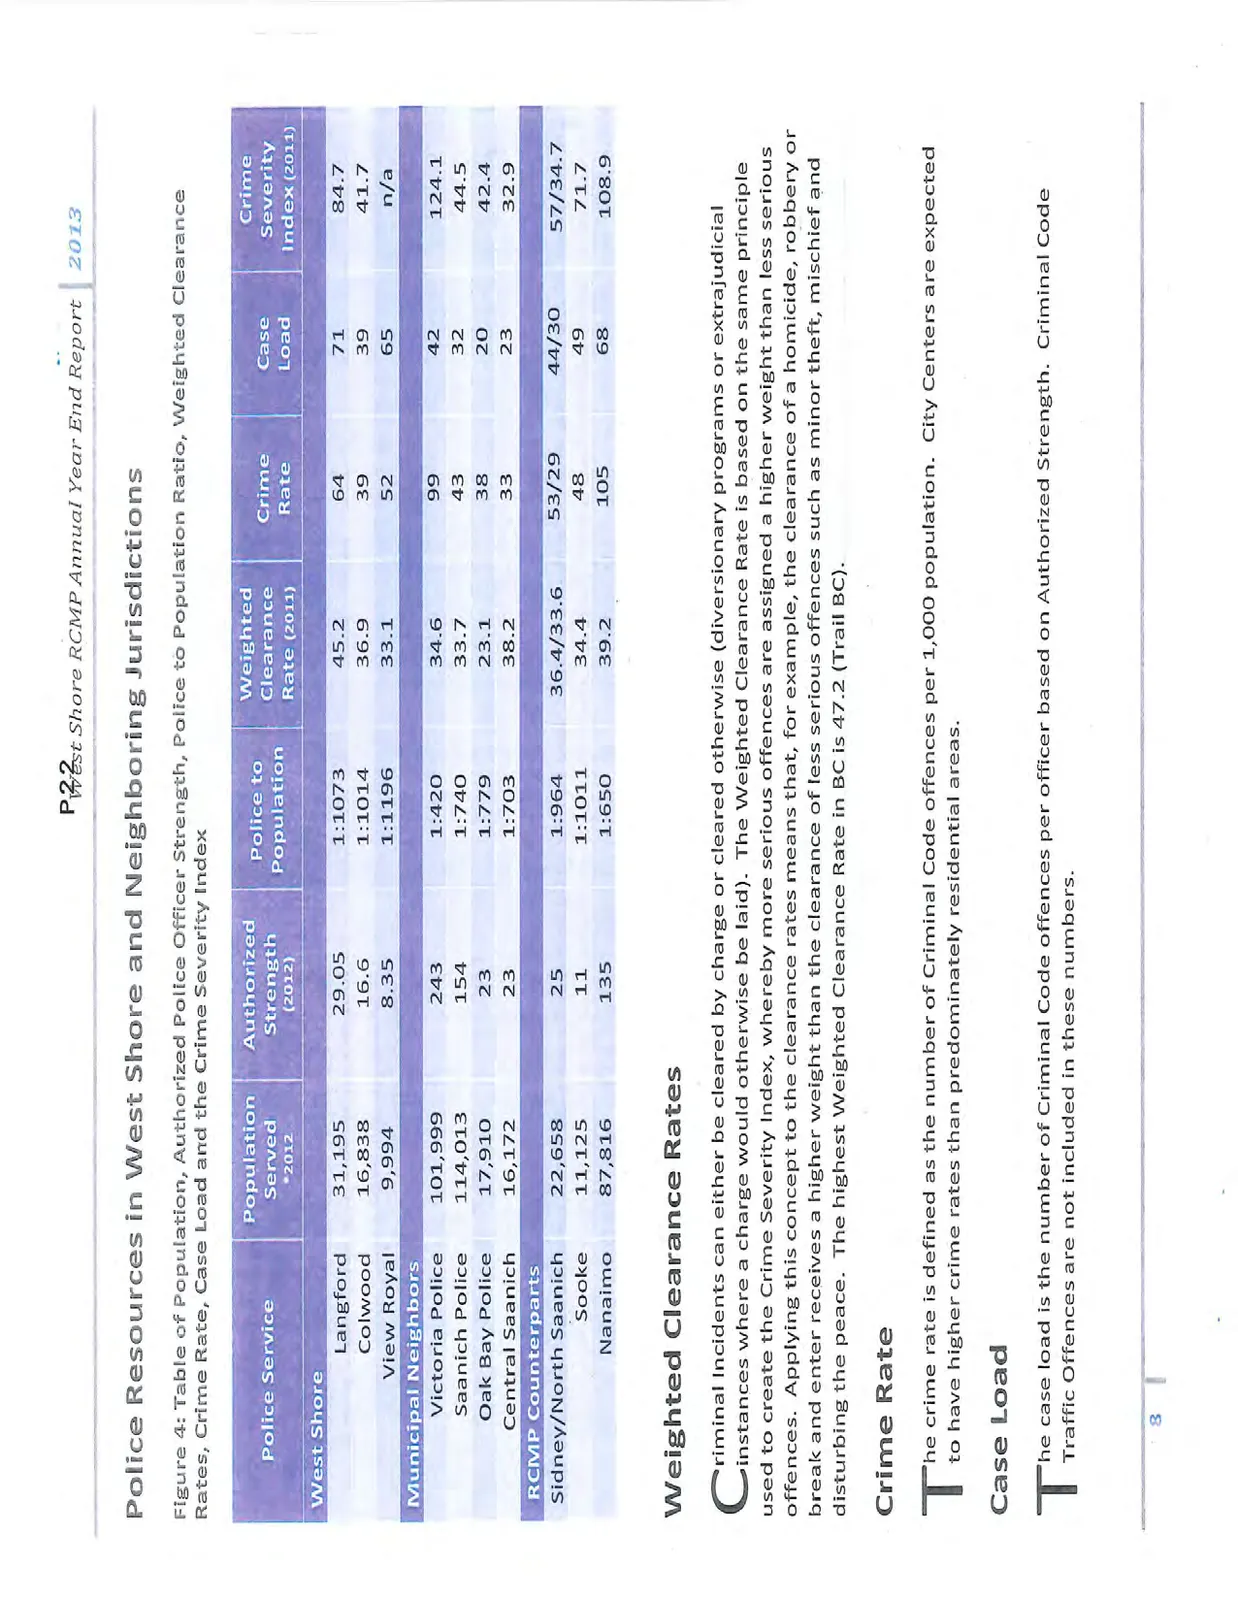
Figure 4: Table of Population, Authorized Police Officer Strength, Police to Population Ratio, Weighted Clearance Rates, Crime Rate, Case Load and the Crime Severity Index
| Police Service | Population Served *2012 | Authorized Strength (2012) | Police to Population | Weighted Clearance Rate (2011) | Crime Rate | Case Load | Crime Severity Index (2011) |
|---|---|---|---|---|---|---|---|
| West Shore | |||||||
| Langford | 31,195 | 29.05 | 1:1073 | 45.2 | 64 | 71 | 84.7 |
| Colwood | 16,838 | 16.6 | 1:1014 | 36.9 | 39 | 39 | 41.7 |
| View Royal | 9,994 | 8.35 | 1:1196 | 33.1 | 52 | 65 | n/a |
| Municipal Neighbors | |||||||
| Victoria Police | 101,999 | 243 | 1:420 | 34.6 | 99 | 42 | 124.1 |
| Saanich Police | 114,013 | 154 | 1:740 | 33.7 | 43 | 32 | 44.5 |
| Oak Bay Police | 17,910 | 23 | 1:779 | 23.1 | 38 | 20 | 42.4 |
| Central Saanich | 16,172 | 23 | 1:703 | 38.2 | 33 | 23 | 32.9 |
| RCMP Counterparts | |||||||
| Sidney/North Saanich | 22,658 | 25 | 1:964 | 36.4/33.6 | 53/29 | 44/30 | 57/34.7 |
| Sooke | 11,125 | 11 | 1:1011 | 34.4 | 48 | 49 | 71.7 |
| Nanaimo | 87,816 | 135 | 1:650 | 39.2 | 105 | 68 | 108.9 |
Weighted Clearance Rates
Criminal Incidents can either be cleared by charge or cleared otherwise (diversionary programs or extrajudicial instances where a charge would otherwise be laid). The Weighted Clearance Rate is based on the same principle used to create the Crime Severity Index, whereby more serious offences are assigned a higher weight than less serious offences. Applying this concept to the clearance rates means that, for example, the clearance of a homicide, robbery or break and enter receives a higher weight than the clearance of less serious offences such as minor theft, mischief and disturbing the peace. The highest Weighted Clearance Rate in BC is 47.2 (Trail BC).
Crime Rate
The crime rate is defined as the number of Criminal Code offences per 1,000 population. City Centers are expected to have higher crime rates than predominately residential areas.
Case Load
The case load is the number of Criminal Code offences per officer based on Authorized Strength. Criminal Code Traffic Offences are not included in these numbers.
Crime Severity Index
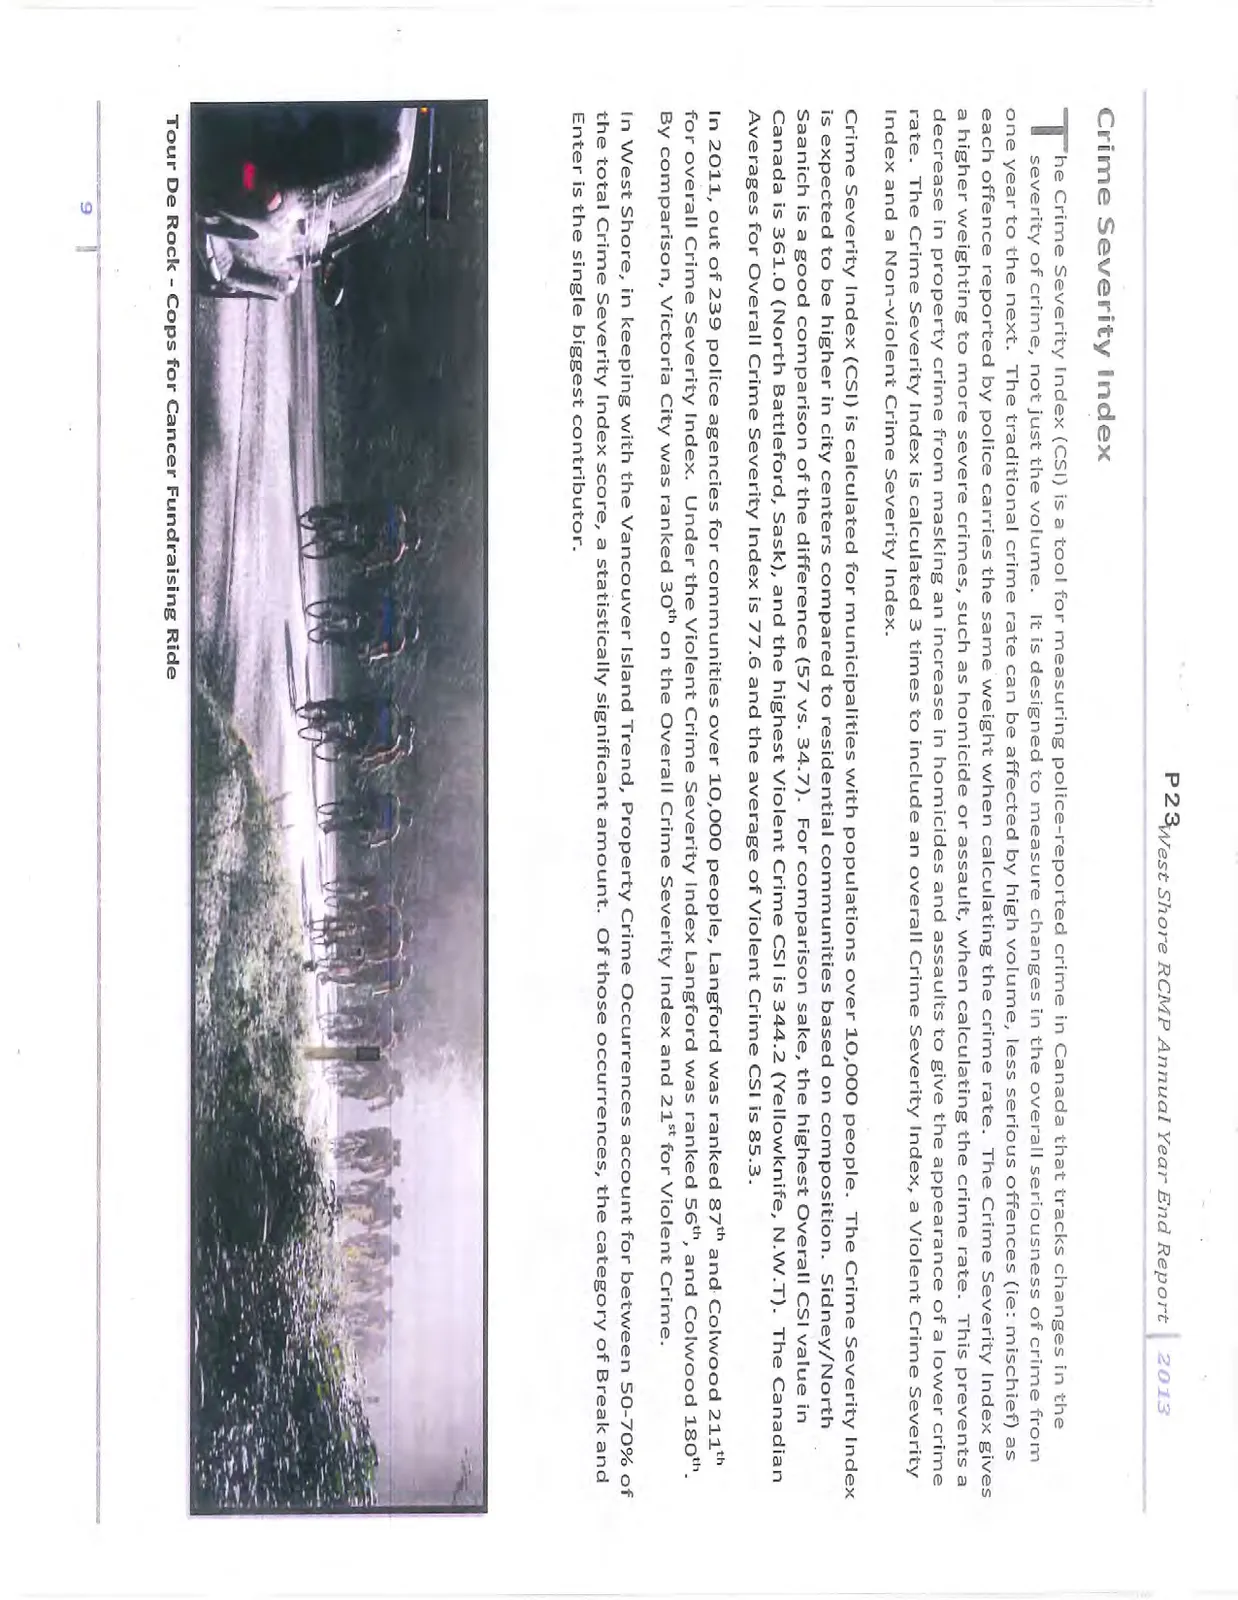
The Crime Severity Index (CSI) is a tool for measuring police-reported crime in Canada that tracks changes in the severity of crime, not just the volume. It is designed to measure changes in the overall seriousness of crime from one year to the next. The traditional crime rate can be affected by high volume, less serious offences (ie: mischief) as each offence reported by police carries the same weight when calculating the crime rate. The Crime Severity Index gives a higher weighting to more serious crimes, such as homicide or assault, when calculating the crime rate. This prevents a decrease in property crime from masking an increase in homicides and assaults to give the appearance of a lower crime rate. The Crime Severity Index is calculated 3 times to include an overall Crime Severity Index, a Violent Crime Severity Index and a Non-violent Crime Severity Index.
Crime Severity Index (CSI) is calculated for municipalities with populations over 10,000 people. The Crime Severity Index is expected to be higher in city centers compared to residential communities based on composition. Sidney/North Saanich is a good comparison of the difference (57 vs. 34.7). For comparison sake, the highest Overall CSI value in Canada is 361.0 (North Battleford, Sask), and the highest Violent Crime CSI is 344.2 (Yellowknife, N.W.T). The Canadian Averages for Overall Crime Severity Index is 77.6 and the average of Violent Crime CSI is 85.3.
In 2011, out of 239 police agencies for communities over 10,000 people, Langford was ranked 87th and Colwood 211th for overall Crime Severity Index. Under the Violent Crime Severity Index Langford was ranked 56th, and Colwood 180th. By comparison, Victoria City was ranked 30th on the Overall Crime Severity Index and 21st for Violent Crime.
In West Shore, in keeping with the Vancouver Island Trend, Property Crime Occurrences account for between 50-70% of the total Crime Severity Index score, a statistically significant amount. Of those occurrences, the category of Break and Enter is the single biggest contributor.
Criminal Code Offences - Comparison from 2012-2013
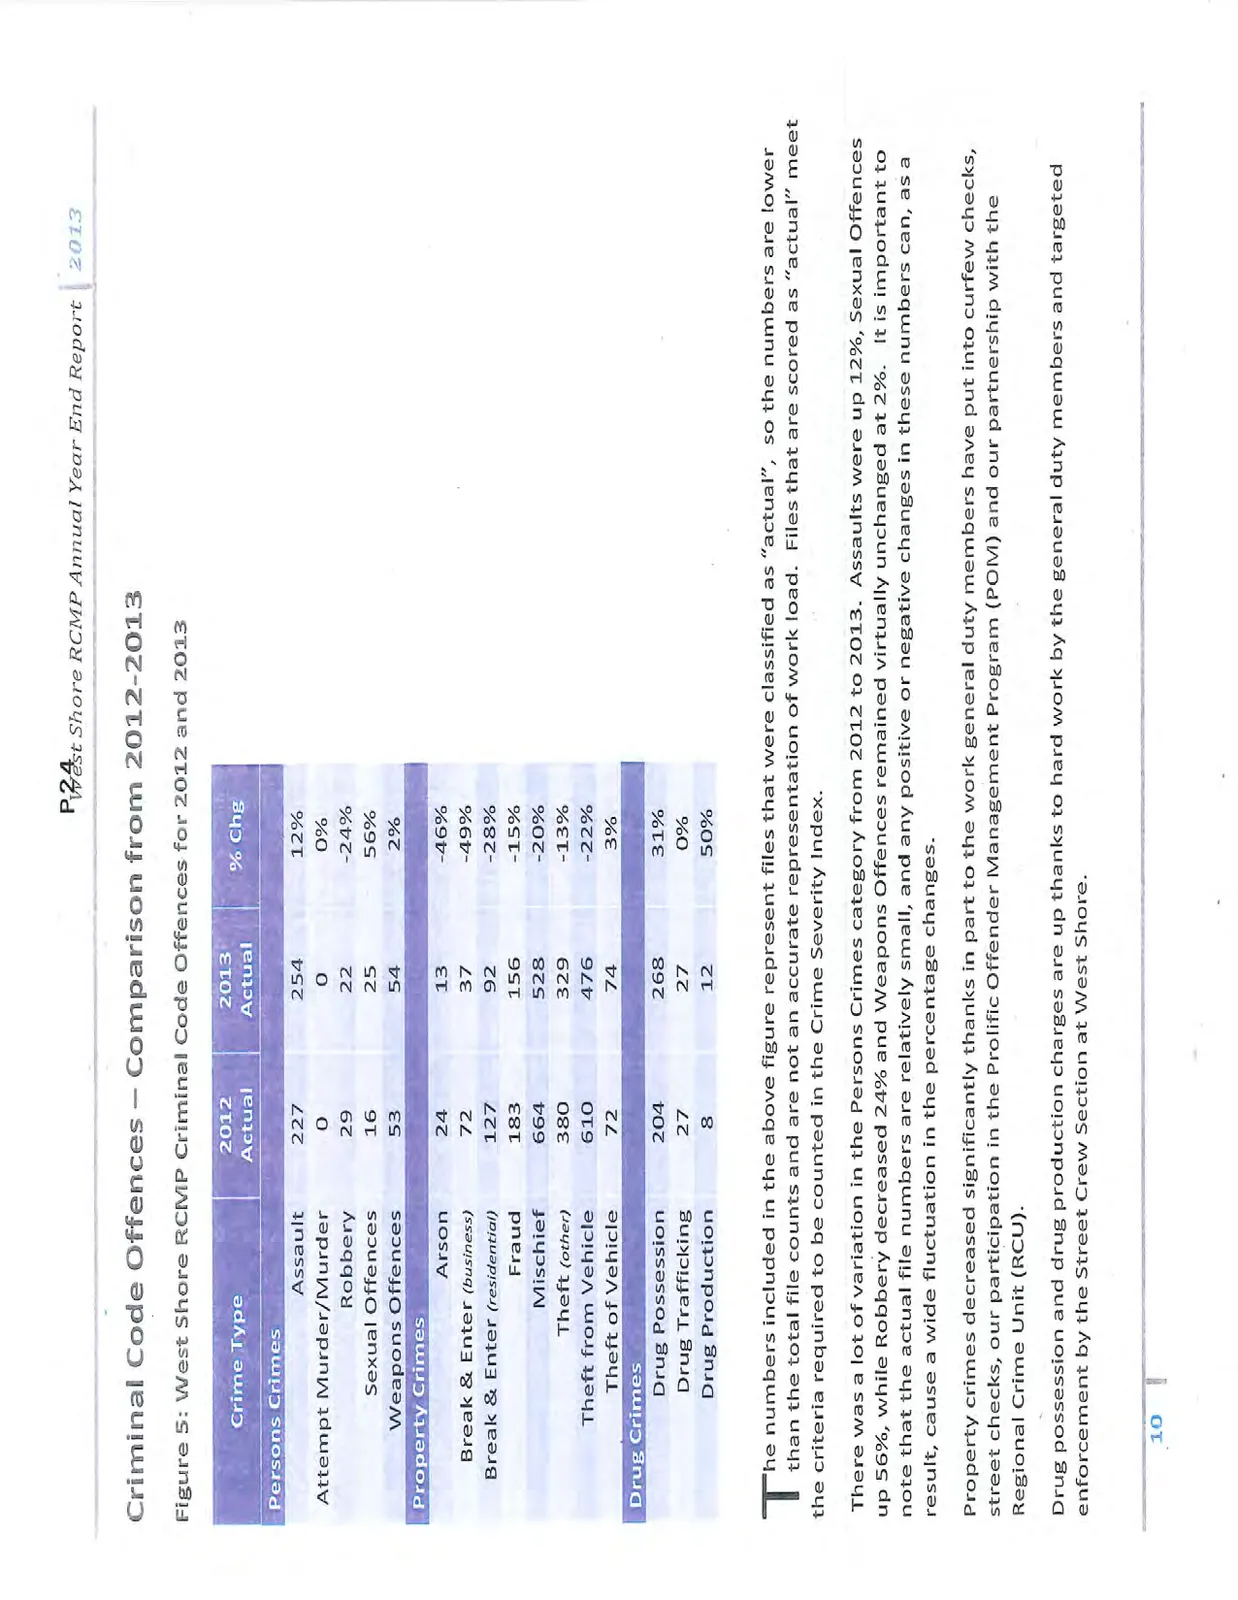
Figure 5: West Shore RCMP Criminal Code Offences for 2012 and 2013
| Crime Type | 2012 Actual | 2013 Actual | % Chg |
|---|---|---|---|
| Persons Crimes | |||
| Assault | 227 | 254 | 12% |
| Attempt Murder/Murder | 0 | 0 | 0% |
| Robbery | 29 | 22 | -24% |
| Sexual Offences | 16 | 25 | 56% |
| Weapons Offences | 53 | 54 | 2% |
| Property Crimes | |||
| Arson | 24 | 13 | -46% |
| Break & Enter (business) | 72 | 37 | -49% |
| Break & Enter (residential) | 127 | 92 | -28% |
| Fraud | 183 | 156 | -15% |
| Mischief | 664 | 528 | -20% |
| Theft (other) | 380 | 329 | -13% |
| Theft from Vehicle | 610 | 476 | -22% |
| Theft of Vehicle | 72 | 74 | 3% |
| Drug Crimes | |||
| Drug Possession | 204 | 268 | 31% |
| Drug Trafficking | 27 | 27 | 0% |
| Drug Production | 8 | 12 | 50% |
The numbers included in the above figure represent files that were classified as "actual", so the numbers are lower than the total file counts and are not an accurate representation of work load. Files that are scored as "actual" meet the criteria required to be counted in the Crime Severity Index.
There was a lot of variation in the Persons Crimes category from 2012 to 2013. Assaults were up 12%, Sexual Offences up 56%, while Robbery decreased 24% and Weapons Offences remained virtually unchanged at 2%. It is important to note that the actual file numbers are relatively small, and any positive or negative changes in these numbers can, as a result, cause a wide fluctuation in the percentage changes.
Property crimes decreased significantly thanks in part to the work general duty members have put into curfew checks, street checks, our participation in the Prolific Offender Management Program (POM) and our partnership with the Regional Crime Unit (RCU).
Drug possession and drug production charges are up thanks to hard work by the general duty members and targeted enforcement by the Street Crew Section at West Shore.
Strategic Policing Priorities: The Annual Performance Plan 2013-2014 (APP)
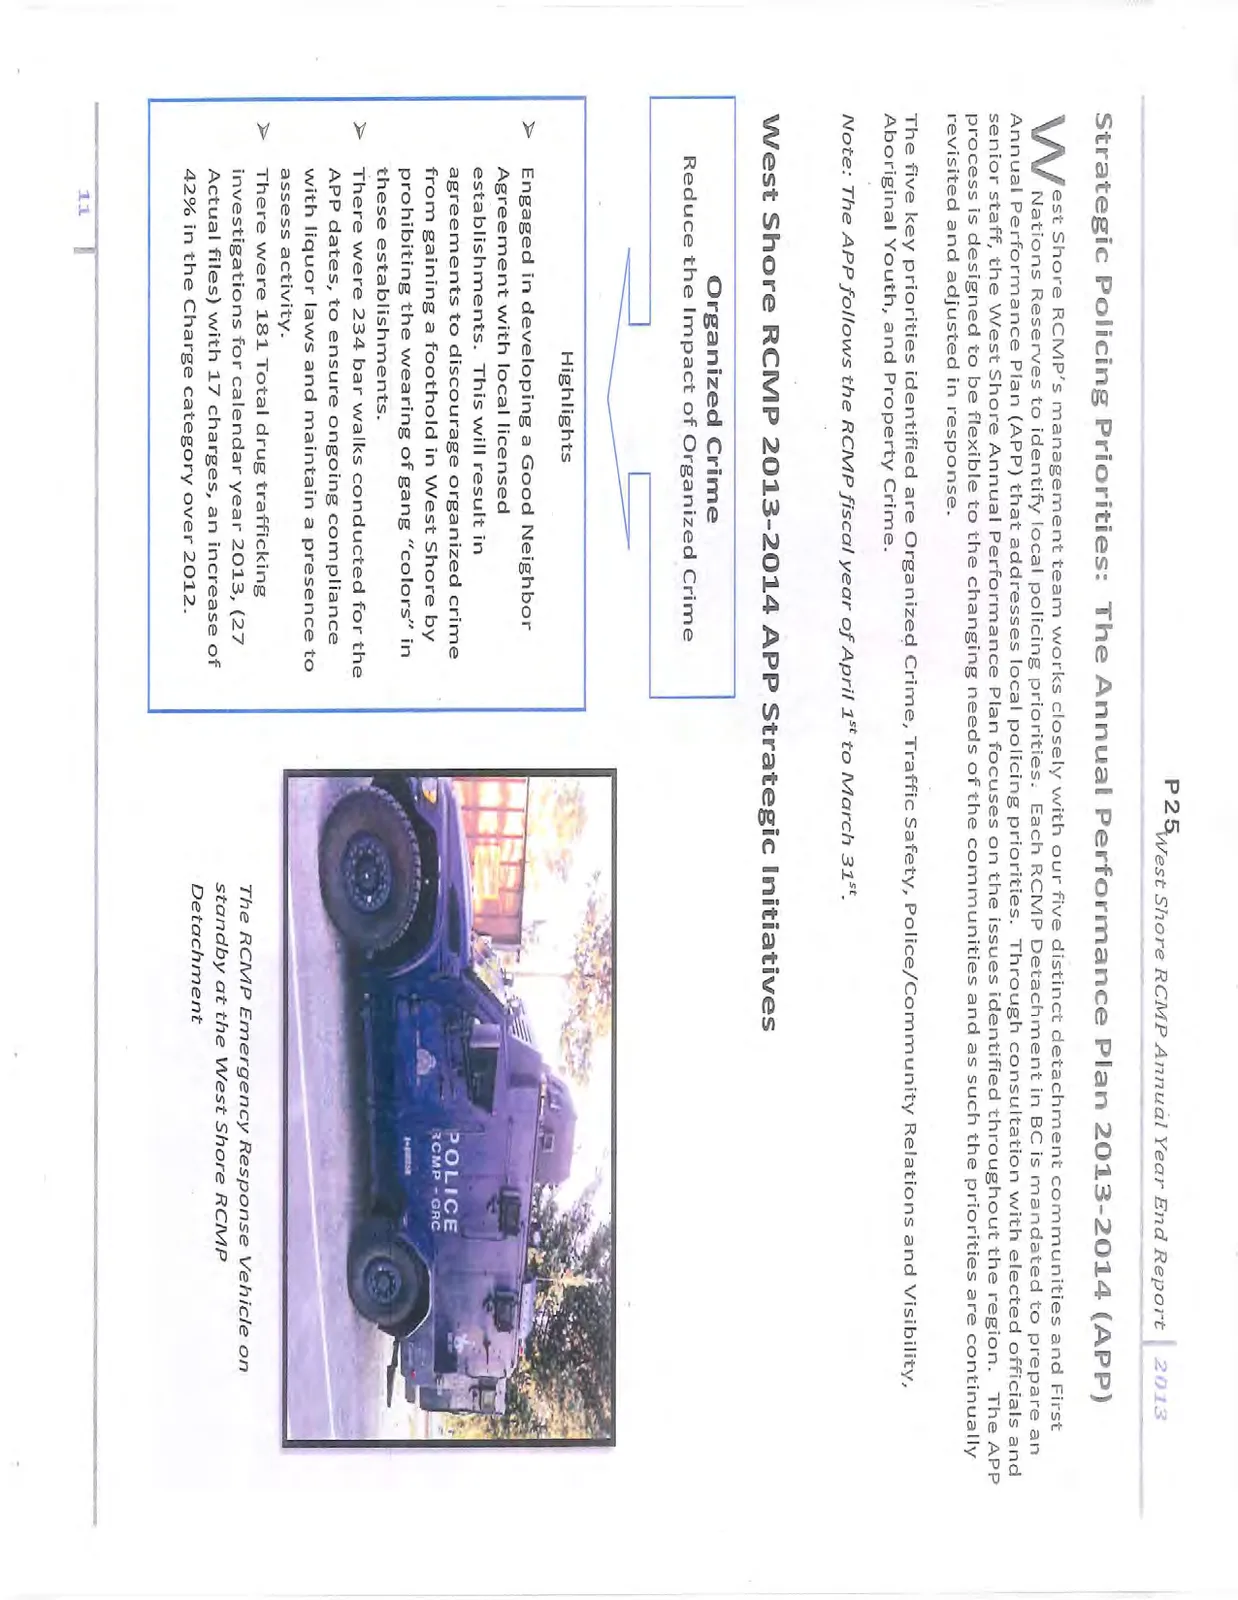
West Shore RCMP's management team works closely with our five distinct detachment communities and First Nations Reserves to identify local policing priorities. Each RCMP Detachment in BC is mandated to prepare an Annual Performance Plan (APP) that addresses local policing priorities. Through consultation with elected officials and senior staff, the West Shore Annual Performance Plan focuses on the issues identified throughout the region. The APP process is designed to be flexible to the changing needs of the communities and as such the priorities are continually revisited and adjusted in response.
The five key priorities identified are Organized Crime, Traffic Safety, Police/Community Relations and Visibility, Aboriginal Youth, and Property Crime.
Note: The APP follows the RCMP fiscal year of April 1st to March 31st.
West Shore RCMP 2013-2014 APP Strategic Initiatives
Organized Crime
Reduce the Impact of Organized Crime
Highlights
- Engaged in developing a Good Neighbor Agreement with local licensed establishments. This will result in agreements to discourage organized crime from gaining a foothold in West Shore by prohibiting the wearing of gang "colors" in these establishments.
- There were 234 bar walks conducted for the APP dates, to ensure ongoing compliance with liquor laws and maintain a presence to assess activity.
- There were 181 Total drug trafficking investigations for calendar year 2013, (27 Actual files) with 17 charges, an increase of 42% in the Charge category over 2012.
Police/Community Relations and Visibility
Community Engagement through Programs, Education and Prevention
Highlights
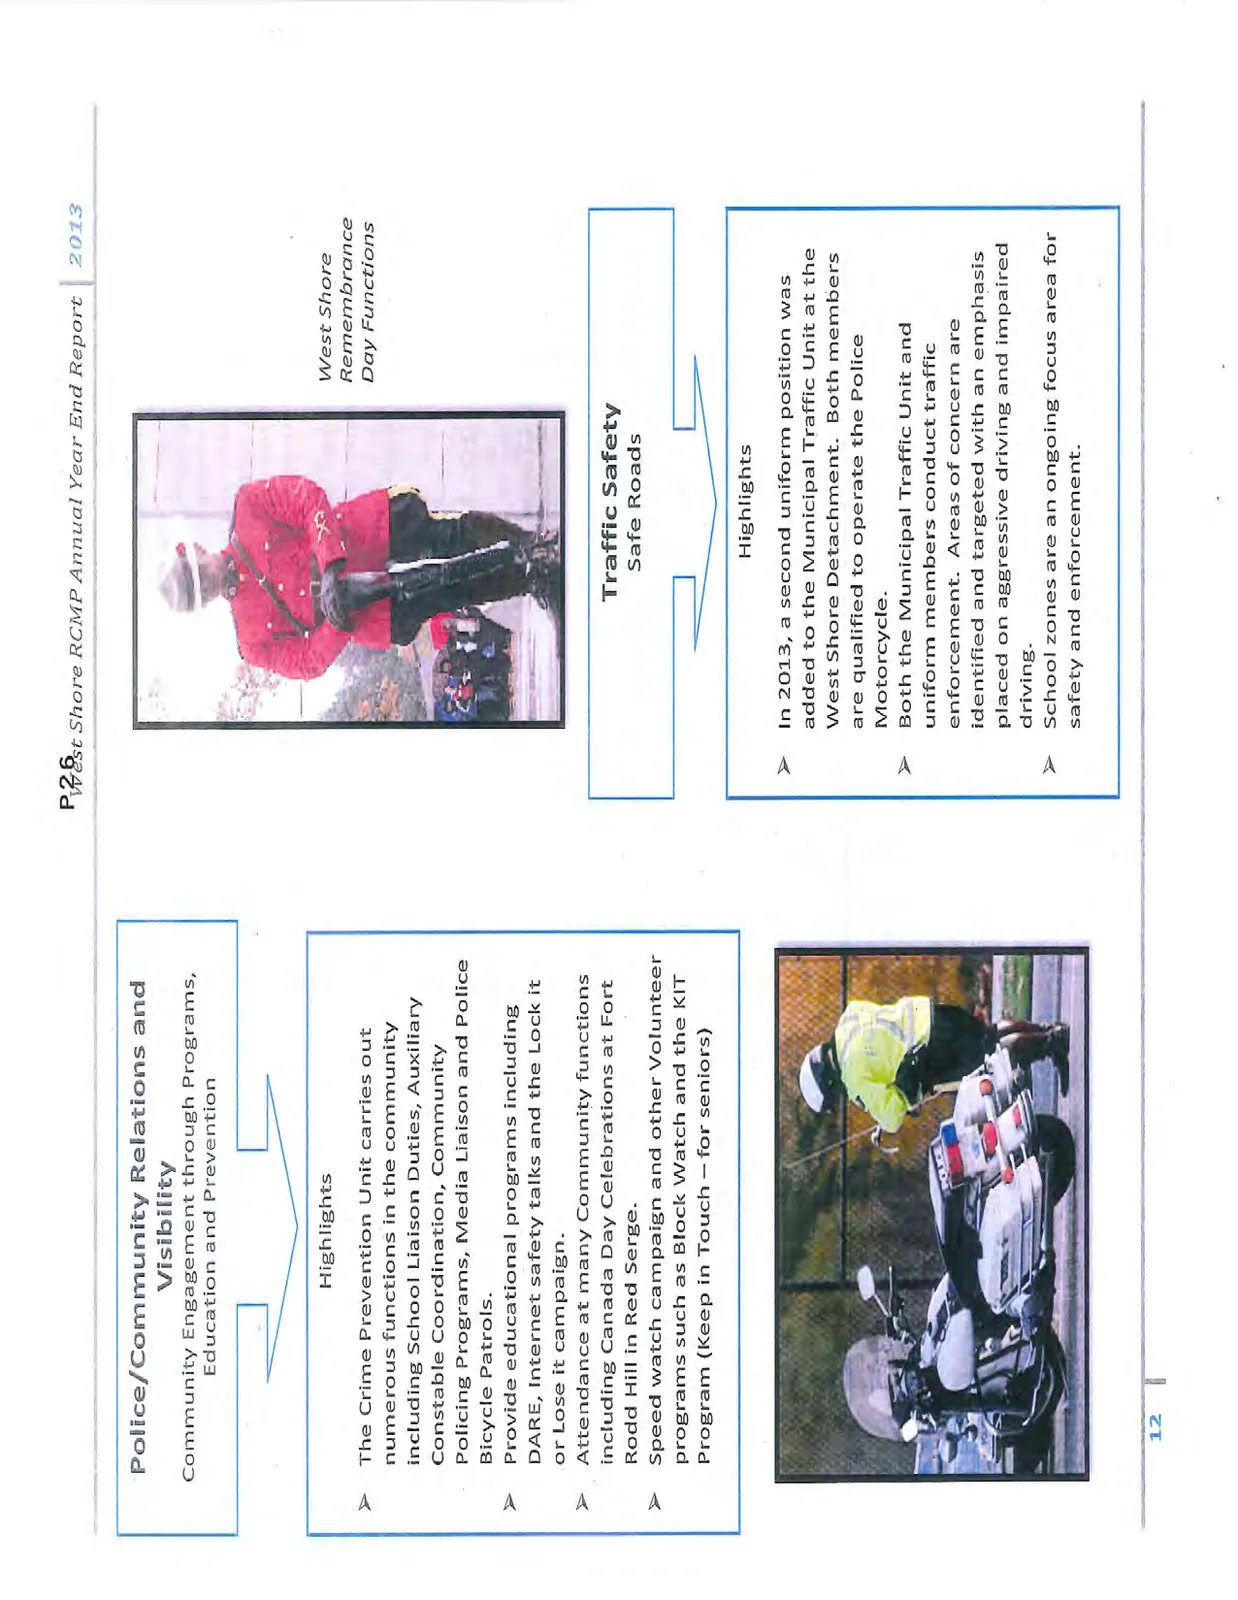
- The Crime Prevention Unit carries out numerous functions in the community including School Liaison Duties, Auxiliary Constable Coordination, Community Policing Programs, Media Liaison and Police Bicycle Patrols.
- Provide educational programs including DARE, Internet safety talks and the Lock it or Lose it campaign.
- Attendance at many Community functions including Canada Day Celebrations at Fort Rodd Hill in Red Serge.
- Speed watch campaign and other Volunteer programs such as Block Watch and the KIT Program (Keep in Touch – for seniors)
Traffic Safety
Safe Roads
Highlights
- In 2013, a second uniform position was added to the Municipal Traffic Unit at the West Shore Detachment. Both members are qualified to operate the Police Motorcycle.
- Both the Municipal Traffic Unit and uniform members conduct traffic enforcement. Areas of concern are identified and targeted with an emphasis placed on aggressive driving and impaired driving.
- School zones are an ongoing focus area for safety and enforcement.
Property Crime
Reduce Property Crime
Highlights
- Reduction in property crime-especially theft from MV.
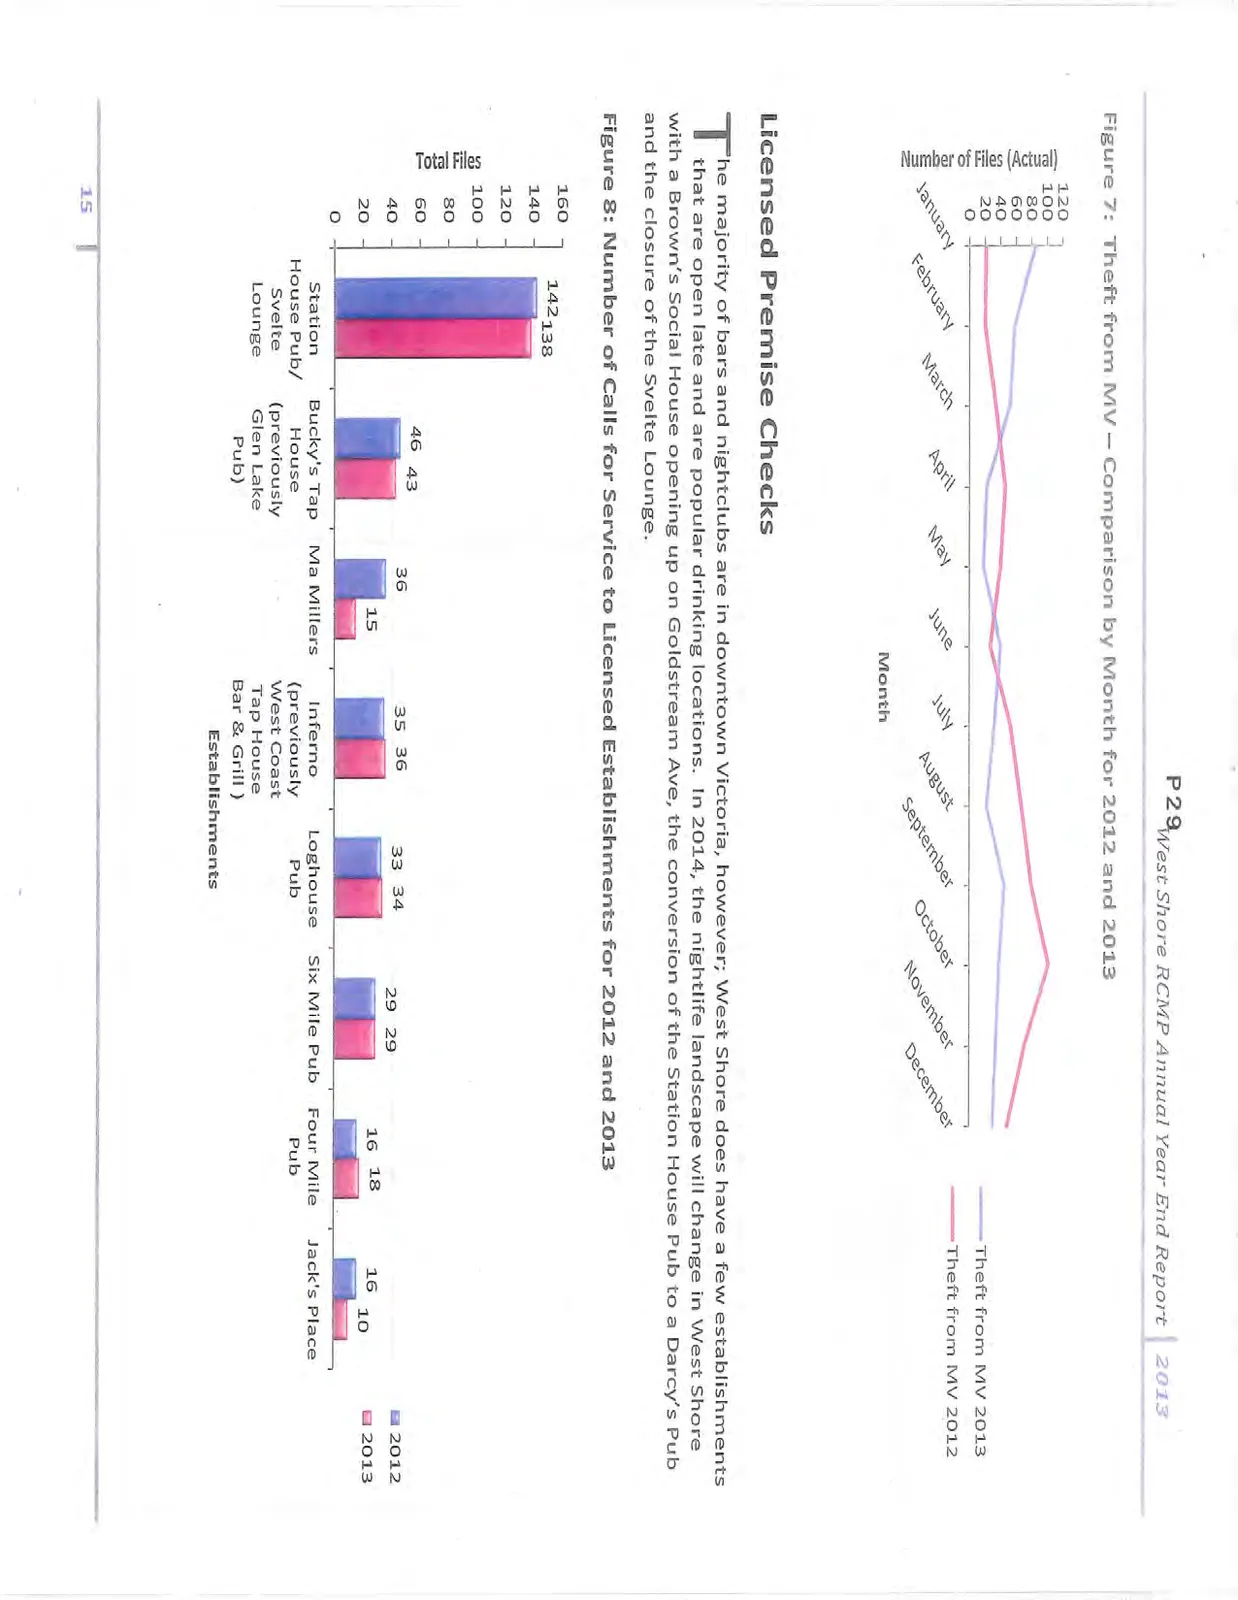
- West Shore initiated the "Lock it or Lose it" campaign by educating people with a note left on their vehicle as a reminder to lock their doors. Theft from MV is down 22% this year from last.
- West Shore RCMP stepped up the curfew check program by actively monitoring individuals placed on court ordered curfew or house arrest. For calendar year 2013, there were 388 curfew checks conducted, and 36 breach charges recommended.
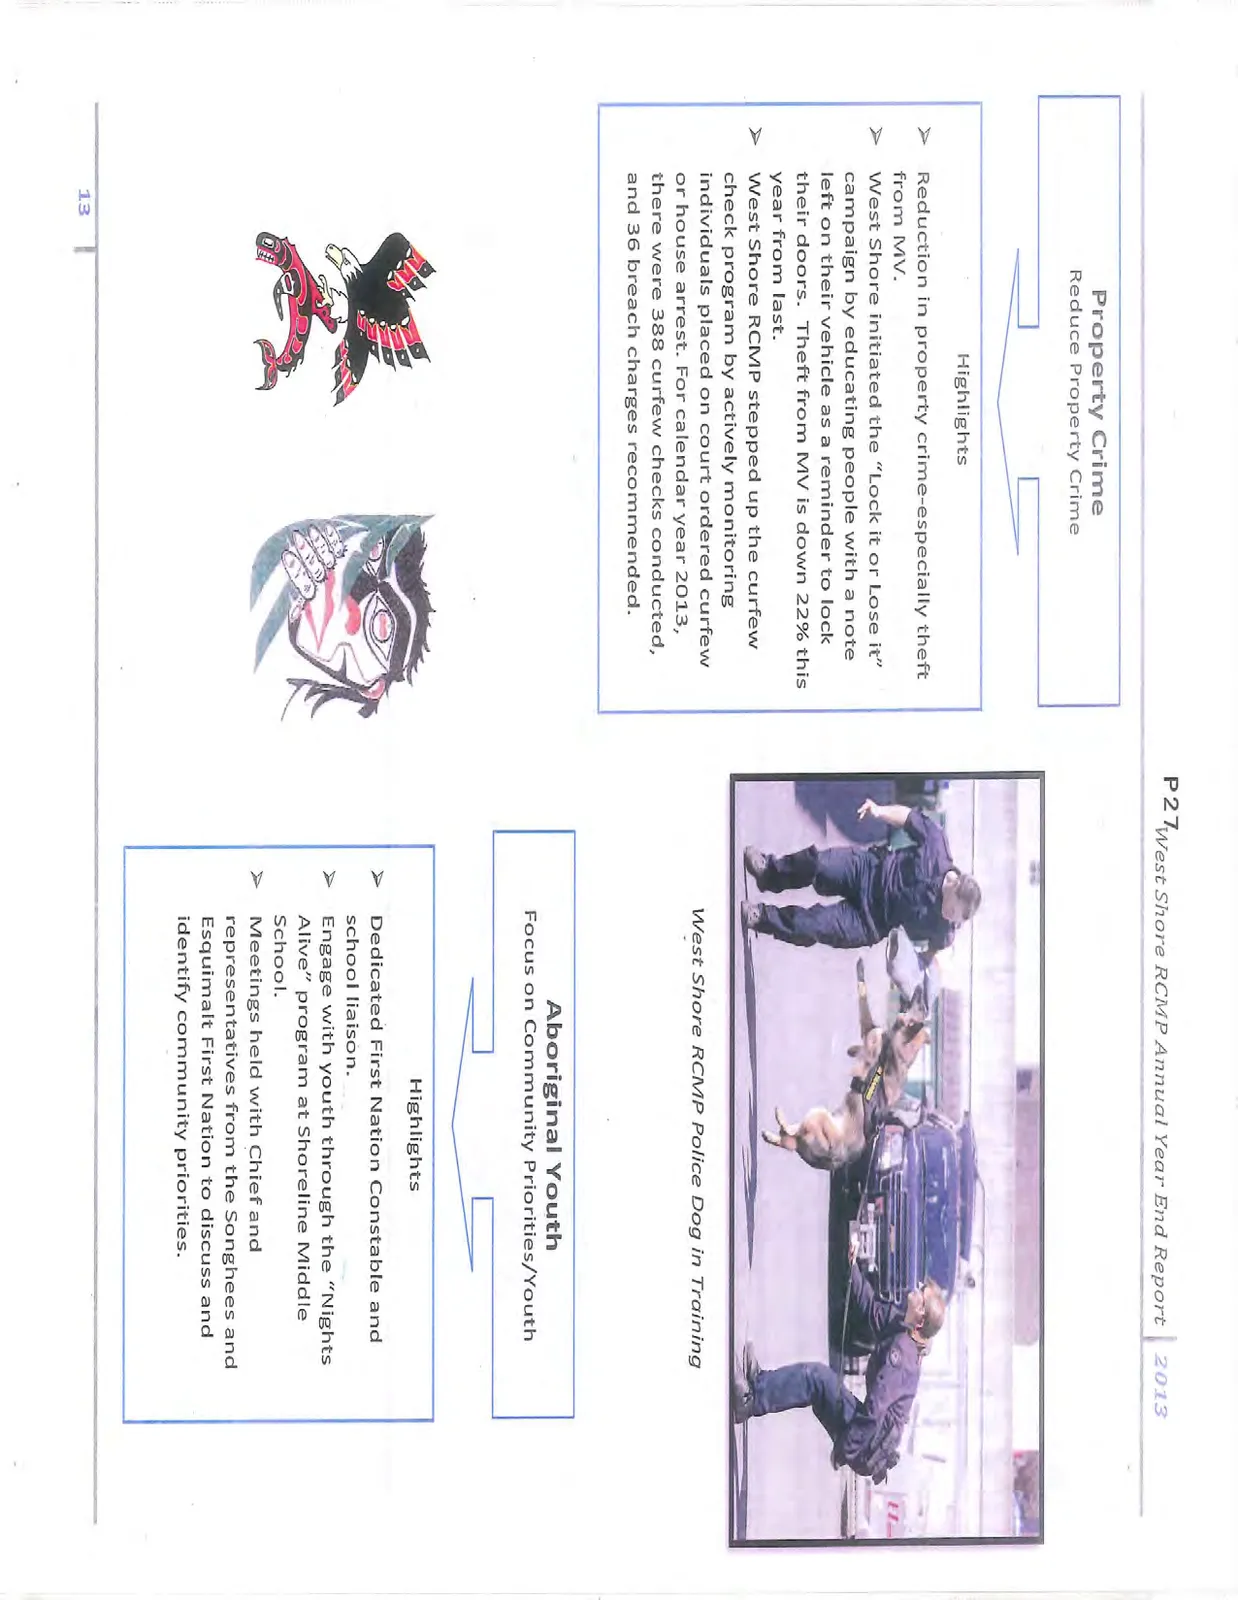
West Shore RCMP Police Dog in Training
Aboriginal Youth
Focus on Community Priorities/Youth
Highlights
- Dedicated First Nation Constable and school liaison.
- Engage with youth through the "Nights Alive" program at Shoreline Middle School.
- Meetings held with Chief and representatives from the Songhees and Esquimalt First Nation to discuss and identify community priorities.
Prolific Offender Management Program (POM)
West Shore RCMP participates in the Prolific Offender Management Program in conjunction with Municipal Police Agencies, Corrections, Probation, Crown, and various Social Agencies throughout the Southern Island Region. The POM program was created due to the emerging consensus that a disproportionate percentage of crime, particularly property crime, is committed by a few select offenders. POM emphasizes inter-agency collaboration as a means to effectively target these individuals, reduce recidivism and increase community safety.
POM targets are selected based on several factors, including the number of police contacts, and are then supported by an integrated team of service providers. Prolific Offenders receive individually tailored support including referrals to employment, housing and income assistance, and assistance with access to mental health and substance abuse treatment. Immediate response to reoffending or breaching conditions is the second component to the strategy with prompt apprehension and conviction with the assistance of Crown Counsel who manages files based on pre-prepared POM templates from Police.
West Shore RCMP manages 4 of the prolific offenders residing in the municipality out of a possible 20 (currently 17) for the Greater Victoria Region. In 2013, 2 of the Prolific Offenders spent most of their time in custody and are currently in custody; 1 was incarcerated and is currently in substance abuse treatment, and 1 is in the community. The reduction in property crime, specifically Theft from MV, can be attributed to the incarceration of West Shore's prolific offenders, and stepped up curfew checks.
Figure 6: Break and Enters - Residential and Business and Theft of MV for 2013 by Month
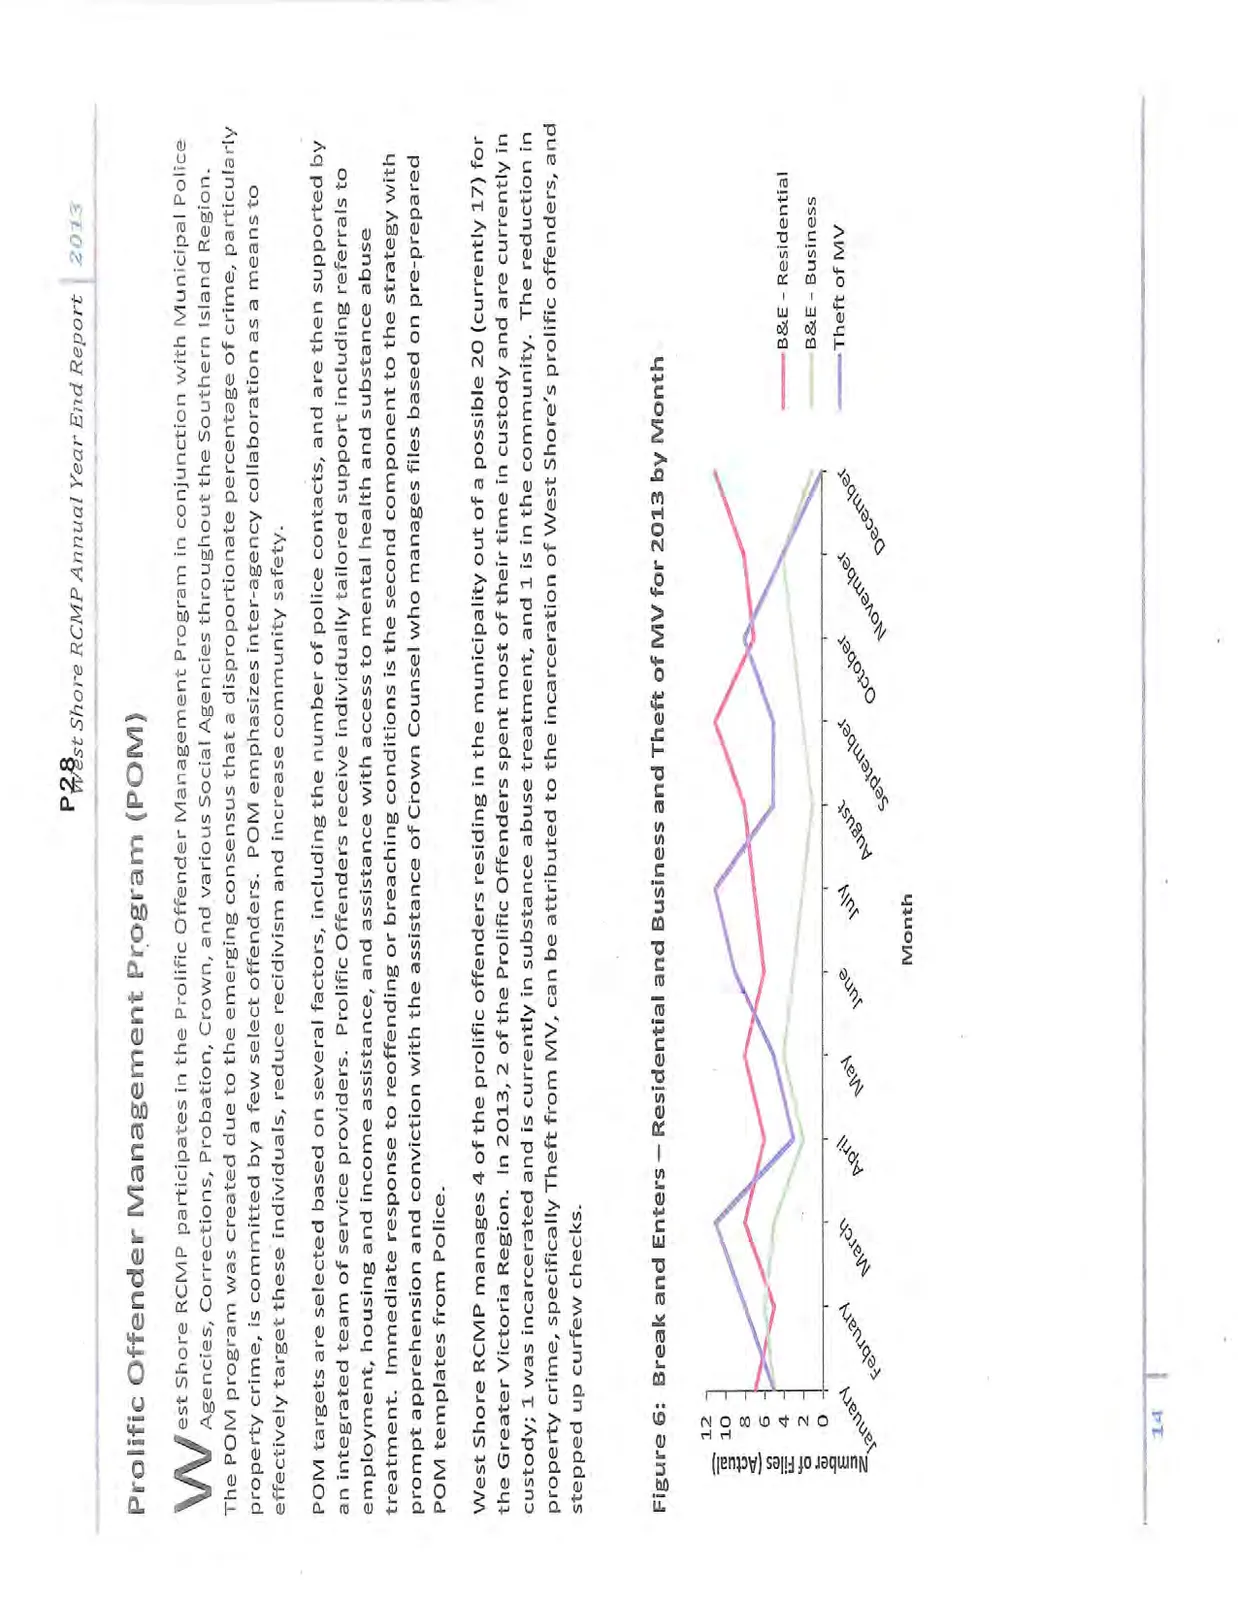
Figure 7: Theft from MV - Comparison by Month for 2012 and 2013
Licensed Premise Checks
The majority of bars and nightclubs are in downtown Victoria, however; West Shore does have a few establishments that are open late and are popular drinking locations. In 2014, the nightlife landscape will change in West Shore with a Brown's Social House opening up on Goldstream Ave, the conversion of the Station House Pub to a Darcy's Pub and the closure of the Svelte Lounge.
Figure 8: Number of Calls for Service to Licensed Establishments for 2012 and 2013
| Establishment | 2012 Calls | 2013 Calls |
|---|---|---|
| Station House Pub/ Svelte Lounge | 142 | 138 |
| Bucky's Tap House (previously Glen Lake Pub) | 46 | 43 |
| Ma Millers | 36 | 15 |
| Inferno (previously West Coast Tap House Bar & Grill) | 35 | 36 |
| Loghouse Pub | 33 | 34 |
| Six Mile Pub | 29 | 29 |
| Four Mile Pub | 16 | 18 |
| Jack's Place | 16 | 10 |
Traffic
Traffic is a priority of the West Shore Detachment. Traffic complaints are some of the most frequent calls for service, including complaints for speeders, bad drivers or possible impaired drivers. Out of 18,569 total calls for service, 1,716 were driving complaints – or 9.2% of all calls.
Figure 9: Non-Fatal Crashes Resulting in Injury, Crashes Resulting in Fatality and Impaired Op of a MV for 2011-2013
| Traffic Offences | 2011 | 2012 | 2013 |
|---|---|---|---|
| Non-Fatal Crashes Resulting in Injury | 205 | 233 | 191 |
| Crashes Resulting in Fatality | 1 | 2 | 1 |
| Impaired Op MV | 146 | 113 | 155 |
In addition to impaired charges, 81 "Warns" were issued. "Warns" include 24hr Drug impairment, 24hr Driving Prohibition and 3, 7 and 30 day Driving Prohibitions (Length of Prohibition is based on previous impaired driving history). A "Warn" is issued when a driver is impaired but does not meet the "fail" threshold.
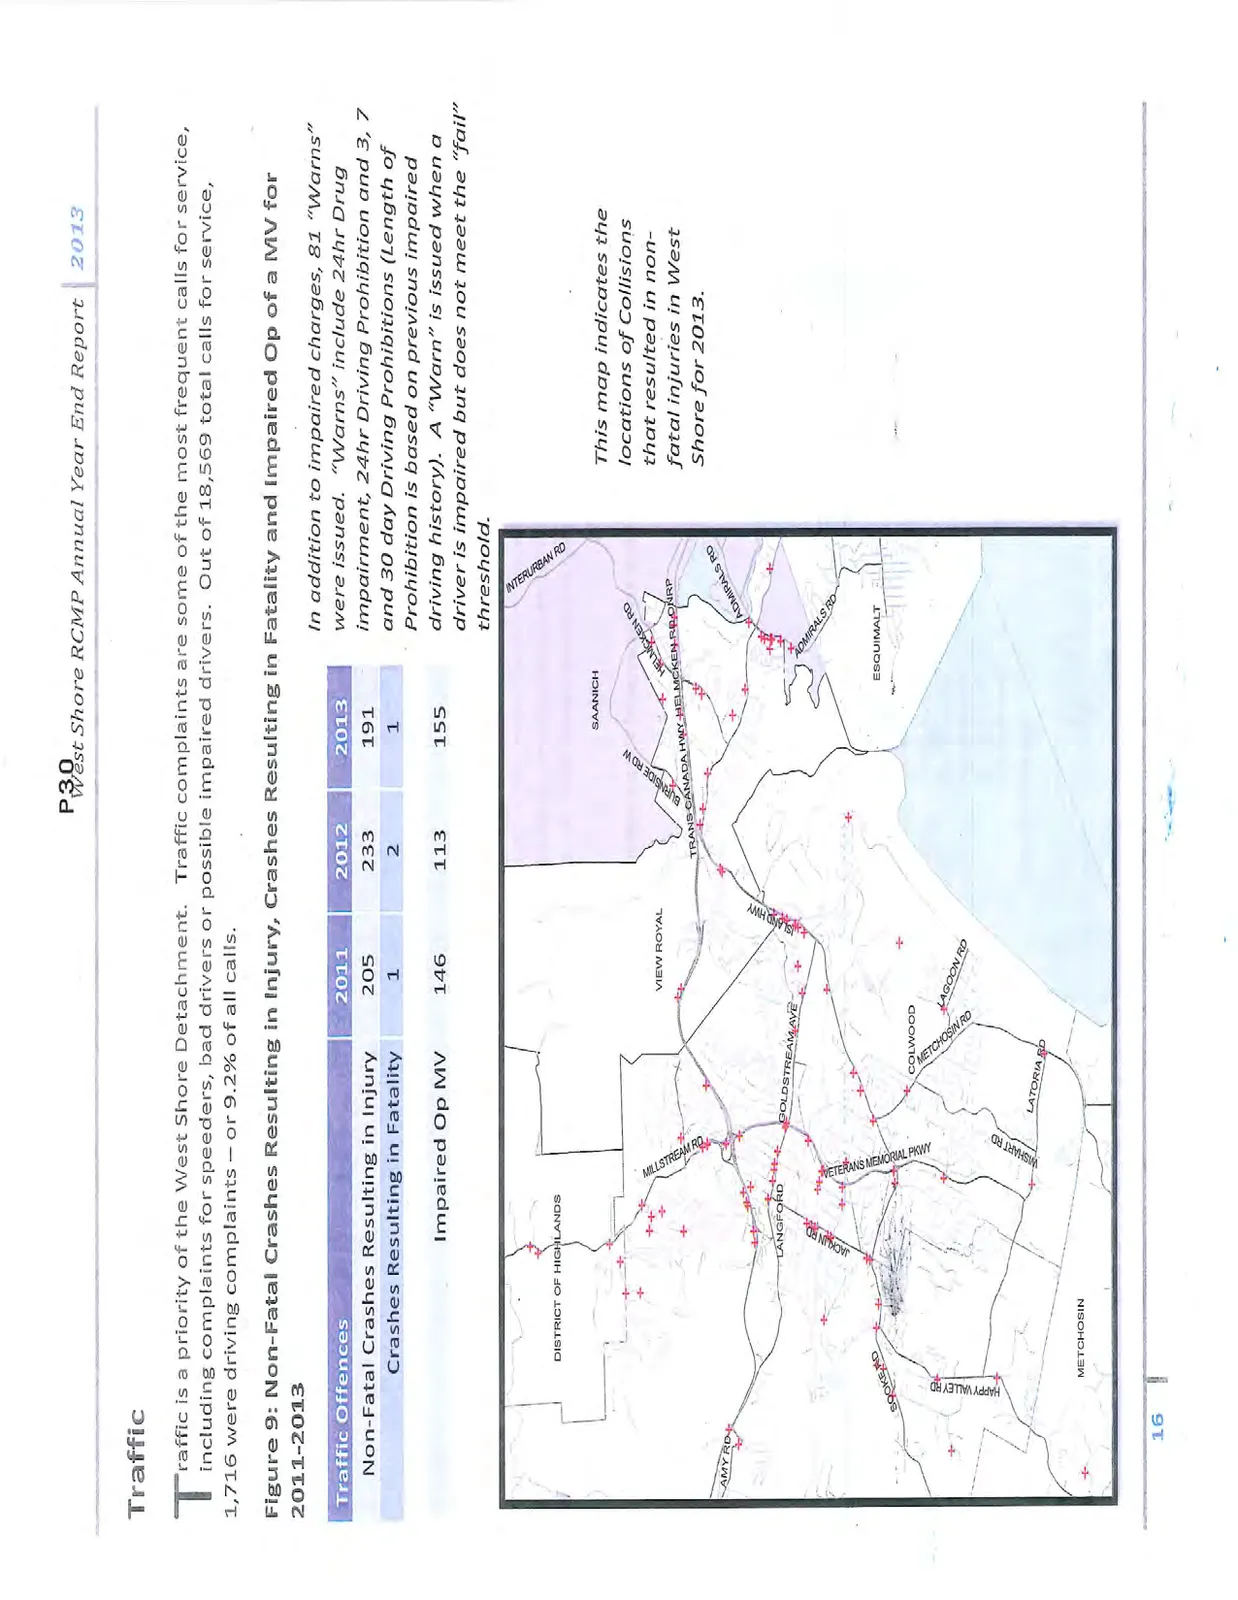
Figure 10: Violation Tickets and Warnings issued by Municipality for 2012-2013
| Year & Ticket Type | Langford | Colwood | View Royal | Metchosin | Highlands | Year Total |
|---|---|---|---|---|---|---|
| 2013 | ||||||
| Violation Tickets | 1131 | 398 | 223 | 79 | 18 | 1849 |
| Warnings | 760 | 397 | 186 | 48 | 50 | 1441 |
| 2012 | ||||||
| Violation Tickets | 824 | 345 | 218 | 39 | 11 | 1437 |
| Warnings | 586 | 283 | 162 | 20 | 3 | 1054 |
Figure 11: Number of Violations Tickets Issued for 2012-2013
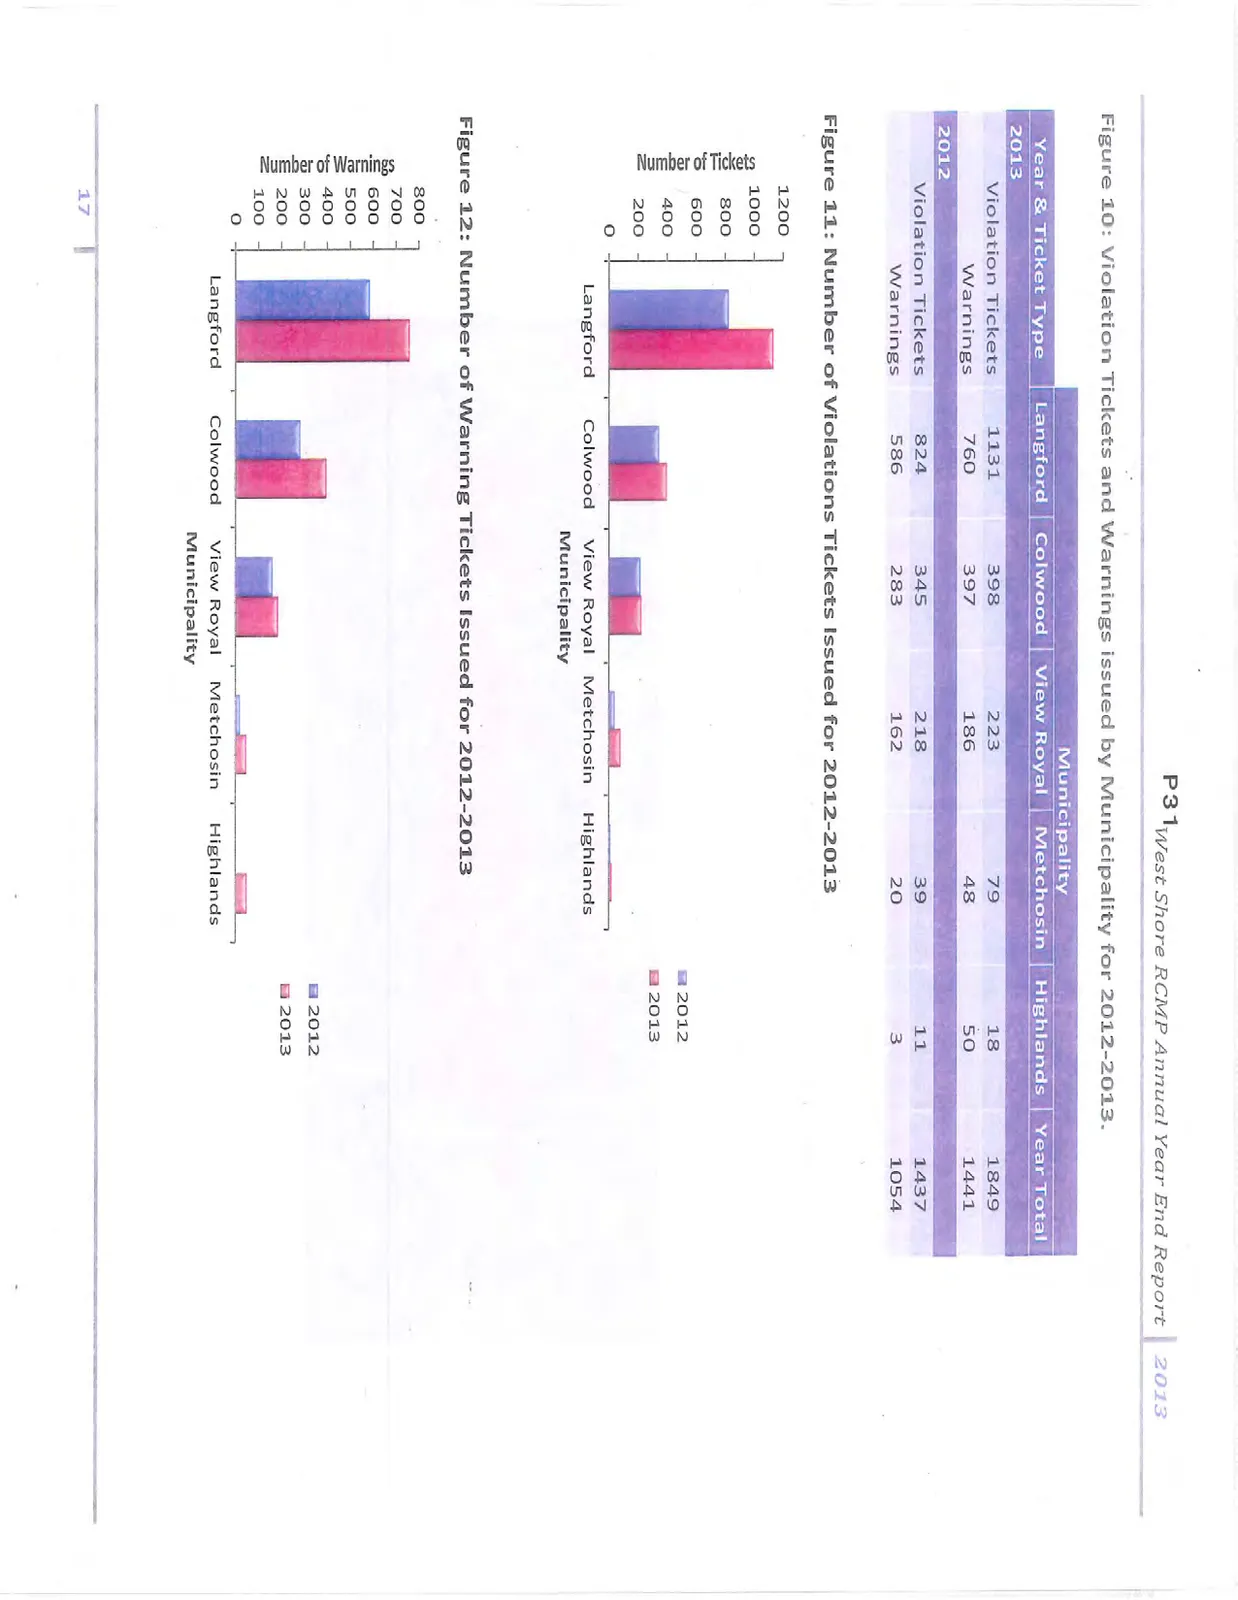
Figure 12: Number of Warning Tickets Issued for 2012-2013
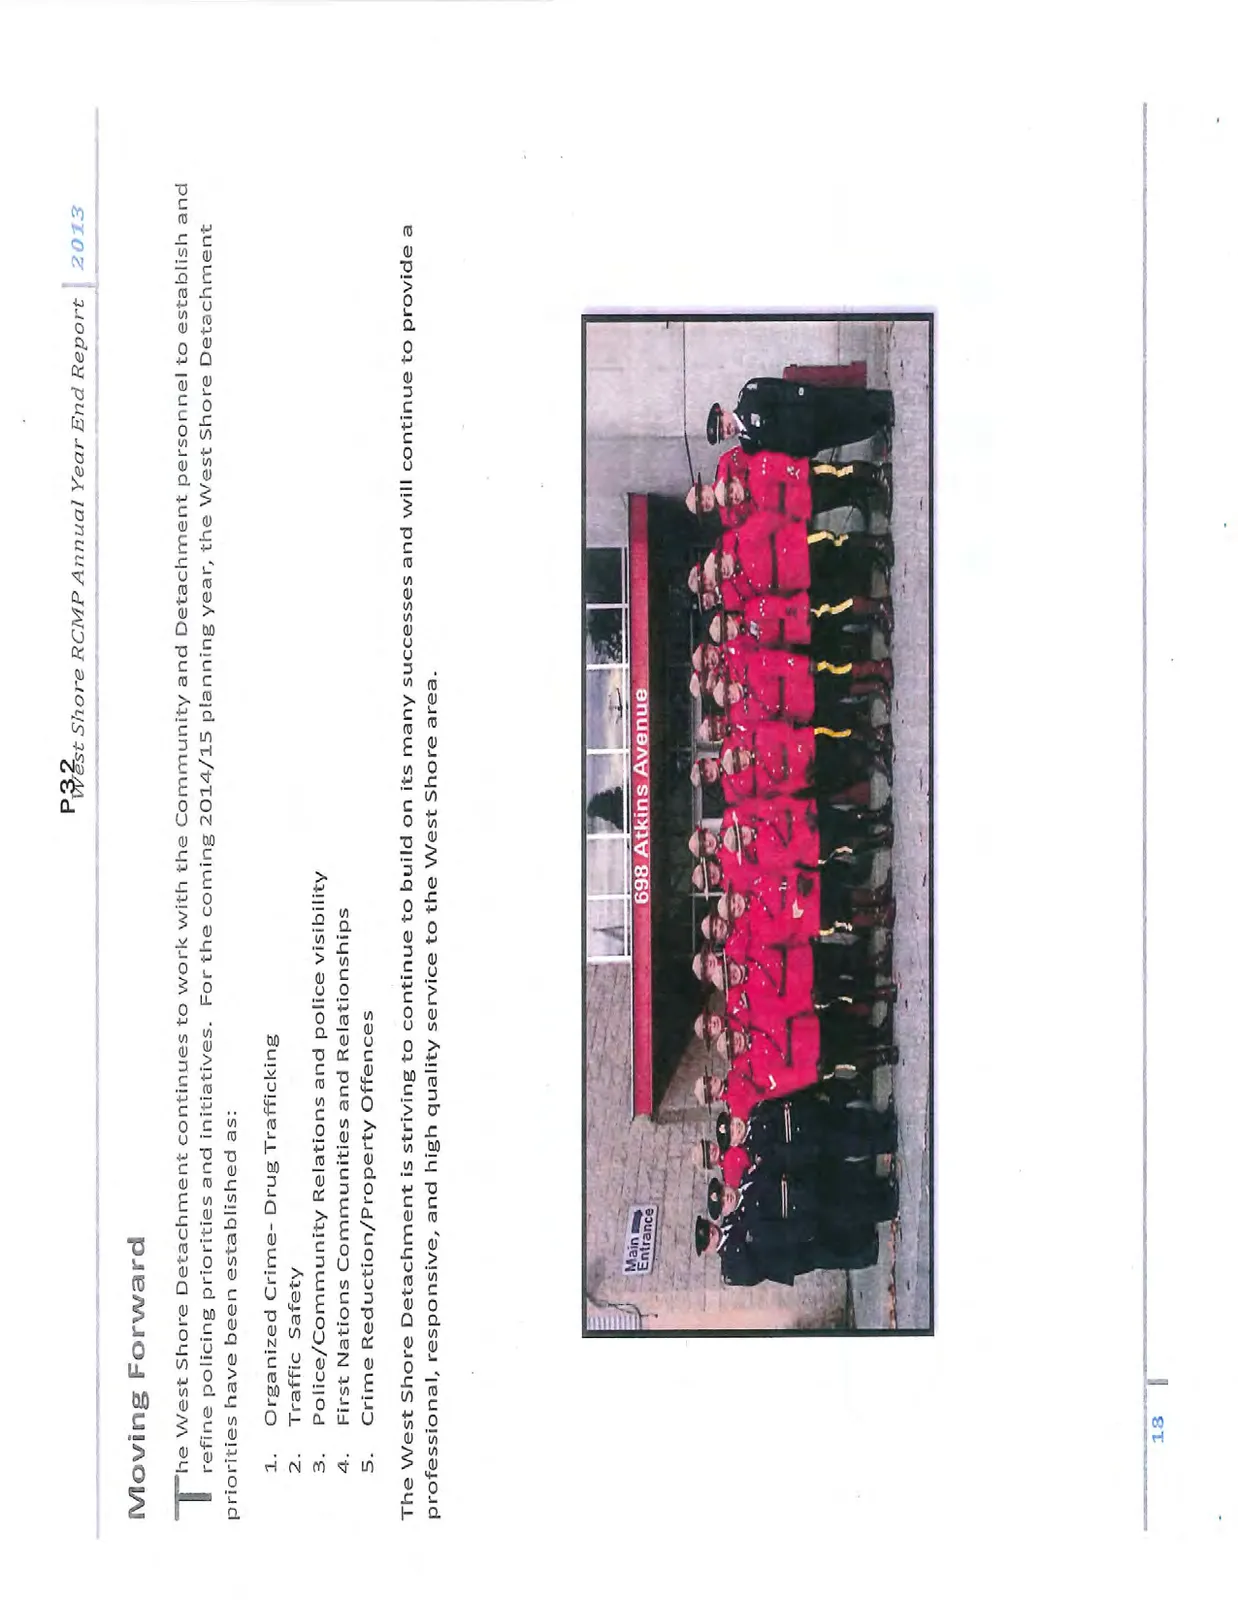
Moving Forward
The West Shore Detachment continues to work with the Community and Detachment personnel to establish and refine policing priorities and initiatives. For the coming 2014/15 planning year, the West Shore Detachment priorities have been established as:
- Organized Crime- Drug Trafficking
- Traffic Safety
- Police/Community Relations and police visibility
- First Nations Communities and Relationships
- Crime Reduction/Property Offences
The West Shore Detachment is striving to continue to build on its many successes and will continue to provide a professional, responsive, and high quality service to the West Shore area.
Document Images
(3)