CASINO REVENUE BY QUARTER REPORT
Report detailing historical and 2013 actual casino revenue received by the Town from the Ministry of Energy, Mines and Natural Gas.
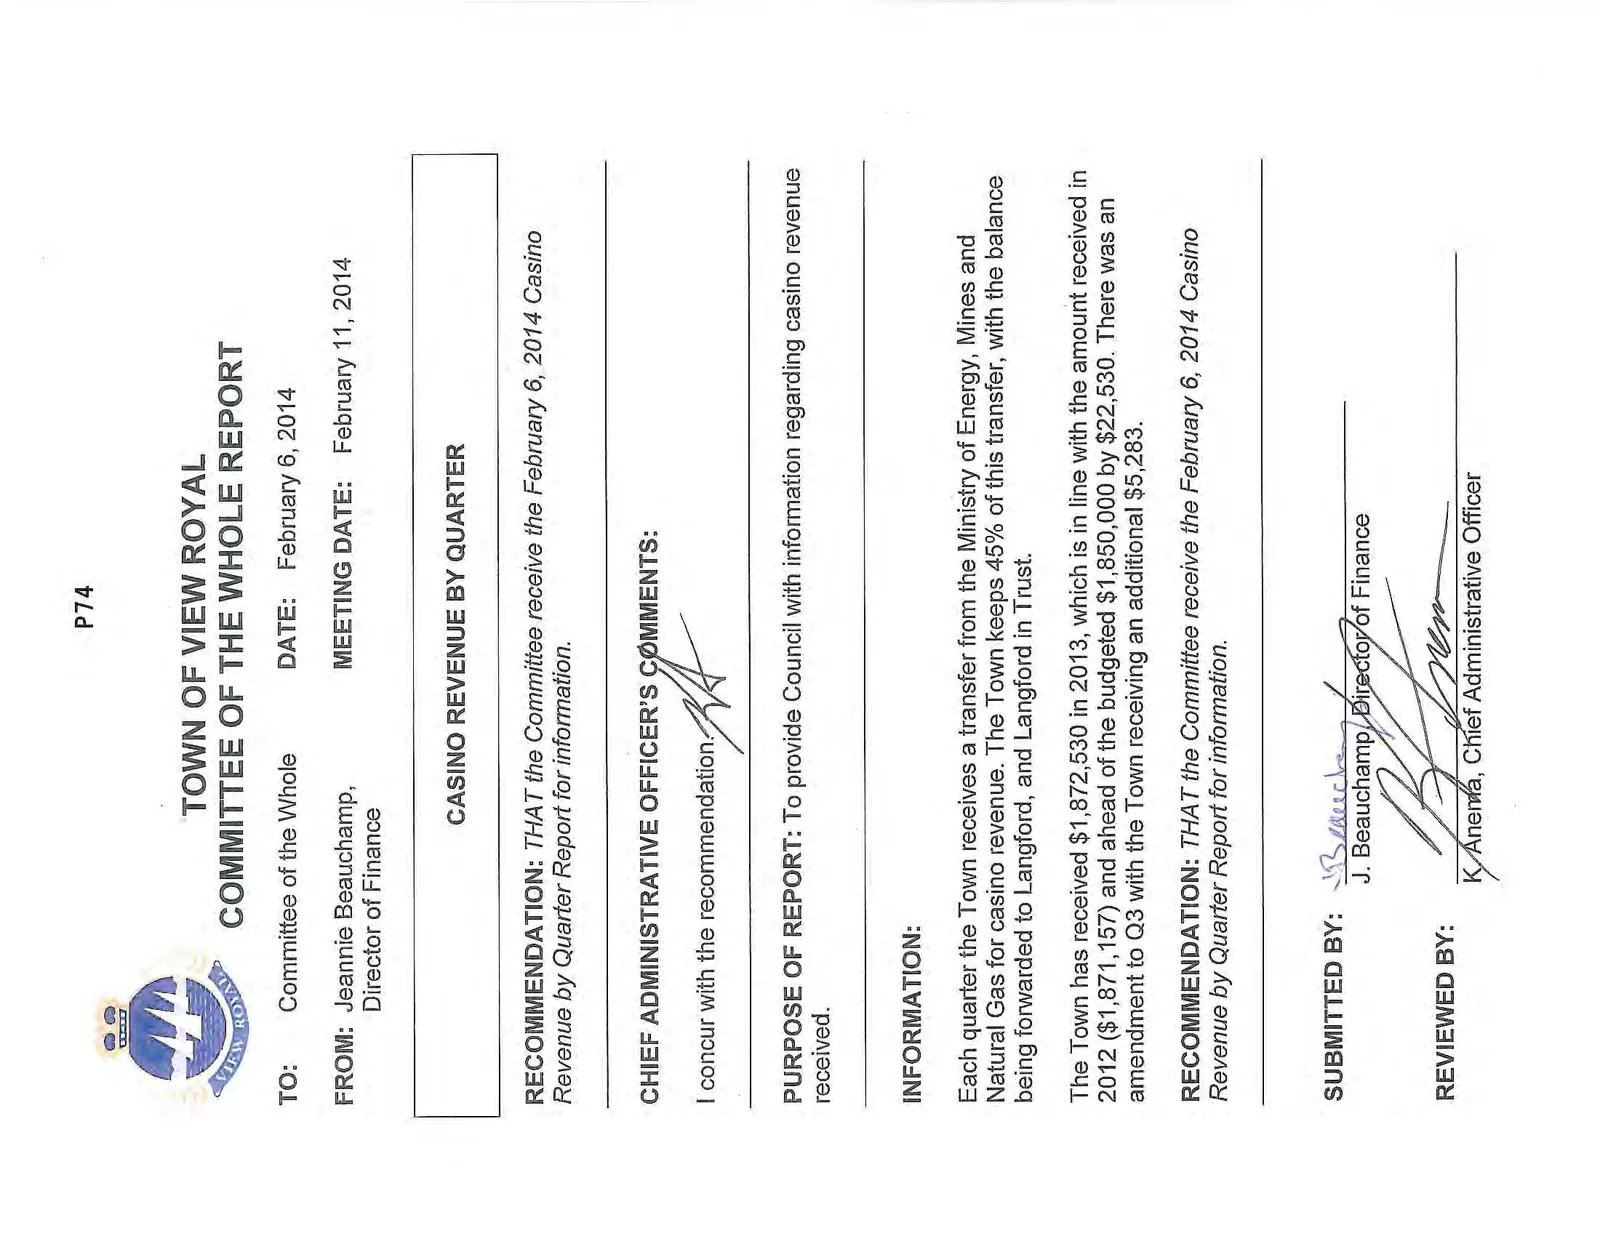
TOWN OF VIEW ROYAL COMMITTEE OF THE WHOLE REPORT
TO: Committee of the Whole DATE: February 6, 2014 FROM: Jeannie Beauchamp, Director of Finance MEETING DATE: February 11, 2014
CASINO REVENUE BY QUARTER
RECOMMENDATION: THAT the Committee receive the February 6, 2014 Casino Revenue by Quarter Report for information.
CHIEF ADMINISTRATIVE OFFICER'S COMMENTS: I concur with the recommendation.
PURPOSE OF REPORT: To provide Council with information regarding casino revenue received.
INFORMATION: Each quarter the Town receives a transfer from the Ministry of Energy, Mines and Natural Gas for casino revenue. The Town keeps 45% of this transfer, with the balance being forwarded to Langford, and Langford in Trust.
The Town has received $1,872,530 in 2013, which is in line with the amount received in 2012 ($1,871,157) and ahead of the budgeted $1,850,000 by $22,530. There was an amendment to Q3 with the Town receiving an additional $5,283.
RECOMMENDATION: THAT the Committee receive the February 6, 2014 Casino Revenue by Quarter Report for information.
SUBMITTED BY: J. Beauchamp, Director of Finance
REVIEWED BY: K. Anema, Chief Administrative Officer
Town of View Royal Casino Revenue by Quarter
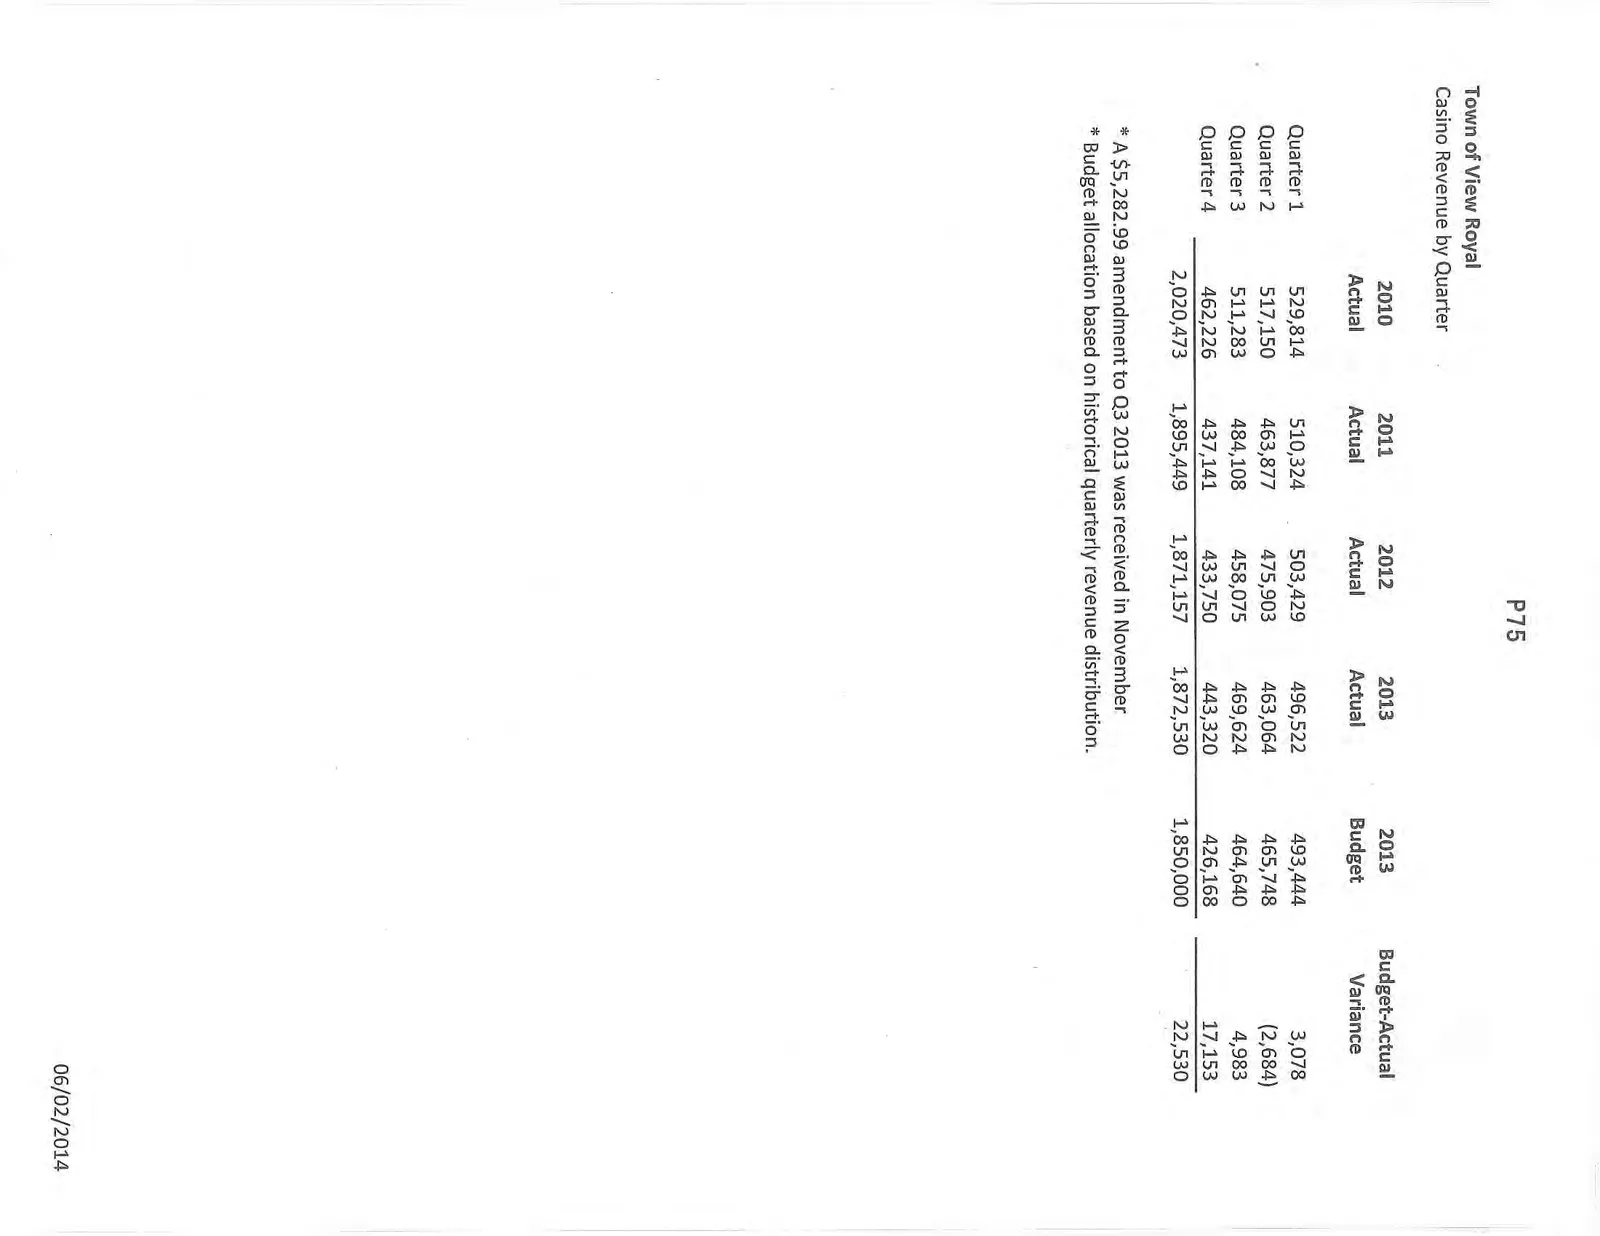
| 2010 Actual | 2011 Actual | 2012 Actual | 2013 Actual | 2013 Budget | Budget-Actual Variance | |
|---|---|---|---|---|---|---|
| Quarter 1 | 529,814 | 510,324 | 503,429 | 496,522 | 493,444 | 3,078 |
| Quarter 2 | 517,150 | 463,877 | 475,903 | 463,064 | 465,748 | (2,684) |
| Quarter 3 | 511,283 | 484,108 | 458,075 | 469,624 | 464,640 | 4,983 |
| Quarter 4 | 462,226 | 437,141 | 433,750 | 443,320 | 426,168 | 17,153 |
| Total | 2,020,473 | 1,895,449 | 1,871,157 | 1,872,530 | 1,850,000 | 22,530 |
- A $5,282.99 amendment to Q3 2013 was received in November
- Budget allocation based on historical quarterly revenue distribution.
Document Images
(1)