Attachment 1: View Royal Land Economics Study (2021)
A 2021 study by Coriolis Consulting Corp. evaluating the market demand and financial viability for various types of development in View Royal.
View Royal Land Economics Study: Evaluation of the Prospects for New Urban Development
28 June 2021
Prepared for: Town of View Royal By: coriolis CONSULTING CORP.
Table of Contents
1.0 Introduction 1.1 Background 1.2 Report Structure 1.3 Glossary of Key Terms 1.4 Assumptions and Limitations 1.5 Professional Disclaimer 2.0 Projected Demand for New Urban Development in View Royal 2.1 Population Projections 2.2 Retail and Service Analysis 2.3 Office Analysis 2.4 Potential Hotel Room Demand in View Royal 2.5 Apartment Analysis 2.6 Overall Summary of Market Projections 3.0 Interviews with Industry Representatives 4.0 Economics of Redevelopment 4.1 Approach to Analysis 4.2 Case Study Sites Analyzed 4.3 Key Assumptions 4.4 Summary of Results of Financial Analysis 4.5 Implications of Financial Analysis 5.0 Potential Strategies to Encourage Redevelopment of Under-Utilized Properties 5.1 Incentives 5.2 Disincentives 6.0 Recommendations 6.1 Land Use by Subarea 6.2 Other Items 7.0 Attachments
1.0 Introduction
1.1 Background
The Town of View Royal is in the process of updating its Official Community Plan (OCP). The existing OCP identifies a number of locations for commercial or intensive mixed use development. Each location has a significant number of properties that are under-utilized and may be candidates to accommodate higher density commercial, residential or mixed use development. The key locations currently identified for commercial or mixed use development in the Town are:
- The Hospital precinct (in the Hospital Neighbourhood).
- The Future Town Centre (in the Helmcken Neighbourhood).
- The Island Highway corridor (in the Wilfert Neighbourhood).
In addition, the OCP designates other locations in the Town for neighbourhood mixed use or mixed residential. These areas are also intended to accommodate multifamily residential and mixed use development.
Exhibit 1 show shows the locations of the different neighbourhoods in the Town, including the three neighbourhoods that are the focus of this study.
Exhibit 1 – View Royal Neighbourhoods
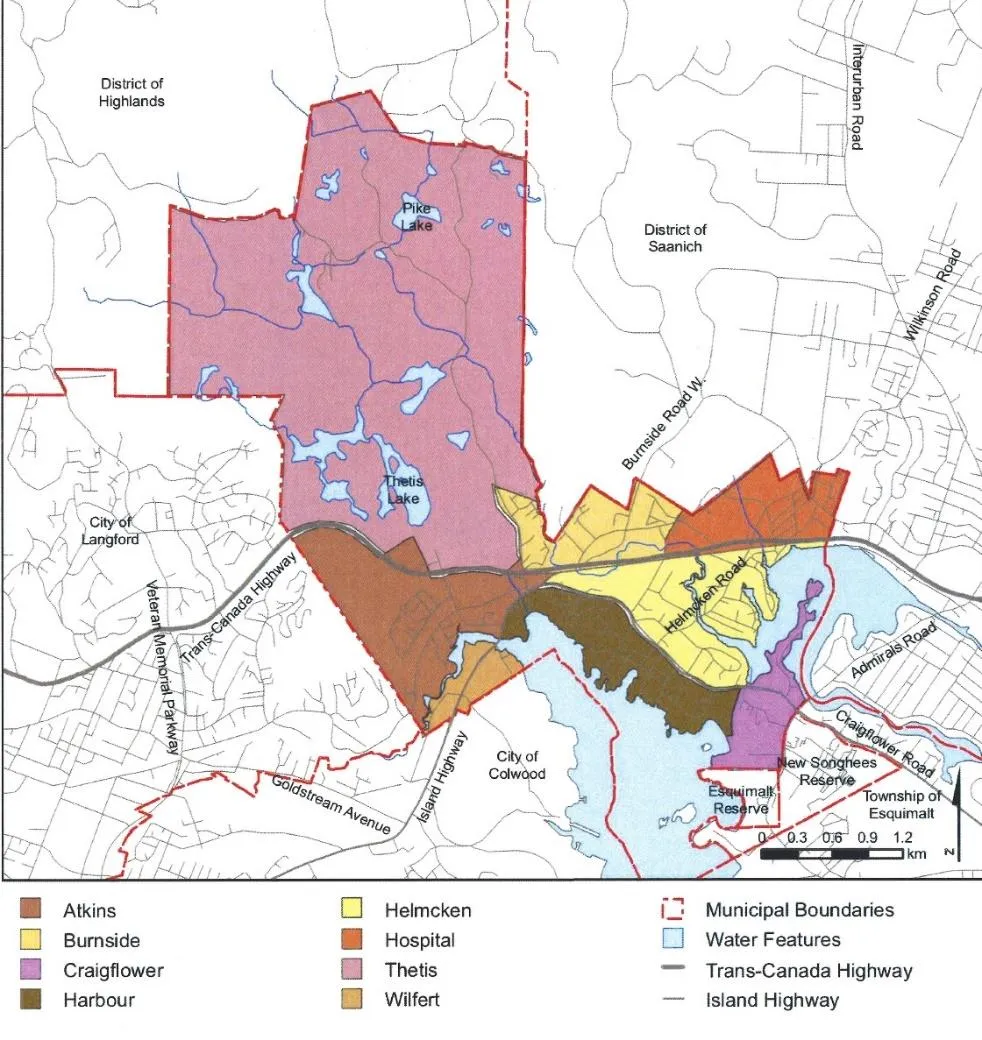
Source: Town of View Royal
1.2 Report Structure
This report is structured as follows:
- Section 2.0 summarizes our assessment of the market opportunities for new development in the Town and our demand projections by use for the next 20 years or so.
- Section 3.0 summarizes our interviews with industry representatives including the South Island Prosperity Partnership, West Shore Chamber of Commerce and Urban Development Institute.
- Section 4.0 contains our analysis of the financial viability of redevelopment in the Town, including the uses, building heights and densities likely needed to make different types of projects financially viable for private developers.
- Section 5.0 evaluates some specific tools that the Town could consider to encourage the redevelopment of under-utilized properties.
- Section 6.0 summarizes our recommendations.
1.3 Glossary of Key Terms
There are a variety of terms used in this report that are often used when discussing city planning and development economics:
- Floorspace Ratio (FSR). This is an expression of the density permitted on a property. It is the ratio of the amount of permitted floorspace divided by the total lot area.
- Prezoning. This means that the municipality rezones properties in advance so that there is no need for a developer to go through a rezoning process for an application that is consistent with the OCP designation.
- Mixed use. This describes a project that includes commercial space at grade (usually retail or service) with apartment units or office space on the upper floors. Alternatively, a mixed use project could include stand alone residential buildings and stand alone commercial buildings on the same site.
- Infill unit. This term is used to describe ground oriented attached housing units built within an existing single family neighbourhood. Typical forms are duplex, triplex and quadruplex units.
- CAC. Community Amenity Contributions are voluntary contributions made by an applicant as part of the rezoning approval process. CACs can take the form of cash contributions or in-kind on site amenities.
- DCC. Development Cost Charges are a fee levied at building permit (or subdivision) on new projects to fund infrastructure and park space. View Royal has a DCC Bylaw that specifies the rates for different types of new projects.
- Hard construction costs. This is defined as the project costs paid to the general contractor to construct the project.
- Soft costs. This includes many of the additional costs incurred to construct a project other than the hard construction costs. It includes professional fees for architects, engineers, designers, legal fees, insurance, warranties, management, appraisals, surveying, other consultants, and municipal permits.
- Profit margin. The profit generated on a new project expressed as percentage of total project costs, assuming the project is sold upon completion.
1.4 Assumptions and Limitations
This market study and financial analysis was completed during 2020 and early 2021 during the COVID-19 pandemic. The pandemic will likely have impacts on the demand for commercial space (office, retail and hotel), particularly in the short term. For example, the following factors could affect the demand for commercial space:
- Businesses may allow more employees to work remotely.
- Businesses may elect to increase the space per office worker to allow distancing.
- Office developers may have difficulty pre-leasing new office space.
- Commuters may want to avoid public transit.
- Consumers may shift increasingly toward online shopping rather than shopping at traditional stores.
- Tourism volumes will drop.
- The economy may experience a recession.
The long term impacts will depend on the duration of the pandemic and whether effective medical therapies or vaccines become available. At this time, it is not possible to determine the likely long term impacts on demand for commercial space. The forecasts in this report assume that any negative impacts are short term (i.e. 2 years or less) and that any long term impacts on demand are not significant.
1.5 Professional Disclaimer
This document may contain estimates and forecasts of future growth and urban development prospects, estimates of the financial performance of possible future urban development projects, opinions regarding the likelihood of approval of development projects, and recommendations regarding development strategy or municipal policy. All such estimates, forecasts, opinions, and recommendations are based in part on forecasts and assumptions regarding population change, economic growth, policy, market conditions, development costs and other variables. The assumptions, estimates, forecasts, opinions, and recommendations are based on interpreting past trends, gauging current conditions, and making judgments about the future. As with all judgments concerning future trends and events, however, there is uncertainty and risk that conditions change or unanticipated circumstances occur such that actual events turn out differently than as anticipated in this document, which is intended to be used as a reasonable indicator of potential outcomes rather than as a precise prediction of future events.
Nothing contained in this report, express or implied, shall confer rights or remedies upon, or create any contractual relationship with, or cause of action in favor of, any third party relying upon this document.
In no event shall Coriolis Consulting Corp. be liable to the Town of View Royal or any third party for any indirect, incidental, special, or consequential damages whatsoever, including lost revenues or profits.
2.0 Projected Demand for New Urban Development in View Royal
The first step in our work included an assessment of the market demand for new development in the Town. The uses that tend to account for most of the new development in the region are considered in the demand projections, including:
- Retail and service.
- Office.
- Apartment.
- Hotel.
This section summarizes the results of the market projections for each use and the key implications.
In order for new development to occur there needs to be market demand. However, demand on its own will not necessarily lead to new development. In order for development to proceed, it needs to be permitted under the Town’s land use policies and it needs to be financially viable. The financial viability of new development is evaluated in Section 4.0.
2.1 Population Projections
Demand for new commercial space and housing units is linked to the pace of population growth in a community. Therefore, as a first step, we produced population forecasts that are the basis for the demand projections contained in this report. Our population forecasts focus on a few different geographic areas:
- A forecast for the Town of View Royal.
- A forecast for the commercial trade area for View Royal. The commercial trade area can be divided into two different subareas:
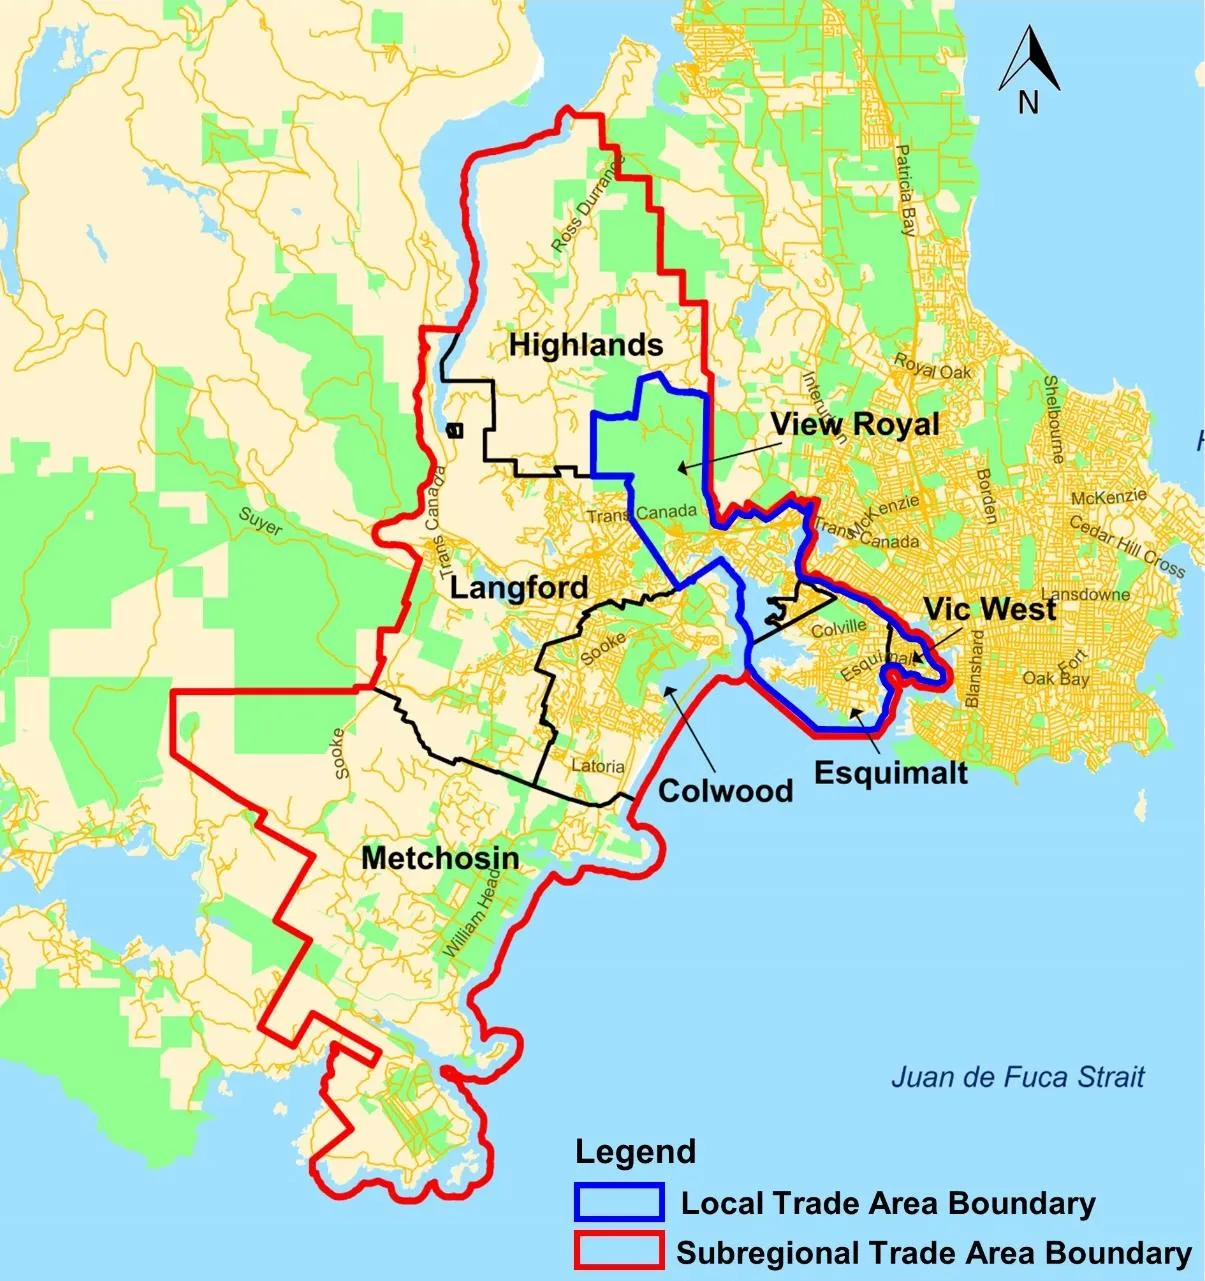
- A local trade area that includes View Royal, Esquimalt and Vic West. Residents of these communities likely do most of their day to day shopping (i.e., spending at supermarkets, pharmacies, services) within this trade area.
- A broader subregional commercial trade area that includes View Royal, Esquimalt, Vic West, Colwood, Langford, Highlands and Metchosin. Some of the larger businesses (or specialized businesses) in View Royal draw customers from this broader geographic trade area. In addition, new residential projects in View Royal compete primarily with other new projects within this broader subregional area.
- A forecast for the entire Capital Regional District (CRD).
Exhibit 2 shows the approximate boundaries for the local and subregional trade areas.
Exhibit 2: Boundaries of Geographic Areas
To complete the population projections, we reviewed information about historic population growth in each municipality in the Capital Region District (CRD) as well as available population projections from BC Stats and the CRD.
Exhibit 3 summarizes our population projections for View Royal, the local commercial trade area, the subregional trade area, and the CRD from 2019 to 2040.
Exhibit 3: Population Projections from 2019-2040
| Area | 2019 | 2020 | 2025 (Projected) | 2030 (Projected) | 2035 (Projected) | 2040 (Projected) |
|---|---|---|---|---|---|---|
| View Royal | 11,318 | 11,533 | 12,671 | 13,921 | 15,146 | 16,478 |
| Esquimalt | 18,716 | 18,959 | 20,224 | 21,573 | 22,674 | 23,830 |
| Victoria West | 8,138 | 8,301 | 9,165 | 10,119 | 10,901 | 11,744 |
| Local Trade Area | 38,172 | 38,794 | 42,060 | 45,614 | 48,721 | 52,052 |
| Langford | 42,653 | 44,146 | 52,431 | 62,272 | 72,190 | 83,688 |
| Colwood | 18,867 | 19,150 | 20,630 | 22,224 | 23,590 | 25,040 |
| Metchosin | 5,168 | 5,251 | 5,684 | 6,154 | 6,532 | 6,934 |
| Highlands | 2,481 | 2,493 | 2,556 | 2,621 | 2,660 | 2,701 |
| Subregional Trade Area | 107,341 | 109,833 | 123,363 | 138,885 | 153,694 | 170,414 |
| Greater Victoria | 418,262 | 423,699 | 451,965 | 482,117 | 506,710 | 532,557 |
Source: Coriolis Consulting Corp.
As shown in the exhibit, we anticipate that:
- The region’s population will grow from about 418,000 in 2019 to about 532,000 by 2040. This is equivalent to an average growth rate of about 1.2% per year. As a comparison, BC Stats population projections for the CRD forecasts an average annual growth rate of 1.0% per year for region from 2019 to 2038.
- View Royal’s population will grow from about 11,300 in 2019 to about 16,500 by 2040. This is equivalent to an average growth rate of about 1.8% per year. As a comparison, BC Stats population projections for each CRD municipality forecasts an average annual growth rate of 1.6% per year for View Royal from 2019 to 2038.
- View Royal’s local commercial trade area will grow from about 38,000 in 2019 to about 52,000 in 2040, which is equivalent to an average growth rate of about 1.5% per year.
- View Royal’s subregional trade area will grow from about 107,300 in 2019 to about 170,400 by 2040. This is equivalent to an average growth rate of about 2.2% per year.
These projections assume that View Royal and the surrounding communities have land use and development policies in place that are supportive of further residential development.
2.2 Retail and Service Analysis
Retail and service businesses (such as restaurants, hair salons, spas, financial institutions, cafes) both tend to occupy grade level commercial space and the distinction between the two types of businesses is often blurred (for example a café might also sell retail goods). Therefore, we combined our forecasts of demand for retail and service space.
Retail and service businesses can be divided into two general categories:
- Local oriented retail and service businesses. This includes businesses that meet the everyday needs of residents, typically located along neighbourhood commercial streets, in small retail plazas, community oriented shopping malls, or in scattered locations. Common tenants include supermarkets and specialty food stores, restaurants and cafes, drycleaners, hair salons, pharmacies, liquor stores, dollar stores, convenience stores, fitness outlets, local hardware stores, and bank branches. Most of these businesses are less than 10,000 sq.ft. The main exceptions are pharmacies (which are often in the 10,000 to 20,000 sq.ft. range) and supermarkets (which are typically in the 25,000 to 50,000 sq.ft. range).
- Regional oriented retail and service businesses. These businesses draw customers from a large geographic area and tend to locate in major commercial areas (such as Downtown Victoria), at regional malls, or in other major shopping locations. Tenants include clothing and department stores, home décor and large building supply stores, jewelers, chain restaurants, a variety of large format stores as well as smaller scale specialized retailers that want to locate in a regional oriented shopping location. Some of these businesses are large (such as department stores or home improvement stores), often in excess of 100,000 sq.ft. However, many are small (such as clothing stores or specialty retailers), often in the 2,000 to 5,000 sq.ft. range.
We divided our retail and service forecasts into the two different categories as each category is influenced by different factors.
2.2.1 Existing Retail and Service Floorspace
Based on BC Assessment floorspace data, we estimate that View Royal has about 407,000 square feet of existing grade level retail and service space. Of this, approximately 341,000 square feet is occupied by local oriented retail and service businesses and 66,000 square feet is occupied by regional oriented retail and service businesses (i.e., Canadian Tire, home furnishings).
The total retail and service inventory in the Town grew by an average of about 12,000 to 13,000 square feet per year between 2001 and 2019.
2.2.2 Approach to Forecasts
In order to forecast the potential demand for additional retail service space in the community, we:
- Estimated the existing amount of retail and service floorspace in the trade area by municipality based on detailed commercial floorspace data from BC Assessment Authority.
- Reviewed the existing types of retail and service businesses in the trade area to identify possible gaps.
- Analyzed trends in the historic pace of retail and service development in the trade area by municipality.
- Estimated the supportable retail and service floorspace per capita in the trade area.
- Projected future population growth in the trade area.
- Calculated the supportable retail and service floorspace in the trade area based on steps 4 and 5 (i.e., supportable space per capita x projected population).
- Estimated the share of the increased supportable retail and service floorspace in the trade area that would likely go to the View Royal.
The key assumptions for our projection are as follows.
2.2.2.1 Retail and Service Space per Capita
Based on detailed floorspace data we have for the communities in the trade area (from BC Assessment) and on work we have completed in other communities, each resident of the trade area likely supports a total of roughly 40 square feet of retail and service space in the Victoria region. This can be divided as follows:
- Each resident supports about 21 square feet of “local oriented” retail and service space. This includes the businesses that serve the day to day needs of trade area residents such as supermarkets, pharmacies, local restaurants, hair salons, as well as other services and convenience retail businesses. This tends to be focused in commercial areas that are in close proximity to local trade area residents. We would expect all of this space to locate within the trade area. Therefore, our local oriented retail analysis assumes trade area residents will support 21 square feet of local oriented retail and service space per capita within the trade area.
- In addition, each resident likely supports a further 19 square feet of “regional oriented” retail and service space. This includes businesses that draw from a large geographic trade and tend to locate in major commercial locations or regional malls. Examples of businesses in this category include department stores, home improvement stores, clothing stores, furniture and home furnishings stores, jewelry stores, auto dealers and other businesses that tend to draw from a large trade area. Based on detailed floorspace data, about 13 square feet of this total is currently being retained with View Royal’s subregional trade area. The remaining 6 square feet is being exported to other parts of Greater Victoria, such as Downtown Victoria and Saanich. As the trade area’s population grows and the retail inventory grows, we would expect that more of this type of space will be retained within the trade area. Therefore, our regional oriented retail analysis assumes trade area residents will support 15 square feet of regional oriented retail and service space per capita within the subregional trade area. The remaining 4 square feet per capita will continue to be exported to other parts of the region (such as Downtown Victoria and regional malls).
2.2.2.2 Impact of E-Commerce
Data from Statistics Canada indicates the e-commerce accounted for about 6.3% of total retail sales in Canada during 2020, up from 2.7% in 2017. We expect that the share of total retail sales occurring online will continue to increase over time.
As online sales increase, there will be a downward influence on the total demand for physical retail and service space. However, the impact on the demand for physical space will vary by retail sector and will not be uniform. We would expect e-commerce to have limited impact on the demand for local oriented retail and service businesses that serve the day to day needs of a community (such as grocery stores, pharmacies, cafes, restaurants, hair salons), but a larger impact on region serving retail categories such as clothing, electronics and furniture (which account for a high share of online sales).
Although e-commerce will impact demand for retail and service space, we expect there to continue to be growth in the total amount of retail and service space in Greater Victoria and in View Royal for a variety of reasons:
- The population of the View Royal trade area is expected to grow significantly, resulting in more demand for retail and service space. However, growth in online sales will likely mean that there is less growth in the retail inventory than there would have been in the absence of e-commerce.
- Some businesses that start as on-line only operations will expand to open physical stores.
- Shopping will increasingly become a form of entertainment for many consumers and retailers will shift more toward the experience rather than focusing solely on selling merchandise.
2.2.2.3 Projected Trade Area Population
Our forecasts are based on the population projections outlined in Section 2.1. The anticipated population growth is summarized in Exhibit 4.
Exhibit 4: Projected Trade Area Population
| Area | 2019 | 2020 (Projected) | 2025 (Projected) | 2030 (Projected) | 2035 (Projected) | 2040 (Projected) |
|---|---|---|---|---|---|---|
| Local Trade Area | 38,172 | 38,794 | 42,060 | 45,614 | 48,721 | 52,052 |
| Subregional Trade Area | 107,341 | 109,833 | 123,363 | 138,885 | 153,694 | 170,414 |
2.2.2.4 Share of Retail Growth Captured by View Royal
Within the local commercial trade area, View Royal currently accounts for about 49% of the retail and service space. We would expect View Royal to capture a large share of the additional local oriented commercial development because:
- View Royal accounted for about 80% to 85% the retail and service development in the local trade area between 2001 and 2019.
- We expect View Royal to account for about 37% of the population growth in the local trade area between 2019 and 2040.
- View Royal has a large amount of land that could be available for commercial development in comparison to Vic West and Esquimalt. However, it should be noted that the Esquimalt First Nation has about 19 acres of available for commercial development that could also capture a share of future retail growth.
Our local oriented commercial forecasts include a lower and a higher scenario for View Royal:
- The lower scenario assumes that View Royal captures about 50% of future trade area local oriented retail and service growth.
- The higher scenario assumes that View Royal captures about 75% of future trade area local oriented retail and service growth.
Within the subregional commercial trade area of View Royal, Esquimalt, Vic West, Colwood, Langford, Highlands and Metchosin, View Royal currently accounts for about 11% of the total retail and service space and about 5% of the estimated regional oriented retail and service space. We would expect View Royal to capture a relatively low share of any additional regional oriented commercial development in the trade area because:
- View Royal accounted for about 7% the retail and service development in the subregional trade area between 2001 and 2019 (most of this was local oriented commercial space).
- We expect View Royal to account for about 8% of the population growth in the local trade area between 2019 and 2040. Most population growth will be concentrated to the west of View Royal in Colwood and Langford (about 75% of projected growth).
- Langford and Colwood have a large amount of land designated and available for additional commercial development, with major commercial projects in the planning process.
- View Royal has a limited existing base of regional oriented retail businesses.
- View Royal is less accessible to the majority of the subregional trade area residents than Langford and Colwood.
Our regional oriented commercial forecasts include a lower and a higher scenario for View Royal:
- The lower scenario assumes that View Royal captures about 5% of future trade area regional oriented retail and service growth.
- The higher scenario assumes that View Royal captures about 10% of future trade area regional oriented retail and service growth.
2.2.3 Local Oriented Retail and Service Space Projection
Exhibits 5 and 6 summarizes our lower and higher projections for local retail/service development in View Royal from 2019 to 2040.
Exhibit 5: Local Retail/Service Demand Projections – Lower Scenario
| 2019 | 2025 (Projected) | 2030 (Projected) | 2035 (Projected) | 2040 (Projected) | |
|---|---|---|---|---|---|
| Local Trade Area Population | 38,172 | 42,060 | 45,614 | 48,721 | 52,052 |
| Local Trade Area Retail/Service Floorspace Per Person (SF) | n/a | 21 | 21 | 21 | 21 |
| Local Oriented Retail/Service Floorspace (SF) | 754,161 | 883,000 | 958,000 | 1,023,000 | 1,093,000 |
| Potential Growth in Local Trade Area Retail/Service Floorspace (SF) per Period | n/a | 128,839 | 75,000 | 65,000 | 70,000 |
| View Royal Share | n/a | 50% | 50% | 50% | 50% |
| Potential Growth in View Royal Retail/Service Floorspace (SF) per Period | n/a | 64,000 | 38,000 | 33,000 | 35,000 |
| Warranted View Royal Retail/Service Floorspace (SF) | 341,333 | 405,333 | 443,333 | 476,333 | 511,333 |
| Cumulative Local Oriented View Royal Retail/Service Growth From 2019 (SF) | n/a | 64,000 | 102,000 | 135,000 | 170,000 |
Source: Coriolis Consulting Corp.
Exhibit 6: Local Retail/Service Demand Projections – Higher Scenario
| 2019 | 2025 (Projected) | 2030 (Projected) | 2035 (Projected) | 2040 (Projected) | |
|---|---|---|---|---|---|
| Local Trade Area Population | 38,172 | 42,060 | 45,614 | 48,721 | 52,052 |
| Local Trade Area Retail/Service Floorspace Per Person (SF) | n/a | 21 | 21 | 21 | 21 |
| Local Oriented Retail/Service Floorspace (SF) | 754,161 | 883,000 | 958,000 | 1,023,000 | 1,093,000 |
| Potential Growth in Local Trade Area Retail/Service Floorspace (SF) per Period | n/a | 128,839 | 75,000 | 65,000 | 70,000 |
| View Royal Share | n/a | 75% | 75% | 75% | 75% |
| Potential Growth in View Royal Retail/Service Floorspace (SF) per Period | n/a | 97,000 | 56,000 | 49,000 | 53,000 |
| Warranted View Royal Retail/Service Floorspace (SF) | 341,333 | 438,333 | 494,333 | 543,333 | 596,333 |
| Cumulative Local Oriented View Royal Retail/Service Growth From 2019 (SF) | n/a | 97,000 | 153,000 | 202,000 | 255,000 |
Source: Coriolis Consulting Corp.
As shown in the exhibits, we anticipate that the total local oriented retail and service floorspace inventory in View Royal could increase by between about 170,000 square feet to 255,000 square feet between 2019 and 2040. This assumes that suitable sites are available for additional retail and service development over the next 20 years or so.
2.2.4 Regional Oriented Retail and Service Space Projection
Exhibits 7 and 8 summarize our lower and higher projections for regional oriented retail and service development in View Royal from 2019 to 2040.
Exhibit 7: Regional Retail Demand Projections from 2019 to 2040 – Lower Scenario
| 2019 | 2025 (Projected) | 2030 (Projected) | 2035 (Projected) | 2040 (Projected) | |
|---|---|---|---|---|---|
| Subregional Area Population | 107,341 | 123,363 | 138,885 | 153,694 | 170,414 |
| Subregional Orientated Retail/Service Floorspace Per Person (SF) | 13 | 15 | 15 | 15 | 15 |
| Subregional Area Retail/Service Floorspace (SF) | 1,395,438 | 1,850,000 | 2,083,000 | 2,305,000 | 2,556,000 |
| Potential Growth in Subregional Area Retail/Service Floorspace (SF) per Period | n/a | 454,562 | 233,000 | 222,000 | 251,000 |
| View Royal Share | n/a | 5% | 5% | 5% | 5% |
| Potential Growth in View Royal Retail/Service Floorspace (SF) per Period | n/a | 23,000 | 12,000 | 11,000 | 13,000 |
| View Royal Retail/Service Floorspace (SF) | 65,951 | 88,951 | 100,951 | 111,951 | 124,951 |
| View Royal Retail/Service Growth From 2019 (SF) | n/a | 23,000 | 35,000 | 46,000 | 59,000 |
Source: Coriolis Consulting Corp.
Exhibit 8: Regional Retail Demand Projections from 2019 to 2040 – Higher Scenario
| 2019 | 2025 (Projected) | 2030 (Projected) | 2035 (Projected) | 2040 (Projected) | |
|---|---|---|---|---|---|
| Subregional Area Population | 107,341 | 123,363 | 138,885 | 153,694 | 170,414 |
| Subregional Orientated Retail/Service Floorspace Per Person (SF) | 13 | 15 | 15 | 15 | 15 |
| Subregional Area Retail/Service Floorspace (SF) | 1,395,438 | 1,850,000 | 2,083,000 | 2,305,000 | 2,556,000 |
| Potential Growth in Subregional Area Retail/Service Floorspace (SF) per Period | n/a | 454,562 | 233,000 | 222,000 | 251,000 |
| View Royal Share | n/a | 10% | 10% | 10% | 10% |
| Potential Growth in View Royal Retail/Service Floorspace (SF) per Period | n/a | 45,000 | 23,000 | 22,000 | 25,000 |
| View Royal Retail/Service Floorspace (SF) | 65,951 | 110,951 | 133,951 | 155,951 | 180,951 |
| View Royal Retail/Service Growth From 2019 (SF) | n/a | 45,000 | 68,000 | 90,000 | 115,000 |
Source: Coriolis Consulting Corp.
As shown in the exhibits, we anticipate that the total regional oriented retail and service floorspace inventory in View Royal could increase by between about 60,000 square feet to 115,000 square feet between 2019 and 2040. This assumes that suitable sites are available for additional retail and service development over the next 20 years or so.
2.2.5 Key Implications
Exhibits 9 and 10 summarize our overall lower and higher demand projections for retail and service area in View Royal.
Exhibit 9: Overall Retail/Service Demand Projections – Lower Scenario
| Projected Growth Per Period | 2019-2025 | 2025-2030 | 2030-2035 | 2035-2040 | 2019-2040 |
|---|---|---|---|---|---|
| View Royal Projected Local Orientated Retail Growth | 64,000 | 38,000 | 33,000 | 35,000 | 170,000 |
| View Royal Projected Regional Orientated Retail Growth | 23,000 | 12,000 | 11,000 | 13,000 | 59,000 |
| View Royal Projected Total Retail/Service Growth | 87,000 | 50,000 | 44,000 | 48,000 | 229,000 |
| Average Projected Yearly Retail/Service Growth Per Time Period | 14,500 | 10,000 | 8,800 | 9,600 | 10,905 |
| Total Floorspace | 2019 | 2025 | 2030 | 2035 | 2040 |
| Estimated Total View Royal Retail/Service Floorspace (SF) | 407,284 | 494,284 | 544,284 | 588,284 | 636,284 |
Source: Coriolis Consulting Corp.
Exhibit 10: Overall Retail/Service Demand Projections – Higher Scenario
| Projected Growth per Period | 2019-2025 | 2025-2030 | 2030-2035 | 2035-2040 | 2019-2040 |
|---|---|---|---|---|---|
| View Royal Projected Local Orientated Retail Growth | 97,000 | 56,000 | 49,000 | 53,000 | 255,000 |
| View Royal Projected Regional Orientated Retail Growth | 45,000 | 23,000 | 22,000 | 25,000 | 115,000 |
| View Royal Projected Total Retail/Service Growth | 142,000 | 79,000 | 71,000 | 78,000 | 370,000 |
| Average Projected Yearly Retail/Service Growth Per Time Period | 23,667 | 15,800 | 14,200 | 15,600 | 17,619 |
| Total Floorspace | 2019 | 2025 | 2030 | 2035 | 2040 |
| Estimated Total View Royal Retail/Service Floorspace (SF) | 407,284 | 549,284 | 628,284 | 699,284 | 777,284 |
Source: Coriolis Consulting Corp.
We anticipate that the total retail and service floorspace inventory in View Royal could increase by between about 229,000 square feet and 370,000 square feet between 2019 and 2040 if suitable sites are available for additional retail and service development over the next 20 years or so. This is equivalent to average annual retail and service growth of about 11,000 square feet to 18,000 square feet per year on average. The upper end of this range is almost 50% higher than the pace of retail growth in View Royal between 2001 and 2019, largely because it assumes View Royal can capture more regional oriented retail and service development going forward.
Retail and service businesses place an emphasis on locations that provide easy access to their customers, visibility and convenient parking.
The locations in the Town that would likely be most marketable for retail and service development include:
- Properties that that front on the Island Highway, particularly in existing commercial nodes such as the Western Gateway corridor (in Wilfert), the Helmcken-Harbour Community corridor and the Eastern Gateway Community corridor.
- The future Town Centre.
- The Hospital precinct, particularly along Helmcken Road.
2.3 Office Analysis
This section summarizes our forecasts of the potential demand for new office development in View Royal. It includes four main parts:
- A review of historic office growth in the overall Victoria market and in View Royal.
- Identification of the key assumptions for the forecasts.
- Forecasts of the potential office demand in the Town that likely bracket the potential long term demand.
- Identification of the key implications.
2.3.1 Existing Situation
Based on BC Assessment floorspace data and our own research, we estimate that:
- The overall Victoria region includes about 12.9 million square feet of office space. The regional office inventory grew by about average of about 130,000 to 140,000 square feet per year between 2001 and 2019. This rate of growth was relatively stable over this time period.
- The total suburban office inventory (outside of the City of Victoria) includes about 4.5 million square feet of office space. The suburban areas accounted for about 40% to 50% of the regional office growth between 2001 and 2019, or about 55,000 to 70,000 square feet per year on average.
- View Royal includes about 147,000 square feet of existing office space. The Town’s office inventory increased by an average of about 5,000 square feet per year between 2001 and 2019 and by about 9,000 square feet per year between 2011 and 2019. Almost all of this growth was due to the new office building at Eagle Creek and the office component of the Reliable Controls building.
- Roughly half of the existing office tenants in View Royal are medical related. The remaining office tenants included businesses involved in real estate (development, management, sales), design, engineering, legal, insurance, finance, government, education, building systems, and non-profits.
2.3.2 Approach to Forecasts and Key Assumptions
Our forecasts of office demand in View Royal include three key components:
- A forecast of total office growth in the Victoria region.
- An estimate of the share of regional office growth that will be captured by the suburbs, including View Royal.
- An estimate of the share of suburban office growth that will go to View Royal.
2.3.2.1 Growth in the Overall Victoria Office Market
Office construction in Greater Victoria averaged between 130,000 and 140,000 square feet per year over the past 20 years or so, depending on the time frame considered. There will be fluctuations year to year going forward, but we would expect a similar pace of growth to continue over the long term. Our office forecasts assume that the regional office market grows by about 135,000 to 150,000 square feet per year over the long term.
2.3.2.2 Share of Growth Captured by the Suburban Areas
Between 2001 and 2019, the suburban areas of Victoria (all municipalities outside of the City of Victoria), captured about 50% of total regional office growth. Since 2011, the suburban areas have captured about 40% of total growth regional office growth.
Our office forecasts include a lower and a higher scenario for the share of regional office growth that goes to the suburban areas:
- The lower scenario assumes that suburban office locations capture about 40% of future office growth in the Victoria market.
- The higher scenario assumes that suburban office locations capture about 45% of future office growth in the Victoria market.
2.3.2.3 Share of Growth Captured by View Royal
View Royal currently accounts for about 3% of the total office space in the suburban areas of Greater Victoria. We would expect View Royal to capture a slightly higher share of any additional suburban office development because:
- View Royal accounted for about 8% the suburban office development between 2001 and 2019 and about 16% of the suburban office development between 2011 and 2019.
- View Royal has lands designated for future commercial development.
- The Hospital precinct will be an attractive location for additional medical and health care related users.
However, other suburban locations in the region (such as Langford, Colwood and Saanich) will also continue to attract significant office development which will limit the share that can be captured by View Royal.
Our office forecasts include a lower and a higher scenario for View Royal:
- The lower scenario assumes that View Royal captures about 10% of future suburban office growth in the Victoria region.
- The higher scenario assumes that View Royal captures about 15% of future suburban office growth in the Victoria region.
2.3.3 Office Forecasts
We produced two different office projections for View Royal based on the assumptions outlined in Section 2.2.2:
- A lower scenario that assumes that the regional office market grows by an average 135,000 square feet per year, 40% of the growth goes to suburban locations and View Royal captures about 10% of the suburban office growth.
- A higher scenario that assumes that the regional office market grows by an average 150,000 square feet per year, 45% of the growth goes to suburban locations and View Royal captures about 15% of the suburban office growth.
Exhibit 11 summarizes our lower office space projection for View Royal.
Exhibit 11: Office Demand Projections – Lower Scenario
| 2019 to 2025 | 2025 to 2030 | 2030 to 2035 | 2035 to 2040 | |
|---|---|---|---|---|
| Average Annual Office Development (SF) | ||||
| Greater Victoria Annual Growth | 135,000 | 135,000 | 135,000 | 135,000 |
| Suburban Office Market Share of Growth | 40.0% | 40.0% | 40.0% | 40.0% |
| Suburban Office Market Growth | 54,000 | 54,000 | 54,000 | 54,000 |
| View Royal Share of Growth | 10.0% | 10.0% | 10.0% | 10.0% |
| View Royal Annual Growth | 5,400 | 5,400 | 5,400 | 5,400 |
| Projected Total Office Floorspace | 2019 | 2025 | 2030 | 2035 |
| Greater Victoria | 12,898,405 | 13,708,405 | 14,383,405 | 15,058,405 |
| Suburban Office Market Share | 35.3% | 35.6% | 35.8% | 36.0% |
| Suburban Office Market | 4,551,601 | 4,875,601 | 5,145,601 | 5,415,601 |
| View Royal Share | 3.2% | 3.7% | 4.0% | 4.3% |
| View Royal | 146,910 | 179,310 | 206,310 | 233,310 |
| View Royal Growth from 2019 (sf) | n/a | 32,400 | 59,400 | 86,400 |
Source: Coriolis Consulting Corp.
Exhibit 12: Office Demand Projections – Higher Scenario
| 2019 to 2025 | 2025 to 2030 | 2030 to 2035 | 2035 to 2040 | |
|---|---|---|---|---|
| Average Annual Office Development (SF) | ||||
| Greater Victoria Annual Growth | 150,000 | 150,000 | 150,000 | 150,000 |
| Suburban Office Market Share of Growth | 45.0% | 45.0% | 45.0% | 45.0% |
| Suburban Office Market Growth | 68,000 | 68,000 | 68,000 | 68,000 |
| View Royal Share of Growth | 15.0% | 15.0% | 15.0% | 15.0% |
| View Royal Annual Growth | 10,200 | 10,200 | 10,200 | 10,200 |
| Projected Total Office Floorspace | 2019 | 2025 | 2030 | 2035 |
| Greater Victoria | 12,898,405 | 13,798,405 | 14,548,405 | 15,298,405 |
| Suburban Office Market Share | 35.3% | 35.9% | 36.4% | 37.1% |
| Suburban Office Market | 4,551,601 | 4,959,601 | 5,299,601 | 5,674,601 |
| View Royal Share | 3.2% | 4.2% | 4.9% | 5.6% |
| View Royal | 146,910 | 208,110 | 259,110 | 315,610 |
| View Royal Growth from 2019 (sf) | n/a | 61,200 | 112,200 | 168,700 |
Source: Coriolis Consulting Corp.
Overall, we anticipate that office floorspace growth in View Royal will total between about 110,000 and 225,000 between 2019 and 2040, depending on overall demand in the Greater Victoria market and the share of growth captured by View Royal.
These forecasts assume that there are sites available that are suitable for office development and that office development is financially viable.
Due to the presence of Victoria General Hospital, one of the key office segments that could be attracted to View Royal is medical related office space. We estimate that the existing concentration of medical office space near Victoria General Hospital is a maximum of 30,000 to 40,000 square feet. As a comparison, we estimate that there is between 125,000 and 150,000 square feet of office space occupied by medical tenants in the area surrounding Royal Jubilee Hospital in Victoria. Therefore, over time, we would expect there to be opportunity for additional medical office space in View Royal surrounding Victoria General.
2.3.4 Key Implications
We anticipate that office floorspace growth in the View Royal will total between about 110,000 and 225,000 square feet between 2019 and 2040, depending on overall demand in the Victoria market and the share of regional growth captured by View Royal. This is equivalent to average annual growth in the range of about 5,000 and 11,000 square feet per year over the entire 20 year period. The upper end of this range is approximately double the historic pace of office growth in View Royal between 2001 and 2019.
Medical office space could account a share of this growth if suitable sites near Victoria General Hospital are available for office (or mixed use) development.
Office users put an emphasis on convenient access, parking availability, proximity to services and amenities and proximity to other businesses.
The portions of the Town that would likely be most marketable for office development include:
- Properties that front on the Island Highway, particularly in existing commercial nodes such as the Western Gateway corridor (in Wilfert).
- The future Town Centre.
- The Hospital precinct, particularly for health care and medical related offices.
2.4 Potential Hotel Room Demand in View Royal
This section summarizes our evaluation of potential hotel room demand in View Royal.
2.4.1 Current Situation
There are currently no significant hotel or motels currently operating in View Royal.
2.4.2 Approach and Key Assumptions
In order to project the potential growth of hotel rooms in View Royal, we:
- Estimated the total existing hotel room inventory in Greater Victoria.
- Projected potential long term growth in the Greater Victoria hotel room inventory based on indicators of tourism growth.
- Evaluated the share of the Greater Victoria hotel room growth that could go to View Royal’s subregional trade area.
- Evaluated the share of the subregional hotel room growth that may locate in View Royal.
The key assumptions for our projection are as follows.
2.4.2.1 Greater Victoria Room Inventory
There are currently about 4,140 hotel and motel rooms in Greater Victoria. Of this, we estimate that roughly 600 rooms (or 15%) are located in View Royal’s subregional trade area. However, View Royal does not include any significant existing tourist accommodation (other than bed and breakfast units).
2.4.2.2 Potential Long Term Growth in the Greater Victoria Inventory
Growth in the hotel room inventory will influenced by the number of visitors to the region and growth in the regional employment and population base.
Based on information about changes in passenger ferry volumes and airport volumes as well as our projected population growth for the region, we would expect hotel room demand to increase by about 2% per year over of the long term.
This may be optimistic (particularly in the short term), but we assume any negative impacts associated with the current COVID-19 pandemic are limited to the short term and tourism picks up within the next few years.
2.4.2.3 Share of Growth to Subregion and to View Royal
We estimate that the subregion currently accounts for about 15% of the Greater Victoria room inventory. However, we would expect this to increase over time given the subregion is growing at a relatively high pace. Our projection assumes that the subregion captures between 15% and 20% of the Greater Victoria hotel room growth going forward.
View Royal does not have any significant existing hotels or motels. However, it may be able to capture a share of growth going forward as it has lands designated for commercial development and it includes the Elements Casino which could create room demand.
However, View Royal will face competition from Vic West, Langford and Colwood for any hotel development going forward.
Our projection assumes that the View Royal captures about 25% of the subregion’s hotel room growth going forward. Given the potential competition from the surrounding municipalities, this may be optimistic.
2.4.3 Hotel Room Demand Projection
Exhibit 13 summarizes our projected demand scenario for hotel room growth in View Royal from 2019 to 2040.
Exhibit 13: Projected Hotel Room Growth
| Projected Growth by Time Period | 2019 | 2025 (Projected) | 2030 (Projected) | 2040 (Projected) |
|---|---|---|---|---|
| Number of Rooms in Greater Victoria | 4,141 | 4,700 | 5,200 | 6,300 |
| Greater Victoria Growth per Year | n/a | 2.0% | 2.0% | 2.0% |
| Increase in Greater Victoria Rooms Per Period | n/a | 559 | 500 | 1,100 |
| Subregion Share of Greater Victoria Growth | n/a | 15.0% | 17.5% | 20.0% |
| Increase in Subregion Rooms per Period | n/a | 84 | 88 | 220 |
| View Royal Share of Subregional Growth | n/a | 25% | 25% | 25% |
| Increase in View Royal Rooms per Period | n/a | 21 | 22 | 55 |
| Projected Total Rooms in View Royal | 2019 | 2025 | 2030 | 2040 |
| Number of Rooms in the Subregion | 595 | 679 | 766 | 986 |
| Number of Rooms in View Royal | - | 21 | 43 | 98 |
| View Royal Room Growth From 2019 | n/a | 21 | 43 | 98 |
| Potential Increase in Hotel Floorspace (sf)^2 | 0 | 12,600 | 25,800 | 58,800 |
^2 The floorspace projection assumes an average gross floor area of 600 square feet per hotel room, including all common areas and back of house operations. The typical range in in the industry is 500 to 750 square feet per room.
Source: Coriolis Consulting Corp.
As shown in the exhibit, we think that there might be an opportunity for up to about 100 hotel rooms in View Royal over the next 20 years or so. This is essentially equivalent to one smaller hotel.
We would expect any hotel developer to be primarily interested in a location near the existing casino. It is possible that the hospital precinct could also be of interest. We would expect hotel developers to be interested in maximum heights of 4 to 6 storeys as illustrated by newer hotels in the suburban portions of Greater Victoria.
2.5 Apartment Analysis
This section summarizes our forecasts of the potential long term demand for new apartment units in View Royal.
2.5.1 Historic Development Trends
New apartment projects in View Royal would compete primarily with any new projects in a subregion that includes Vic West, Esquimalt, Colwood, Langford, Highlands and Metchosin. Based on CMHC housing starts data, we estimate that:
- Housing starts in this subregion averaged about 1,190 new housing units per year between 2010 and 2019. Of this, about 695 units were new apartment units.
- Housing starts in View Royal averaged about 105 new housing units per year between 2010 and 2019. Of this, about 63 units were new apartment units.
- View Royal captured about 9% of total subregional housing starts and about 9% of total subregional apartment starts between 2010 and 2019.
We would expect View Royal to continue to experience a significant amount of apartment development going forward as there are a number of proposed apartment projects that have recently received approval or are in the planning process.
2.5.2 Approach to Forecasts and Key Assumptions
Our apartment demand forecasts included the following key steps:
- We projected population and household growth in the subregion (View Royal, Esquimalt, Vic West, Colwood, Langford, Highlands and Metchosin).
- Based on the projected household growth, we estimate the total demand for new housing units in the subregion and the portion of this demand that would likely be comprised of new apartment units. This is based on our analysis of historic trends in housing starts by structure type (single family, attached, apartments) and our outlook for each structure type.
- We estimated the share of subregional apartment demand that could be captured by View Royal. This is based on our analysis of trends in View Royal’s share of subregional apartment starts.
- We estimated the long term demand for new apartment units in View Royal.
2.5.2.1 Subregional Population and Household Projection
As outlined in Section 2.1, we anticipate that the subregional population will grow from about 107,000 in 2019 to 170,000 in 2040. The current average household size in the subregion is about 2.4. Based on trends in household sizes in the region, we would expect this to decline to about 2.3 by 2040.
This would result in an increase in households from 44,083 in 2019 to 74,093 in 2040 as shown in Exhibit 14.
Exhibit 14: Projected Population and Household Growth in the Subregion
| 2019 | 2025 | 2030 | 2035 | 2040 | |
|---|---|---|---|---|---|
| Subregional Population | 107,341 | 123,363 | 138,885 | 153,694 | 170,414 |
| Average Household Size | 2.4 | 2.4 | 2.4 | 2.4 | 2.3 |
| Number of Households | 44,083 | 51,401 | 57,869 | 64,039 | 74,093 |
Source: Coriolis Consulting Corp.
2.5.2.2 Share of Demand by Housing Type
CMHC housing starts data indicates that:
- Single detached homes accounted for about 30% of starts in the subregion between 2010 and 2019.
- Attached units (duplex, row, townhouse) accounted for about 12% of starts in the subregion between 2010 and 2019.
- Apartment units accounted for about 58% of starts in the subregion between 2010 and 2019.
Over this time period, apartment units have been accounting for an increasing share of total starts while single detached homes have been accounting for a declining share.
Our projections assume that apartment units will account for about 60% of total housing starts in the subregion between 2020 and 2040.
2.5.2.3 Share of Apartment Demand Captured by View Royal
View Royal accounted for about 9% of total subregional apartment starts between 2010 and 2019. This share remained relatively steady over the entire time period. However, View Royal could account for an increasing share if planning policy supports higher density apartment development in the Town. Therefore, our apartment forecasts include a lower and a higher scenario for View Royal:
- The lower scenario assumes that View Royal captures about 10% of future subregional apartment development.
- The higher scenario assumes that View Royal captures about 12.5% of future subregional apartment development.
2.5.3 Projected Apartment Demand
Exhibits 15 and 16 summarize our lower and higher forecasts of apartment demand in View Royal from 2019 to 2040.
Exhibit 15: View Royal Projected Apartment Demand – Lower Scenario
| 2019 | 2025 (Projected) | 2030 (Projected) | 2035 (Projected) | 2040 (Projected) | Growth 2019-2040 | |
|---|---|---|---|---|---|---|
| Subregional Population | 107,341 | 123,363 | 138,885 | 153,694 | 170,414 | 63,073 |
| Average Household Size | 2.4 | 2.4 | 2.4 | 2.4 | 2.3 | 2.1 |
| Households in Subregion | 44,083 | 51,401 | 57,869 | 64,039 | 74,093 | 30,010 |
| Demand for New Housing Units Per Period | n/a | 7,318 | 6,468 | 6,170 | 10,054 | 30,010 |
| Subregional Area Demand by Housing Type | 2019 | 2019-2025 | 2025-2030 | 2030-2035 | 2035-2040 | 2019-2040 |
| Single Family | n/a | 28% | 28% | 28% | 28% | n/a |
| Attached | n/a | 12% | 12% | 12% | 12% | n/a |
| Apartment | n/a | 60% | 60% | 60% | 60% | n/a |
| Total | n/a | 100% | 100% | 100% | 100% | n/a |
| Subregional Demand by Housing Type by Time Period | 2019 | 2019-2025 | 2025-2030 | 2030-2035 | 2035-2040 | 2019-2040 |
| Single Family | n/a | 2,049 | 1,811 | 1,728 | 2,815 | 8,403 |
| Attached | n/a | 862 | 762 | 727 | 1,185 | 3,537 |
| Apartment | n/a | 4,391 | 3,881 | 3,702 | 6,032 | 18,006 |
| Total | n/a | 7,318 | 6,468 | 6,170 | 10,054 | 30,010 |
| View Royal Apartment Demand | 2019 | 2019-2025 | 2025-2030 | 2030-2035 | 2035-2040 | 2019-2040 |
| Study Area Apartment Demand per Period | n/a | 4,391 | 3,881 | 3,702 | 6,032 | 18,006 |
| View Royal Share of Apartment Demand | n/a | 10% | 10% | 10% | 10% | 10% |
| View Royal Apartment Demand per Period | n/a | 439 | 388 | 370 | 603 | 1,801 |
| Average View Royal Apartment Demand Per Year | n/a | 73 | 78 | 74 | 121 | 86 |
Source: Coriolis Consulting Corp.
Exhibit 16: View Royal Projected Apartment Demand – Higher Scenario
| 2019 | 2025 (Projected) | 2030 (Projected) | 2035 (Projected) | 2040 (Projected) | Growth 2019-2040 | |
|---|---|---|---|---|---|---|
| Subregional Population | 107,341 | 123,363 | 138,885 | 153,694 | 170,414 | 63,073 |
| Average Household Size | 2.4 | 2.4 | 2.4 | 2.4 | 2.3 | 2.1 |
| Households in Subregion | 44,083 | 51,401 | 57,869 | 64,039 | 74,093 | 30,010 |
| Demand for New Housing Units Per Period | n/a | 7,318 | 6,468 | 6,170 | 10,054 | 30,010 |
| Subregional Area Demand by Housing Type | 2019 | 2019-2025 | 2025-2030 | 2030-2035 | 2035-2040 | 2019-2040 |
| Single Family | n/a | 28% | 28% | 28% | 28% | n/a |
| Attached | n/a | 12% | 12% | 12% | 12% | n/a |
| Apartment | n/a | 60% | 60% | 60% | 60% | n/a |
| Total | n/a | 100% | 100% | 100% | 100% | n/a |
| Subregional Demand by Housing Type by Time Period | 2019 | 2019-2025 | 2025-2030 | 2030-2035 | 2035-2040 | 2019-2040 |
| Single Family | n/a | 2,049 | 1,811 | 1,728 | 2,815 | 8,403 |
| Attached | n/a | 862 | 762 | 727 | 1,185 | 3,537 |
| Apartment | n/a | 4,391 | 3,881 | 3,702 | 6,032 | 18,006 |
| Total | n/a | 7,318 | 6,468 | 6,170 | 10,054 | 30,010 |
| View Royal Apartment Demand | 2019 | 2019-2025 | 2025-2030 | 2030-2035 | 2035-2040 | 2019-2040 |
| Study Area Apartment Demand | n/a | 4,391 | 3,881 | 3,702 | 6,032 | 18,006 |
| View Royal Share of Apartment Demand | n/a | 12.5% | 12.5% | 12.5% | 12.5% | 13% |
| View Royal Apartment Demand per Period | n/a | 549 | 485 | 463 | 754 | 2,251 |
| Average View Royal Apartment Demand Per Year | n/a | 91 | 97 | 93 | 151 | 107 |
Source: Coriolis Consulting Corp.
As shown in the exhibits, we estimate that demand for new apartment units in View Royal will average about 85 to 110 units per year between 2019 and 2040. This is significantly higher than the pace of starts between 2010 and 2019 (63 units per year).
The future Town Centre and the Hospital precinct, as well as the other locations already designated for mixed use and apartment development are marketable locations for new apartment development or mixed use apartment and commercial development (in locations where commercial space is marketable and viable).
2.6 Overall Summary of Market Projections
Our overall lower and higher development projections for the Town are summarized in Exhibits 17 and 18 (all figures are in square feet).
Exhibit 17: Projected Development in View Royal – Lower Scenario
| Projected Growth (sf) Per Period | 2019 to 2025 | 2025 to 2030 | 2030 to 2040 | 2019 to 2040 |
|---|---|---|---|---|
| Office | 32,400 | 27,000 | 54,000 | 113,400 |
| Retail and Service | 87,000 | 50,000 | 92,000 | 229,000 |
| Hotel | 12,600 | 13,200 | 33,000 | 58,800 |
| Subtotal Commercial Floorspace | 132,000 | 90,200 | 179,000 | 401,200 |
| Apartment Floorspace^3 | 439,000 | 388,000 | 973,000 | 1,800,000 |
| Total Floorspace | 571,000 | 478,200 | 1,152,000 | 2,201,200 |
^3 Apartment forecasts assumes an average gross unit size of about 1,000 square feet.
Exhibit 18: Projected Development in View Royal – Higher Scenario
| Projected Growth (sf) Per Period | 2019 to 2025 | 2025 to 2030 | 2030 to 2040 | 2019 to 2040 |
|---|---|---|---|---|
| Office | 61,200 | 51,000 | 113,000 | 225,200 |
| Retail and Service | 142,000 | 79,000 | 149,000 | 370,000 |
| Hotel | 12,600 | 13,200 | 33,000 | 58,800 |
| Subtotal Commercial Floorspace | 215,800 | 143,200 | 295,000 | 654,000 |
| Apartment Floorspace | 549,000 | 485,000 | 1,217,000 | 2,251,000 |
| Total Floorspace | 764,800 | 628,200 | 1,512,000 | 2,905,000 |
Our projections of potential urban development between 2019 and 2040 in the Town can be summarized as follows:
- Office development will range between about 110,000 and 225,000 square feet.
- Retail and service development will range between about 230,000 and 370,000 square feet.
- Hotel development will total a maximum of about 60,000 square feet (about 100 new rooms).
- Total commercial development will range between about 400,000 and 655,000 square feet.
- Apartment development will range between about 1.8 million and 2.3 million square feet (1,800 to 2,250 units)
Because office and retail users put an emphasis on convenient access, visibility, parking availability, proximity to services and amenities and proximity to other businesses, the portions of the Town that would likely be most marketable for retail, service and office development include:
- Properties that that front on the Island Highway, particularly in existing commercial nodes such as the Western Gateway corridor (in Wilfert), the Helmcken-Harbour Community corridor and the Eastern Gateway Community corridor.
- The future Town Centre.
- The Hospital precinct, particularly along Helmcken Road.
Apartment development would be marketable in residential or mixed use locations throughout the Town.
3.0 Interviews with Industry Representatives
We contacted industry representatives to discuss opportunities and constraints for new development in View Royal. Interviews were conducted with:
- The South Island Prosperity Partnership (SIPP).
- The West Shore Chamber of Commerce.
- The Urban Development Institute (UDI).
- Developers who are active in View Royal and adjacent municipalities.
The key comments provided by the individuals interviewed can be summarized as follows:
- View Royal is well positioned to attract:
- Multifamily residential development due it is central location in the region and livability.
- Light industrial development or mixed office and industrial development (if suitable sites are available) because there is increasing demand for light industrial space in the region, but few locations for this type of development.
- Medical related office space in the area near Victoria General Hospital, although the total market for this type of space may be limited.
- Retail, service and office space that serves the local community as the population of View Royal (and adjacent communities) continues to grow.
- There is likely limited opportunity for:
- Large office projects as the market for office space in the region is small outside of the Core.
- Larger retail and service projects that serve the broader region because the adjacent communities of Colwood and Langford have the capacity to continue to accommodate this type of retail and a much larger population base than View Royal.
- Developers will be primarily interested in lowrise (4 storey) and midrise (6 storey) development as these forms of housing are more cost-effective than taller buildings which require more expensive concrete (or mass timber) construction. Over time, there may be more interest in taller buildings from developers.
- Land supply is the main constraint for new development in View Royal. There are very few vacant properties remaining in the community so new development requires redevelopment which is more challenging. In addition, the owners or many of the under-utilized properties are not yet willing to sell for redevelopment.
- Retail and service development should be focused in specific locations that are suitable and marketable for commercial development. Ideally, commercial locations would be highly accessible by vehicle, visible to passing traffic and offer convenient parking.
- Developers view the Town’s planning policies as generally supportive of development. However, some suggested that the approvals process could be improved if there was increased clarity about the heights and densities that would be supported as part of rezoning approval. Some developers suggested that proposals which were consistent with the OCP have not been supported by the Town. Some suggested that prezoning sites would help encourage additional development by removing the costs and risks associated with rezoning.
4.0 Economics of Redevelopment
As outlined in Section 2.0, we think that there will be significant demand for new urban development in View Royal over the next ten to twenty year or so. However, demand only results in new development if it is financially viable for developers to proceed with new projects and if planning policies are supportive of new development.
Most properties in the portions of the Town that are designated for multifamily residential or mixed use development are already improved with existing buildings, so new development will need to come primarily through redevelopment and intensification of existing under-utilized properties. Therefore, our analysis included a detailed evaluation of the economics of redevelopment and the implications for the uses, heights and densities likely required to make redevelopment financially viable. This section summarizes our financial analysis and the key implications.
4.1 Approach to Analysis
Properties that are improved with an existing use can be thought as having two different possible values:
- The value supported by the existing use (e.g., residence, income producing commercial building).
- The value supported by redevelopment (land value).
The higher of these two values is the actual market value of the property.
In order for a property to be financially attractive for redevelopment, the land value supported by the redevelopment concept needs to equal or exceed the value of the property under its existing use. Otherwise, a developer cannot afford to outbid a prospective purchaser (home buyer, investor, business) who want to retain the existing use.
Our analysis focuses on determining whether or not redevelopment is financially viable for private developers. It is important to note that development will not necessarily occur just because it is financially viable. A number of other conditions are necessary:
- There needs to be market demand for the project being considered.
- The municipality needs to approve the project.
- The existing landowner needs to be willing to sell the property to a developer for redevelopment at a price that is supported by the permitted development.
For this analysis, we selected a variety of case studies in the Town to test. Our approach for each site is to estimate the value of the property under its existing use and compare this with the estimated redevelopment land value of the site under the assumed rezoning scenario, allowing us to determine if the site is financially attractive for redevelopment under the assumed mix of uses, height and densities being tested in the scenario^4.
The methodology can be broadly summarized in the following steps:
^4 We analyzed one site that is currently vacant. For this site we compared the land value supported by the redevelopment scenario with the land value under existing zoning to determine if the redevelopment scenario supports a higher value than the existing zoning.
- The financial viability of redevelopment will vary depending on a site’s location and value of the existing use. Therefore, we identified 17 different case study sites in different parts of the Town that vary based on location, site size and existing use. Each site is improved with older, low density existing improvements and are representative of the types of sites that could be attractive for redevelopment. The case studies were agreed upon with the Town. Section 4.2 provides a detailed description of each case study site. Exhibit 19 provides a summary of the general location of each of the 17 case study sites and the redevelopment scenarios that we tested.
Exhibit 19: Summary of Types of Case Study Sites Analyzed
| Neighbourhood | Number of Sites | Strata Apartment or Mixed Use Scenarios | Commercial or Light Industrial Scenarios | Townhouse and Infill Scenarios | Total Scenarios Analyzed |
|---|---|---|---|---|---|
| Hospital | 6 | 20 | 2 | 5 | 27 |
| Helmcken | 2 | 2 | 0 | 1 | 3 |
| Wilfert | 4 | 6 | 3 | 0 | 9 |
| Harbour | 5 | 14 | 0 | 3 | 17 |
| Total | 17 | 42 | 5 | 9 | 56 |
- For each case study site, we estimated the property value supported by the existing use of the site: a. For income producing properties (commercial or rental uses), this is the capitalized value of the estimated net income stream generated by the existing improvements. This is the value that an investor would be willing to pay for the property to retain the existing improvements and collect rent for the long term. It represents the minimum price that a developer would need to pay for the site to acquire it for redevelopment purposes. b. For existing single family (or duplex) properties, the existing value is the value of the property as an existing residence. For residential properties that require assembly, we assume that the developer would also need to pay a 20% premium over existing value in order to create an incentive for all of the existing property owner to sell to the developer simultaneously.
- Using proforma analysis, we estimated the land value that would be supported by each redevelopment scenario being evaluated for the case study site. This was done using a land residual approach as outlined in Exhibit 20. The land residual analysis estimates the value of the completed building and then deducts all development costs (except land) and deducts a profit margin. The resulting residual is the maximum land value that a developer could afford to pay for the site, proceed with the development and earn the target profit.
The revenue and cost assumptions used in the land residual analysis are based on market research completed during late 2020.
If the land residual estimate is equal to or higher than the estimated value under existing use (step 2), then the redevelopment scenario is financially viable.
Exhibit 20: Land Residual Approach
| Revenue/Sales Proceeds |
| Less all project costs except land |
| Less developer’s profit target |
| Equals land residual (land value) |
An alternate approach to determining the land value that is supported by redevelopment is to examine the recent sales prices of development sites in the Town (on a per square foot or per unit basis). Therefore, we also compared the results of our land residual analysis with sales prices of development sites in the Town to make sure the results of our financial analysis are consistent with development site sales evidence. Our analysis relies primarily on the land residual (proforma) approach as it can be used to test changes to heights, densities, uses, parking and other factors that affect the financial performance of a potential project. This approach allows us to gauge the financial impact of potential changes to development policies on the viability of new development projects.
4.2 Case Study Sites Analyzed
4.2.1 Description of Case Studies Analyzed
With input from City staff, we identified 17 case study sites (or assemblies) to analyze for redevelopment for a range of different types of hypothetical projects. Each site was analyzed for multiple redevelopment scenarios, so in total, we analyzed over 50 different redevelopment scenarios.
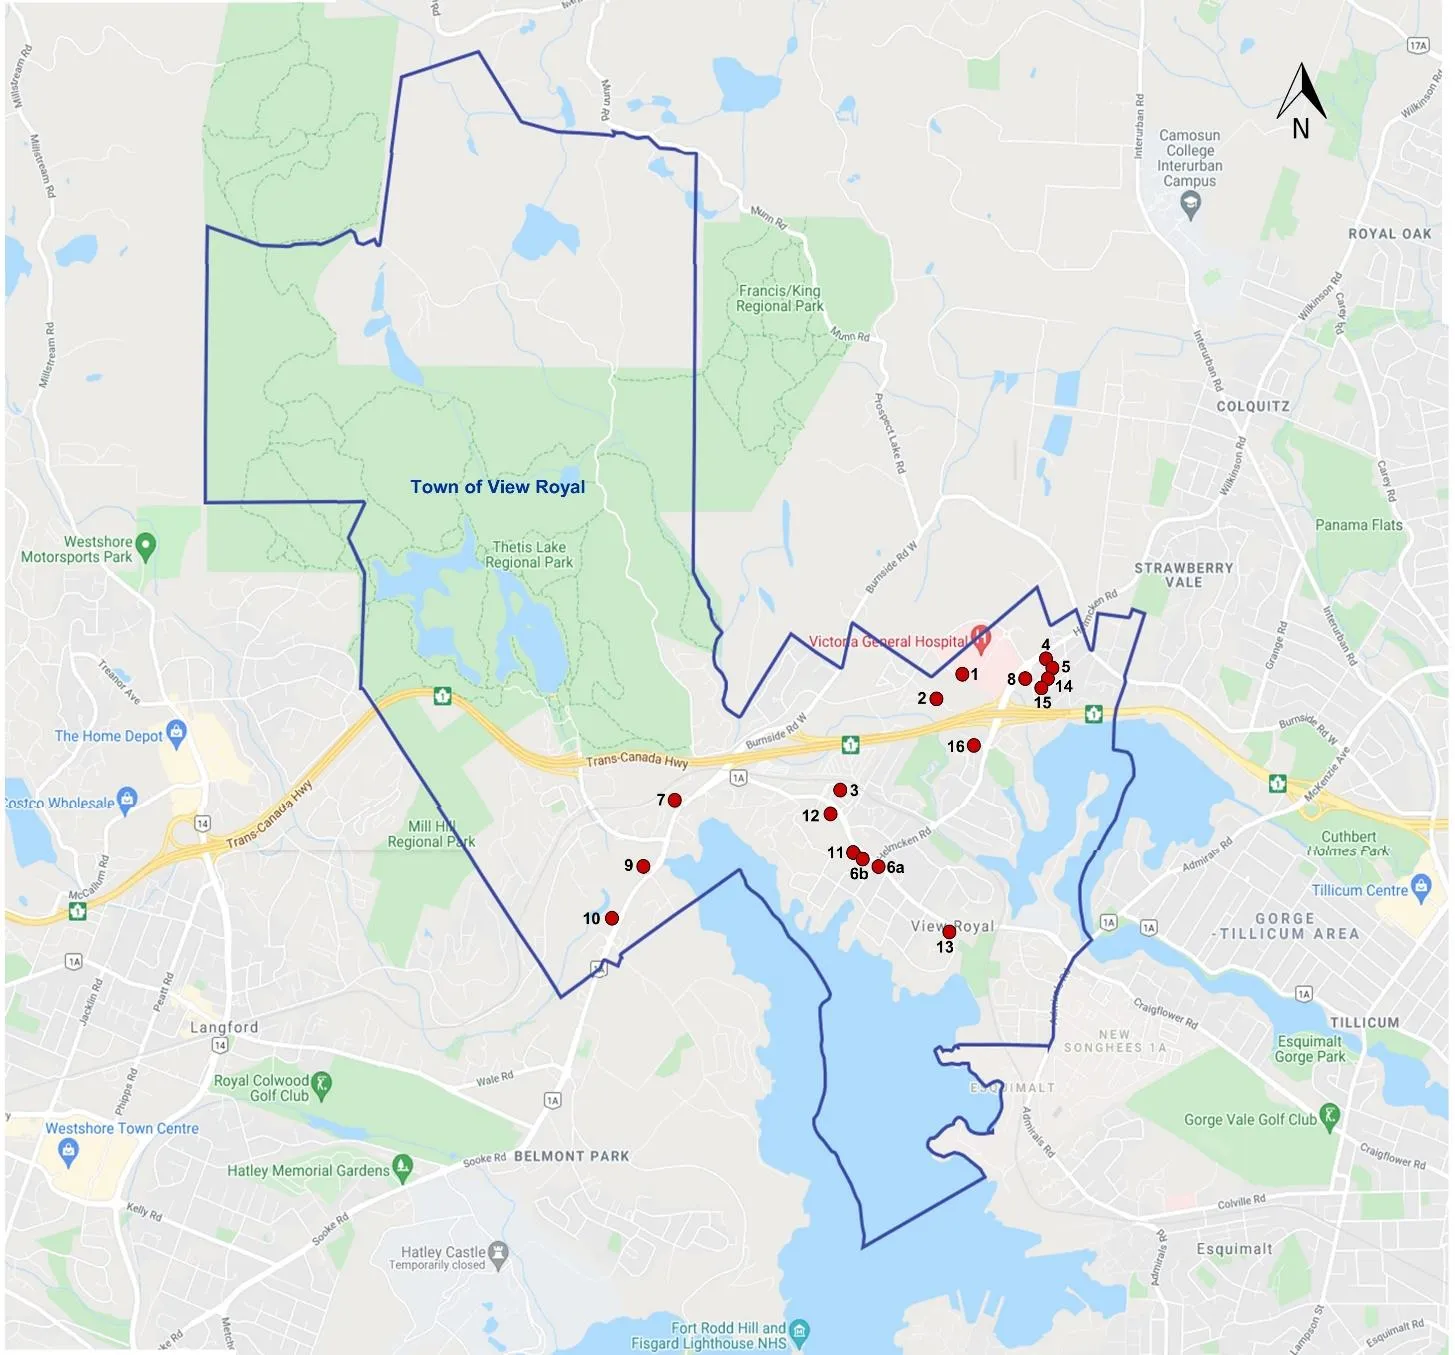
The case studies are described below. We have organized the descriptions by the type of redevelopment project (e.g., strata apartment, mixed use, commercial, townhouse, infill). The site numbers provided in the following sections are not always sequential because some sites were analyzed more than once to test different types of redevelopment scenarios (e.g., apartment and office). The location of each site is shown in the Attachments at the end of this report.
4.2.1.1 Strata Apartment and Mixed Use Sites
We analyzed apartment or mixed use development at 13 different case study sites in different parts of the Town that are designated in the OCP for Intensive Mixed Use, Neighbourhood Mixed Use or Mixed Residential.
Site 1 – Hospital Way
This site is located on Hospital Way across from the Victoria General Hospital. This vacant property is about 300,000 square feet in size and is currently zoned a combination of P-2 and C-1. The existing Intensive Mixed Use OCP designation supports mixed use development at a maximum height of 5 storeys and a density of 2.5 FSR.
Site 2 – Erskine Lane
This site is located on Erskine Lane in the Hospital neighbourhood. The site is improved with an older single family home and the lot is about 47,000 square feet in size. The site is currently zoned A-3. The existing Intensive Mixed Use OCP designation supports mixed use development at a maximum height of 5 storeys and a density of 2.5 FSR.
Site 4 – Helmcken Road
This site is located on Helmcken Road in the Hospital neighbourhood. It is an assembly of five properties improved with older single family homes and a low density commercial building. The assembled lot is about 48,000 square feet in size. The site is currently zoned a combination of C-4 and R-1B. The existing Neighbourhood Mixed Use OCP designation supports mixed use development at a maximum height of 4 storeys and a density of 1.5 FSR.
Site 5 – Conard Street
This site is located on Conard Street in the Hospital neighbourhood. It is an assembly of four properties improved with older single family homes. The assembled lot is about 27,000 square feet in size and is currently zoned R-1B. The existing Neighbourhood Mixed Use OCP designation supports mixed use development at a maximum height of 4 storeys and a density of 1.5 FSR.
Site 6a – Island Highway
This site is located on the Island Highway in the Harbour neighbourhood. It is an assembly of two properties that include an existing rental building plus vacant land. The assembled lot is about 23,000 square feet in size and the existing zoning is C-1. The existing Neighbourhood Mixed Use OCP designation supports mixed use development at a maximum height of 4 storeys and a density of 1.5 FSR.
Site 6b – Island Highway
This site is adjacent to site 6a and is located on the Island Highway in the Harbour neighbourhood. It is currently improved with an older 10,000 square foot commercial building. The lot is about 38,000 square feet in size and the existing zoning is C-1. The existing Neighbourhood Mixed Use OCP designation supports mixed use development at a maximum height of 4 storeys and a density of 1.5 FSR.
Site 7 – Island Highway
This site is located on the Island Highway in the Wilfert neighbourhood. It is currently improved with an older 4,000 square foot service commercial building. The lot is about 32,000 square feet in size and the existing zoning is C-1. The existing Neighbourhood Mixed Use OCP designation supports mixed use development at a maximum height of 4 storeys and a density of 1.5 FSR.
Site 8 – Chancellor Avenue
This site is located on Chancellor Avenue in the Wilfert neighbourhood. It is an assembly of three properties improved with older single family homes. The assembled lot is about 35,000 square feet in size and the site is currently zoned R-1B. The existing Neighbourhood Mixed Use OCP designation supports mixed use development at a maximum height of 4 storeys and a density of 1.5 FSR.
Site 9 – Island Highway
This site is located on the Island Highway in the Wilfert neighbourhood. It is currently improved with an older 46,000 square foot strip commercial building. The lot is about 106,000 square feet in size and the existing zoning is C-7. About 30% of the property is not developable due to steep terrain and adjacent riparian area. The existing Commercial OCP designation supports development at a maximum height of 4 storeys and a density of 2.5 FSR.
Site 10 – Island Highway
This site is located on the Island Highway in the Wilfert neighbourhood. It is currently improved with an older commercial building used as an auto dealership. The lot is about 88,000 square feet in size and the existing zoning is C-7. About 40% of the property is not developable due to steep terrain and adjacent riparian area. The existing Commercial OCP designation supports development at a maximum height of 4 storeys and a density of 2.5 FSR.
Site 11 – Island Highway
This site is located on the Island Highway in the Harbour neighbourhood. It is an assembly of three properties improved with older single family homes. The assembled lot is about 46,000 square feet in size and the site is currently zoned R-1. The existing Mixed Residential OCP designation supports multifamily development at a maximum height of 4 storeys and a density of 1.5 FSR.
Site 12 – Island Highway
This site is located on the Island Highway in the Harbour neighbourhood. It is an assembly of three properties improved with an older duplex and two rental properties (former motel). The assembled lot is about 130,000 square feet in size and the site is currently zoned C-5. The existing Mixed Residential OCP designation supports multifamily development at a maximum height of 4 storeys and a density of 1.5 FSR.
Site 13 – Island Highway
This site is located on the Island Highway in the Harbour neighbourhood. It is an assembly of two properties improved with an older single family home and an older low density rental building. The assembled lot is about 40,000 square feet in size and the site is currently zoned a combination of R-1 and RM-1. The existing Mixed Residential OCP designation supports multifamily development at a maximum height of 4 storeys and a density of 1.5 FSR.
4.2.1.2 Town Centre
We analyzed one large parcel that is located in the planned Town Centre area.
Site 3 – Town Centre
This site is located in the planned future Town Centre for View Royal. It is currently a portion of an existing RV park and has a total land area of about 300,000 square feet. The property is currently zoned C-6 and designated Intensive Mixed Use in the OCP. This designation supports mixed use development at a maximum height of 5 storeys and a density of 2.5 FSR.
If this site was redeveloped, a significant portion would need to be dedicated to create new roads, services and park space so the useable land area for development would be significantly lower.
4.2.1.3 Townhouse Sites
We analyzed townhouse development at seven different case study sites. Some of these sites were also analyzed for apartment and mixed commercial and apartment development (outlined above).
Site 2 – Erskine Lane (Description same as Section 4.2.1.1)
Site 5 – Conard Street (Description same as Section 4.2.1.1)
Site 8 – Chancellor Avenue (Description same as Section 4.2.1.1)
Site 11 – Island Highway (Description same as Section 4.2.1.1)
Site 12 – Island Highway (Description same as Section 4.2.1.1)
Site 13 – Island Highway (Description same as Section 4.2.1.1)
Site 14 – Conard Street
This site is located on Conard Street in the Hospital neighbourhood. It is an assembly of four properties improved with older single family homes. The assembled lot is about 23,000 square feet in size and the site is currently zoned R1-B. The existing Residential OCP designation supports single family housing or townhouse units up to 0.6 FSR.
4.2.1.4 Commercial and Industrial Sites
We analyzed commercial development (office and/or mixed retail and office) at five different case study sites in different parts of the Town. Each site is in a location that is designated for commercial or mixed use. Some of these sites were also analyzed for apartment and mixed commercial and apartment development (outlined above).
Site 1 – Hospital Way (Description same as Section 4.2.1.1)
Site 7 – Island Highway (Description same as Section 4.2.1.1)
Site 8 – Chancellor Avenue (Description same as Section 4.2.1.1)
Site 9 – Island Highway (Description same as Section 4.2.1.1)
Site 10 – Island Highway (Description same as Section 4.2.1.1)
4.2.1.5 Infill Sites
We analyzed the financial viability of infill development (duplex, quadruplex) on two existing single family lots in the Town.
Site 15 – Conard Street Lot
This single family lot is located on Conard Street in the Hospital neighbourhood. It is currently improved with an older home. The lot is about 5,700 square feet in size and the existing zoning is R-1B.
Site 16 – Vickery Road Lot
This single family lot is located on Vickery Road in the Helmcken neighbourhood. It is currently improved with an older home. The lot is about 10,900 square feet in size and the existing zoning is R-1B.
4.3 Key Assumptions
4.3.1 Key Financial Assumptions
The financial assumptions used in our analysis are based on detailed market research completed during late 2020.
4.3.1.1 Value of Completed Buildings
The revenue assumptions for our analysis can be summarized as follows:
- Strata apartment units are assumed to achieve average sales prices of about $650 per square foot (assuming 4 to 6 storey woodframe buildings).
- Grade level retail and service space is assumed to have a completed value of about $465 to $470 per square foot. This is based on an average lease rate of $27 per square foot net, a vacancy allowance of 5% and a cap rate of 5.5%.
- Office space is assumed to have a completed value of about $450 per square foot. This is based on an average lease rate of $26 per square foot net, a vacancy allowance of 5% and a cap rate of 5.5%.
- Light industrial space is assumed to have a completed value of about $350 per square foot. This is based on an average lease rate of $17 per square foot net, a vacancy allowance of 1.5% and a cap rate of 4.75%.
- Townhouse units are assumed to achieve average sales prices of about $475 per square foot, assuming average unit sizes in the range of 1,400 to 1,500 square feet.
- Sales prices per square foot range widely for infill units depending on the unit size. For large duplex units (3,800 sf), our analysis assumes a sales price of $250 per square foot (about $950,000 for the unit). For smaller infill houseplex units (1,200 sf), our analysis assumes a sales price of $500 per square foot (about $600,000 for the unit).
4.3.1.2 Hard Construction Costs
The hard construction cost assumptions for our analysis can be summarized as follows:
- Strata apartment hard costs range between $230 and $250 per square foot of gross residential floor area depending on building height (plus parking). Costs for taller 6 storey woodframe building are higher than costs for 4 storey woodframe buildings.
- Hard costs for office, retail and service space in mixed use buildings or multi-storey buildings are $260 per square foot of commercial floorspace. Parking is in addition.
- Hard costs for industrial space are $125 per square foot plus $175 per square foot of mezzanine space. Parking is in addition.
- Townhouse hard costs are $220 per square foot of gross residential floor area (garage parking is included).
- Infill unit hard costs are $280 to $290 per square foot of gross residential floor area (parking is included).
- Parking construction costs average about $55,000 per stall for underground parking and about $5,000 per stall for surface parking. Parking for townhouse and infill units is already factored into the residential hard cost figure.
4.3.1.3 Other Costs and Allowances
Other key cost assumptions and allowances are as follows.
- An allowance for costs associated with rezoning is included.
- The Town’s current target fixed rate CAC of $3,500 per residential unit is included.
- A demolition allowance is included based on the size and number of existing buildings.
- A site servicing allowance is included based on the site frontage of each property (sidewalks, curbs, pavement, landscaping).
- A tenant fit-up allowance is included for commercial space.
- Soft costs and professional fees are set at 8% of hard construction costs. This covers application fees, design, engineering, consultants, survey, legal, insurance, warranties, deficiencies, and other professional fees. A separate project management fee of 3% on the hard and soft costs is included.
- A contingency allowance of 5% is included on hard costs, soft costs and the project management fee.
- Marketing costs, sales costs and commissions are included based on typical industry standards.
- Separate allowances are included for property taxes, DCCs, and CRD water service based on current rates.
- Construction financing is charged at 5% per year on 75% of the construction costs.
- Land financing is charged at 5% per year on 50% of the estimated land value. Financing fees are charged at 1% of the assumed loan.
- A developer's profit margin of 15% of project costs (including estimated land value) is included. This is the minimum profit margin that is typically required to obtain the financing that allows private developers to proceed with a new project.
4.3.2 Parking Assumptions
Parking assumptions (and therefore costs) used in our analysis are consistent with the Town’s existing off-street parking requirements. Our analysis assumes:
- 1.5 stalls per residential unit. The current parking requirement ranges from 1.0 stall per unit for studio units up to 2.0 stalls per unit for 3 bedroom units, so the actual overall parking requirement depends on the unit mix. Based on a typical unit mix, we estimate that about 1.4 or 1.5 stalls per unit would be required.
- 4.7 stalls per 1,000 square feet of retail and service space (some service uses have a higher parking requirement so this may be low).
- 3.1 stalls per 1,000 square feet of office space (the requirement is higher for multi-tenant office buildings so this may be low).
- 1.3 stalls per 1,000 square feet of industrial space (the bylaw requirement varies by type of industrial use).
4.4 Summary of Results of Financial Analysis
This section summarizes the results of our financial analysis for each case study site and each redevelopment scenario.
4.4.1 Strata Apartment Redevelopment Scenarios
We analyzed the financial viability of strata apartment development at eleven different case study sites in different parts of the Town.
Some of these sites are currently designated for mixed use development in the OCP (either Intensive Mixed Use or Neighbourhood Mixed Use). Others are designated for residential use in the OCP (either Mixed Residential or Residential). We analyzed the following scenarios:
- 4 storey strata apartment development at a maximum density of 1.6 FSR.
- 6 storey strata apartment development at a maximum density of 2.5 FSR.
The results of our analysis are summarized in Exhibit 4. The exhibit shows the following key information:
- The site number for our analysis^5.
- The location of the site.
- A description of the existing use(s).
- The current zoning.
- The total size of the assembled property.
- The density and height supported by the current OCP designation.
- The minimum land value that a redevelopment scenario needs to support in order for redevelopment to be viable. This is the estimated value of the property under its existing use^6.
- The estimated land value supported by each of the rezoning and redevelopment scenarios. If this value is equal to or higher than the value under the existing use, then the redevelopment scenario is financially viable.
Each rezoning and redevelopment scenario is colour-coded to indicate whether or not the scenario is financially viable as follows:
- Scenarios that are financially viable are shown in green.
- Scenarios that are not financially viable are shown in red.
- Scenarios that would be viable with slightly higher unit sales prices or slightly reduced profit margins are shown in yellow. These scenarios may be viable if multifamily sales prices in View Royal increase or if developers are willing to accept reduced profit margins on new projects.
^5 Specific addresses and property identifiers have not been included in this report for confidentiality reasons. ^6 This figure represents the value of the property supported by its existing use. It is possible that the existing land value under current zoning is higher. So, the actual market value of the property under existing zoning may be higher than the figure shown in these exhibits. However, for redevelopment to be viable, the redevelopment scenario only needs to support a land value that is equal to or higher than the value of the existing use.
Exhibit 21 – Summary of Apartment Redevelopment Scenarios
| Road | Neighbour- hood | Description | Zoning | Site Size (SF) | OCP Allowable FSR | OCP Max Height (Storeys) | Minimum Required Redevelopment Land Value | Estimated Land Value Supported by Redevelopment Scenario: 4 Storey Apartment at 1.6 FSR | Estimated Land Value Supported by Redevelopment Scenario: 6 Storey Apartment at 2.5 FSR | |
|---|---|---|---|---|---|---|---|---|---|---|
| 1 | Hospital Way | Hospital | Vacant | P-2 + C-1 | 299,518 | 2.5 | 5 | $5,176,000 | $27,669,502 | $27,611,753 |
| 2 | Erskine Lane | Hospital | Old SFH | A-3 | 47,262 | 2.5 | 5 | $974,000 | $4,381,307 | $4,395,850 |
| 4 | Helmcken Rd | Hospital | Commercial plus 4 Old SFDs | C-4 + R-1B | 48,506 | 1.5 | 4 | $4,598,880 | $4,206,381 | $4,237,964 |
| 5 | Conard St | Hospital | 4 Old SFDs | R-1B | 27,441 | 1.5 | 4 | $2,831,520 | $2,366,179 | $2,468,772 |
| 6a | Island Hwy | Harbour | Rental Units and Vacant Lot | C-1 | 23,436 | 1.5 | 4 | $1,878,221 | $1,774,487 | $1,809,623 |
| 6b | Island Hwy | Harbour | Older Commercial | C-1 | 38,261 | 1.5 | 4 | $2,791,575 | $3,389,583 | $3,354,943 |
| 8 | Chancellor Ave | Hospital | 3 Old SFDs | R1-B | 34,848 | 1.5 | 4 | $2,383,800 | $3,093,020 | $3,119,311 |
| 11 | Island Hwy | Harbour | 3 Old SFDs | R-1 | 46,609 | 1.5 | 4 | $1,292,400 | $4,499,452 | $4,544,229 |
| 12 | Island Hwy | Harbour | Duplex, Rental | C-5 | 130,680 | 1.5 | 4 | $4,635,680 | $11,654,289 | $11,897,366 |
| 13 | Island Hwy | Harbour | 1 Old SFD and Rental Townhouses | R-1 + RM-1 | 40,510 | 1.5 | 4 | $3,254,840 | $3,398,145 | $3,459,582 |
| 14 | Conard St | Hospital | 4 Old SFDs | R1-B | 22,649 | 0.6 | 2.5 | $2,699,160 | $1,931,624 | $1,903,339 |
Note: Bold values correspond to "Green" (viable) in original document. Standard text corresponds to "Red" (not viable) or "Yellow" (marginal).
The key implications of our apartment analysis are:
- 4 to 6 storey strata apartment development is financially attractive (or almost financially attractive) at the sites we tested. If permitted strata apartment densities are about 1.6 FSR or more, we would expect sites improved with older houses and older low density commercial buildings to be attractive for redevelopment.
- The most challenging sites for redevelopment are assemblies of single family homes with smaller lot sizes and sites that have existing income producing buildings (rental or commercial) that can generate a significant income under existing use.
4.4.2 Mixed Use Redevelopment Scenarios
We analyzed the financial viability of mixed use development (apartment with retail) at eight different case study sites in different parts of the Town.
These sites are currently designated for mixed use development in the OCP (either Intensive Mixed Use or Neighbourhood Mixed Use). For the mixed use sites, we analyzed the financial performance of redevelopment for two different scenarios, including:
- 4 storey mixed use commercial and strata apartment development at a maximum density of 2.0 FSR.
- 6 storey mixed use commercial and strata apartment development at a maximum density of 3.0 FSR.
Exhibit 22 – Summary of Mixed Use Apartment and Commercial Redevelopment Scenarios
| Road | Neighbour- hood | Description | Zoning | Site Size (SF) | OCP Allowable FSR | OCP Max Height (Storeys) | Minimum Required Redevelopment Land Value | Estimated Land Value Supported by Redevelopment Scenario: 4 Storey Apt over Comm at 2.0 FSR | Estimated Land Value Supported by Redevelopment Scenario: 6 Storey Apt over Comm at 3.0 FSR | |
|---|---|---|---|---|---|---|---|---|---|---|
| 1 | Hospital Way | Hospital | Vacant | P-2 + C-1 | 299,518 | 2.5 | 5 | $5,176,000 | $18,853,012 | $13,991,076 |
| 4 | Helmcken Rd | Hospital | Commercial plus 4 Old SFDs | C-4 + R-1B | 48,506 | 1.5 | 4 | $4,598,880 | $2,801,029 | $1,898,562 |
| 6a | Island Hwy | Harbour | Rental Units, Vacant Lot | C-1 | 23,436 | 1.5 | 4 | $1,878,221 | $1,130,606 | $755,663 |
| 6b | Island Hwy | Harbour | Older Commercial | C-1 | 38,261 | 1.5 | 4 | $2,791,575 | $2,706,457 | $2,071,843 |
| 7 | Island Hwy | Wilfert | Older Service Commercial | C-3 | 31,363 | 1.5 | 4 | $1,705,600 | $1,632,789 | $1,175,509 |
| 8 | Chancellor Ave | Hospital | 3 Old SFDs | R1-B | 34,848 | 1.5 | 4 | $2,383,800 | $2,041,438 | $1,499,335 |
| 9 | Island Hwy | Wilfert | Old Strip Retail | C-7 | 106,025 | 2.5 | 4 | $4,830,255 | $4,631,277 | $3,249,940 |
| 10 | Island Hwy | Wilfert | Auto Dealership | C-7 | 87,991 | 2.5 | 4 | $3,600,000 | $3,255,340 | $3,114,241 |
Note: Bold values correspond to "Green" (viable) in original document. Standard text corresponds to "Red" (not viable) or "Yellow" (marginal).
The key implications of our mixed use analysis are:
- 4 to 6 storey mixed use development is marginal from a financial perspective at the densities tested.
- For mixed use development to be financially attractive, we would expect minimum densities of about 2.0 FSR (in 4 storeys) and 3.0 FSR (in 6 storey) to be required. At these densities mixed use development will likely only be financially attractive on sites that are improved with very low value existing uses.
- Mixed use development does not perform as well as pure strata apartment development (despite higher assumed densities) because the commercial component of a mixed use project is less valuable than the residential component. In addition, the costs associated with the grade level commercial space are higher than the residential component due to the requirement for concrete construction and due to a higher parking requirement.
- Developers will likely look for opportunities to minimize project costs by limiting the amount of commercial space in a mixed use project.
- To improve the economics of mixed use apartment and commercial development, the Town could consider reducing the off-street parking requirements, particularly for commercial uses.
4.4.3 Town Centre
A portion of the Helmcken neighbourhood is identified in the existing OCP as the future Town Centre for View Royal. Much of the Town Centre area is currently used for an RV Park.
We analyzed the financial viability of mixed use development (apartment with retail) on a 7 acre portion of the overall property identified as the Town Centre.
Our analysis made the following key assumptions about the development potential of the property:
- About 35% of the land will be required for new roads, park space and other dedications. This is based on our review of other large Town Centre locations and master planned communities.
- Servicing and infrastructure costs to create the new development parcels at the property will total a minimum of about $600,000 per acre. This is based on the lower end of costs for larger master planned communities that we have on file.
We analyzed the financial performance of redevelopment for two different density scenarios on the estimated net developable land area, including:
- 4 to 6 storey mixed use commercial and strata apartment development at a density of 2.0 FSR, with about 20% of the floorspace used for commercial and 80% for strata apartment.
- 4 to 6 storey mixed use commercial and strata apartment development at a density of 2.5 FSR, with about 20% of the floorspace used for commercial and 80% for strata apartment.
Exhibit 23 shows the estimated minimum required redevelopment land value for this site as a range. The range in existing use value depends on our assumption about the rents that can be generated by the existing RV sites at the property.
Exhibit 23 – Summary of Town Centre Site Scenarios
| Road | Neighbour- hood | Description | Zoning | Site Size (SF) | OCP Allowable FSR | OCP Max Height (Storeys) | Minimum Required Redevelopment Land Value | Estimated Land Value Supported by Redevelopment Scenario: Town Centre at 2.0 FSR | Estimated Land Value Supported by Redevelopment Scenario: Town Centre at 2.5 FSR |
|---|---|---|---|---|---|---|---|---|---|
| Island Hwy | Helmcken | RV Park | C-6 | 297,950 | 2.5 | 5 | $7.8 million to $16.0 million | $6,742,987 | $10,032,844 |
The key implications of our Town Centre site analysis are:
- The potential income that can likely be generated by the existing RV park use is high, making the site valuable under its existing use. In addition, costs associated with servicing and infrastructure that will likely be required to allow development to proceed will be significant, which negatively impacts the financial viability of redevelopment compared to a property that does not require new roads and services.
- Redevelopment of the Town Centre site at the densities we tested is marginal from a financial perspective.
- Over time, we would expect the viability of redevelopment to improve if the value of new strata apartment units and commercial space continue to increase.
To help improve development economics, this site could be considered for taller buildings in order to increase the achievable density, although this would result in concrete construction (or mass timber) which may not be financially viable in the short term (as the cost of concrete construction is high compare with woodframe). However, if unit prices continue to increase, we would expect concrete construction to become financially viable. So, permitting taller buildings in this location could improve redevelopment economics at this location over time.
4.4.4 Townhouse Scenarios
We analyzed the financial viability of townhouse development at seven different case study sites in different parts of the Town.
We analyzed two different townhouse scenarios:
- Townhouse development at 0.6 FSR with garage parking. This density can be achieved in existing townhouse zoning districts in View Royal.
- Townhouse development at 0.9 FSR with garage parking. This is not consistent with View Royal’s existing townhouse districts but is achieved in other municipalities in BC. This is likely the maximum townhouse density achievable without underground parking.
The results of our analysis are summarized in Exhibit 24.
Exhibit 24 – Summary of Townhouse Redevelopment Scenarios
| Road | Neighbour- hood | Description | Zoning | Site Size (SF) | OCP Allowable FSR | OCP Max Height (Storeys) | Minimum Required Redevelopment Land Value | Estimated Land Value Supported by Redevelopment Scenario: Townhouses at 0.6 FSR | Estimated Land Value Supported by Redevelopment Scenario: Townhouses at 0.9 FSR | |
|---|---|---|---|---|---|---|---|---|---|---|
| 2 | Erskine Lane | Hospital | Old SFD | A-3 | 47,262 | 2.5 | 5 | $974,000 | $2,342,680 | $3,853,284 |
| 5 | Conard St | Hospital | 4 Old SFDs | R-1B | 27,441 | 1.5 | 4 | $2,831,520 | $1,227,431 | $2,095,743 |
| 8 | Chancellor Ave | Hospital | 3 Old SFDs | R1-B | 34,848 | 1.5 | 4 | $2,383,800 | $1,589,778 | $2,688,162 |
| 11 | Island Hwy | Harbour | 3 Old SFDs | R-1 | 46,609 | 1.5 | 4 | $1,292,400 | $2,496,532 | $3,984,857 |
| 12 | Island Hwy | Harbour | Duplex, Rental | C-5 | 130,680 | 1.5 | 4 | $4,635,680 | $6,181,515 | $10,345,733 |
| 13 | Island Hwy | Harbour | 1 Old SFH and Rental Townhouses | R-1 + RM-1 | 40,510 | 1.5 | 4 | $3,254,840 | $1,686,649 | $2,978,208 |
| 14 | Conard St | Hospital | 4 Old SFDs | R1-B | 22,649 | 0.6 | 2.5 | $2,699,160 | $926,116 | $1,653,540 |
Note: Bold values correspond to "Green" (viable) in original document. Standard text corresponds to "Red" (not viable) or "Yellow" (marginal).
The key implications of our townhouse analysis are:
- Townhouse development is viable at assemblies of larger single family lots (e.g., 10,000 square feet or larger) and at commercial and rental properties with very low value existing improvements.
- Townhouse development at smaller single family lots (6,000 to 7,000 square feet or less) is not viable due to the higher existing lot value per square foot for the smaller lots.
- At the current maximum permitted townhouse density in the Town’s zoning districts (0.6 FSR), there are few types of properties that will be financially viable for townhouse development. If the Town wants to encourage townhouse development, densities of at least 0.8 FSR to 0.9 FSR should be considered.
4.4.5 Commercial Scenarios
We analyzed the financial viability of commercial development (stand-alone office or office with retail) at five different case study sites in different parts of the Town.
These sites are currently designated Intensive Mixed Use, Neighbourhood Mixed Use or Commercial in the OCP allowing maximum heights of 4 to 5 storeys and densities of 1.5 to 2.5 FSR. We analyzed the financial performance of redevelopment for two different scenarios, including:
- Commercial at 0.55 FSR, assuming surface parking. This is the estimated maximum density that can be achieved if all of the required parking is provided at surface. The building would likely be two or three storeys.
- Commercial with underground parking at a density of 1.4 FSR. This assumes one level of underground parking with the remaining parking provided at surface. The building would likely be four or five storeys.
The results of our analysis are summarized in Exhibit 25.
Exhibit 25 – Summary of Commercial Redevelopment Scenarios
| Road | Neighbour- hood | Description | Zoning | Site Size (SF) | OCP FSR | OCP Max Height (Storeys) | Minimum Required Redevelopment Land Value | Estimated Land Value Supported by Redevelopment Scenario: Office over Retail at 0.55 FSR | Estimated Land Value Supported by Redevelopment Scenario: Office at 1.4 FSR | |
|---|---|---|---|---|---|---|---|---|---|---|
| 1 | Hospital Way | Hospital | Vacant | P-2 /C-1 | 299,518 | 2.5 | 5 | $5,176,000 | none | none |
| 7 | Island Hwy | Wilfert | Service Commercial | C-3 | 31,363 | 1.5 | 4 | $1,705,600 | none | none |
| 8 | Chancellor Ave | Hospital | 3 Old SFDs | R1-B | 34,848 | 1.5 | 4 | $2,383,800 | none | none |
| 9 | Island Hwy | Wilfert | Old Strip Retail | C-7 | 106,025 | 2.5 | 4 | $4,830,255 | none | none |
| 10 | Island Hwy | Wilfert | Auto Dealership | C-7 | 87,991 | 2.5 | 4 | $3,600,000 | none | none |
Note: "none" in red cells indicates no supportable land value after costs.
The key implications of our commercial analysis are:
- Stand-alone office (or office plus retail) development is not financially viable under current market conditions. Under current market conditions, profit margins would be very low on any new commercial development.
- Increasing the permitted density for commercial development does not improve the economics of redevelopment because increased density will result in a requirement for underground (or structured) parking. The additional costs associated with the parking outweigh the value created by additional office density.
- Under current market conditions, office development will likely only be viable as part of a larger mixed use project that includes a significant residential component.
- If a stand-alone commercial project does proceed in the foreseeable future, we would expect it to be low density retail or office development with surface parking as this form of development keeps project costs as low as possible.
- To improve the economics of commercial development, the Town could consider reducing the off-street parking requirements for office and retail uses.
4.4.6 Light Industrial-Office Scenarios
We analyzed the financial viability of light industrial development and stacked industrial development (office over industrial) at two different case study sites in the Wilfert neighbourhood along the Island Highway corridor. The sites are currently used for lower density service commercial.
This form of higher density stacked industrial development is starting to occur in other municipalities on southern Vancouver Island (such as Colwood) as well as in the Metro Vancouver area. It could accommodate business similar to Reliance Controls which is one of the larger existing office users in View Royal.
The case study sites are currently designated for commercial or mixed use development in the OCP. We analyzed the financial performance of redevelopment assuming mixed office and industrial at about 0.90 FSR with surface parking. This is the estimated maximum density that can be achieved if all of the required parking is provided at surface.
The results of our analysis are summarized in Exhibit 26.
Exhibit 26 – Summary of Office-Industrial Redevelopment Scenarios
| Road | Address | Neighbour- hood | Description | Zoning | Site Size (SF) | OCP Allowable FSR | OCP Max Height (Storeys) | Minimum Required Redevelopment Land Value | Estimated Land Value Supported by Redevelopment Scenario: Office over Industrial at 0.90 FSR | |
|---|---|---|---|---|---|---|---|---|---|---|
| 7 | Island Hwy | 472 Island Hwy | Wilfert | Service Commercial | C-3 | 31,363 | 1.5 | 4 | $1,705,600 | $1,538,330 |
| 10 | Island Hwy | 1660 Island Hwy | Wilfert | Auto Dealership | C-7 | 87,991 | 2.5 | 4 | $3,600,000 | $2,815,261 |
Note: Bold value corresponds to "Yellow" (marginal/potentially viable) in original document.
The key implications of our mixed office and industrial analysis are:
- Mixed office and light industrial development with surface parking is likely financially viable at sites that are improved with low value existing commercial buildings along the Island Highway corridor.
- Project viability is sensitive to the amount of parking required as a higher parking requirement results in al lower achievable density (with surface parking). Therefore, the Town should ensure that parking requirements are not higher than the minimum amount needed to serve the development.
4.4.7 Infill Housing Scenarios
We analyzed the financial viability of different types of infill housing on single family lots in the Town.
We examined duplex, triplex and other houseplex scenarios on two different sites:
- A smaller (6,000 square foot) single family lot in the Hospital Neighbourhood that is currently improved with an older house.
- A larger (11,000 square foot) single family lot in the Helmcken Neighbourhood that is currently improved with an older house.
For each lot, we analyzed infill scenarios ranging from about 0.7 FSR up to 0.85 FSR (similar to duplex and houseplex densities in other communities).
The key implications of the analysis are as follows:
- The profit margins that will likely be generated by infill housing will be very low (likely less than 5%). So, the economics of infill housing is likely marginal at best under current market conditions.
- Duplex and triplex units will probably not be viable as the unit sizes will be relatively large resulting in high unit prices. If infill units are large, prospective purchasers will likely have options to purchase resale single family houses for a similar price and will likely not be interested in the infill product.
- A minimum of four to six units per single family lot will likely be required in order to make infill housing profitable and of interest to builders. Even at this unit density, profit margins will likely be very low.
- If infill units are permitted, builders will likely focus on larger single family lots (say 10,000 square feet or so) as these lots have a lower existing value per square foot than smaller single family lots. However, if the lot is too large, the resulting unit sizes will be large, which could result in limited interest from buyers due to unit price.
4.5 Implications of Financial Analysis
The key findings from our case study financial analysis are as follows:
- 4 to 6 storey strata apartment redevelopment is financially viable on a wide variety of sites in the Town at densities of 1.6 FSR to 2.5 FSR.
- 4 to 6 storey mixed use redevelopment in the 2.0 FSR to 3.0 FSR is marginal from a financial perspective under current market conditions. For mixed use sites:
- We would expect interest from developers to be focused at vacant sites and sites that are improved with very low value existing improvements.
- Developers will likely look for opportunities to minimize project costs by limiting the amount of commercial space in a mixed use project or seeking a parking variance.
- To improve the economics of mixed use apartment and commercial development, the Town could consider reducing the off-street requirements, particularly for commercial uses.
- Development of the planned Town Centre lands is unlikely to be financially attractive in the short term. This is due to the relatively high value of the property under its current use as an RV park, high costs that will likely need to be incurred to provide the necessary servicing and infrastructure at the site, and the land dedications that would be required for new roads, park and public space. However, over time, the viability of redevelopment will improve if the value of new strata apartment units and commercial space continue to increase. If taller buildings and increased density (likely requiring mass timber or concrete construction) are permitted at these lands, it would likely improve redevelopment prospects over time (taller buildings will likely be financially attractive over time if unit prices continue to increase).
- Townhouse development is currently viable on assemblies of larger single family lots (e.g., 10,000 square feet or larger) and on commercial and rental properties with very low value existing improvements. However, townhouse is not currently viable on assemblies of smaller single family lots (6,000 to 7,000 square feet or less) due to the higher existing lot value per square foot for these smaller lots. If the Town wants to encourage townhouse development, densities of at least 0.8 FSR to 0.9 FSR should be considered.
- A minimum of four to six infill units per existing single family lot will likely be required in order to make infill housing profitable and of interest to builders. However, even at this unit density, profit margins will likely be very low. We would expect builders to focus infill units on larger single family lots (say 10,000 square feet or so) as these lots have a lower existing value per square foot than smaller single family lots.
- Stand-alone office (or office plus retail) development is not financially viable under current market conditions. Under current market conditions, profit margins would be very low on any new stand-alone commercial development. For commercial projects:
- Increasing the permitted density does not improve the economics of redevelopment because increased density will result in a requirement for underground (or structured) parking, which is costly.
- Under current market conditions, office development will likely only be viable as part of a mixed use project that includes a significant residential component.
- If any stand-alone commercial development does proceed in the foreseeable future, we would expect it to be low density retail or office development with surface parking as this form of development keeps project costs as low as possible. This will only be viable on vacant or highly under-utilized sites.
- To improve the economics of commercial development, the Town could consider reducing the off-street requirements for office and retail uses.
- Mixed light industrial and office development (stacked industrial) with surface parking should be financially viable at sites that are improved with low value existing commercial buildings, particularly along the Island Highway corridor in the Wilfert neighbourhood.
5.0 Potential Strategies to Encourage Redevelopment of Under-Utilized Properties
Our financial analysis in Section 4.0 can be used to help identify the land use and development policies (e.g., OCP designations, zoning) that would likely make properties financially attractive for redevelopment.
However, in order for development to occur, existing property owners need to be interested and motivated to sell for redevelopment. This is not always the case. Often, property owners do not want to sell for redevelopment even though the property is worth more as a development site than as an income-producing investment property. There are a number of reasons that this could be the case for any particular property owner, such as:
- Capital gains taxes. If a property has appreciated in value, many owners are hesitant to sell as it can trigger a significant capital gains tax which negatively affects the ability to re-invest into an alternate property.
- Attractive existing income stream. Many under-utilized properties generate significant income for the owner (often with minimal management and risk). Therefore, some property owners prefer to retain the existing income stream rather than sell and look for an alternate investment.
- Expectations of future value increases. Most property owners have seen the value of their property increase materially over time and they anticipate that this trend will continue. Therefore, many are comfortable with holding an existing property in anticipation of future appreciation.
Therefore, the Town asked us to identify tools that could be used to encourage owners to sell for redevelopment. We were asked to consider two general approaches:
- Tools that could improve redevelopment economics and increase existing land values, providing an additional incentive for owners to sell for redevelopment.
- Disincentives that could limit an owner’s interest in retaining the existing use at a property and encourage owners of under-utilized properties to sell for redevelopment.
5.1 Incentives
We considered two different incentives that the Town could use to improve the economics of redevelopment:
- Reducing off-street parking requirements.
- Rezoning of sites by the Town in advance (prezoning).
5.1.1 Reduced Parking Requirements
Our financial analysis indicates that the viability of redevelopment is sensitive to the minimum off-street parking requirements, particularly for mixed use projects.
The Town’s current off-street parking requirements for apartment and retail uses are higher than some other municipalities, particularly the retail parking requirement. Exhibit 27 compares apartment and retail bylaw parking requirements in View Royal with select nearby municipalities, including Sidney, Esquimalt and Langford (it should be noted that many municipalities approve parking reductions on a case-by-case basis).
Exhibit 27 – Parking Comparison with Selected Municipalities
| Use | Apartment | Retail |
|---|---|---|
| View Royal | 1.0 to 2.0 stalls per unit, or about 1.4 to 1.5 stalls per unit depending on unit mix | 4.7 stalls per 1,000 sf |
| Sidney | 1.0 stall per unit | 2.3 stalls per 1,000 sf |
| Esquimalt | 1.3 stalls per unit | 3.7 stalls per 1,000 sf |
| Langford | 1.25 to 2.25 per unit | 3.1 stalls per 1,000 sf |
As shown in the exhibit:
- View Royal’s apartment parking requirements are higher than two of these three municipalities (Langford’s is higher). In addition, our understanding is that View Royal has recently approved parking reductions to between 1.0 and 1.2 stalls per apartment unit for some rezonings.
- View Royal’s retail parking requirements are higher than all three municipalities.
Therefore, we analyzed the impact of reduced parking on the results of some of the mixed use apartment and commercial development scenarios that we analyzed in Section 4.0.
We tested the financial impact of parking reductions as shown the Exhibit 28. These parking assumptions are illustrative only and are not intended to be recommended parking ratios. The intent of this sensitivity analysis is to gauge how reductions in parking can affect the estimated financial performance of a project.
Exhibit 28 – Parking Scenarios Tested
| Use | Base Assumed Parking (Section 5.0) | Assumed Reduced Parking Requirement |
|---|---|---|
| Apartment | 1.5 stalls per unit | 1.25 stalls per unit |
| Retail | 4.7 stalls per 1,000 sf | 2.5 stalls per 1,000 sf |
Exhibit 29 summarizes the estimated impact of the reduced parking requirement for the 4 and 6 storey mixed use redevelopment scenarios for sites 4, 7 and 10. The “b” version of each site assumes the lower parking requirement.
Exhibit 29 – Impact of Reduced Parking on Financial Analysis
| Road | Neighbour- hood | Description | Zoning | Site Size (SF) | OCP Allowable FSR | OCP Max Height (Storeys) | Minimum Required Redevelopment Land Value | Estimated Land Value Supported by Redevelopment Scenario: 4 Storey Apt over Comm at 2.0 FSR | Estimated Land Value Supported by Redevelopment Scenario: 6 Storey Apt over Comm at 3.0 FSR | |
|---|---|---|---|---|---|---|---|---|---|---|
| 4 | Helmcken Rd | Hospital | Commercial plus 4 Old SFDs | C-4 + R-1B | 48,506 | 1.5 | 4 | $4,598,880 | $2,801,029 | $1,898,562 |
| 4b | $4,521,812 | $4,652,453 | ||||||||
| 7 | Island Hwy | Wilfert | Older Service Commercial | C-3 | 31,363 | 1.5 | 4 | $1,705,600 | $1,632,789 | $1,175,509 |
| 7b | $2,693,105 | $2,717,468 | ||||||||
| 10 | Island Hwy | Wilfert | Auto Dealership | C-7 | 87,991 | 2.5 | 4 | $3,600,000 | $3,255,340 | $3,114,241 |
| 10b | $5,311,845 | $5,839,344 |
Note: Bold values correspond to "Green" (viable) in original document.
Reduced off-street parking can significantly increase the land value supported by redevelopment and improve the viability of redevelopment.
Under the current base case parking requirements, the financial viability of all six scenarios that we tested was marginal. With the reduced parking assumptions, all six scenarios tested are viable. This shows that parking reductions can significantly improve the financial viability of redevelopment.
We would expect reduced parking requirements to improve the financial viability of redevelopment for all of the apartment, mixed use and commercial scenarios that we tested as part of our analysis. This could encourage the owners of existing under-utilized properties to sell for redevelopment as developers should be able to offer higher land acquisition prices.
5.1.2 Prezoning
The rezoning process is costly and time consuming and has an uncertain outcome for applicants. If sites are already zoned for development, then the time, risk and cost associated with rezoning is eliminated which will increase interest from developers.
Therefore, to help improve the financial viability of redevelopment, the Town could zone sites in advance for the uses, heights and densities it supports in an updated OCP. This strategy could encourage the owners of existing under-utilized properties to sell for redevelopment as developers may offer higher land acquisition prices.
However, it should be noted that there will likely be drawbacks to this from the Town’s perspective. Prezoning could:
- Reduce the Town’s ability to obtain land dedications for new roads and services from specific sites (if needed).
- Limit the ability to negotiate contributions towards amenities, roads and infrastructure costs as part of the approvals process.
If the Town moves in this direction, we would recommend:
- Only prezoning sites in locations where the Town will not need to negotiated land dedications for new roads, services or public space.
- Only prezoning sites in specific locations where the Town wants to focus development in the short term.
- Designing density bonus zoning districts that offer an outright base density but also create the opportunity to obtain amenity contributions in return for increased bonus density.
5.2 Disincentives
The Town asked us to consider strategies that could create a disincentive for the existing owners of under-utilized properties to retain properties and instead sell for redevelopment. We considered two different strategies:
- Changing zoning to increase property assessments so that the annual property taxes increase and the cost of retaining the existing property increases.
- Enforcing existing zoning bylaws to ensure that property owners are not generating revenue from uses that are not permitted under existing zoning.
5.2.1 Property Taxes
If a property’s assessed value increases relative to other properties in its tax class, then the annual taxes will increase (if the tax rate is not reduced). The Town is interested in understanding whether or not rezoning specific properties could increase the assessed values of under-utilized properties and increase annual property taxes to the owner.
We compared the existing assessed values for a number of under-utilized properties in the Town with our estimate of the market value of each property assuming it was rezoned to allow apartment or mixed use development. We found that the existing assessments are already relatively high for most under-utilized properties likely due to the existing OCP designations that already support apartment or mixed used development at most of these properties. So, rezoning under-utilized properties may not increase the assessed values materially.
Even if the assessed value did increase, it may not create an incentive for the existing property owner to sell for redevelopment for a few different reasons:
- The property owner would likely try to pass any increased taxes onto the tenants or users of the property. Therefore, any increased taxes may not lower the income to the property owner. It may just result in higher costs to the tenants.
- If property tax increases cannot be passed onto tenants, the tax increase would likely need to be substantial to actually incent a property owner to sell because the existing annual net income from most properties is high. We would not expect large property tax increases due to prezoning.
- If total assessments increase across an entire assessment class, municipalities typically reduce the tax rate (at least in part) for that class of property. If assessments increase, but tax rates are reduced, then the overall property taxes for an individual property may not increase.
Overall, we do not think that rezoning under-utilized properties for apartment or mixed use development will necessarily result in an increase in assessed values as the existing assessed values for most under-utilized properties are already reflective the apartment and mixed use OCP designations. Even if the assessment did increase for a specific property, it may not create an incentive for the property owner to sell for redevelopment.
In addition, if sites were prezoned with the intention of increasing the assessed values, this could:
- Reduce the Town’s ability to obtain land dedications for new roads and services (if needed) when the property is redeveloped.
- Limit the ability to negotiate contributions towards amenities, roads and infrastructure costs when the property is redeveloped.
Therefore, we do not think that this is a strategy that the Town should pursue.
5.2.2 Zoning Bylaw Enforcement
The Town indicated that some property owners may be renting space for uses that are not specifically permitted under the current zoning. For example, some properties may be renting space to long term residential tenants despite zoning that restricts the length of tenancies.
If this is true, the Town could consider enforcing the maximum tenancy length permitted at these properties under existing zoning. This would have a negative impact on the income generated by these properties if short term tenancies do not generate the same revenue or result in higher operating and management costs (due to vacancy and tenant turnover). It is difficult to determine whether this strategy would result in affected property owners deciding to sell for redevelopment. However, we think the Town should consider enforcing bylaws that restrict uses that are not permitted under existing zoning.
6.0 Recommendations
Based on our market and financial analysis, the Town asked us to provide recommendations about land use policy for specific subareas in the Town as well other planning tools that could be considered to improve redevelopment opportunities.
6.1 Land Use by Subarea
6.1.1 Hospital Precinct
One of the potential growth areas in the Town is the Hospital Precinct, surrounding Victoria General Hospital. The boundaries of the Hospital Precinct are shown in Exhibit 30.
Exhibit 30 – Hospital Precinct
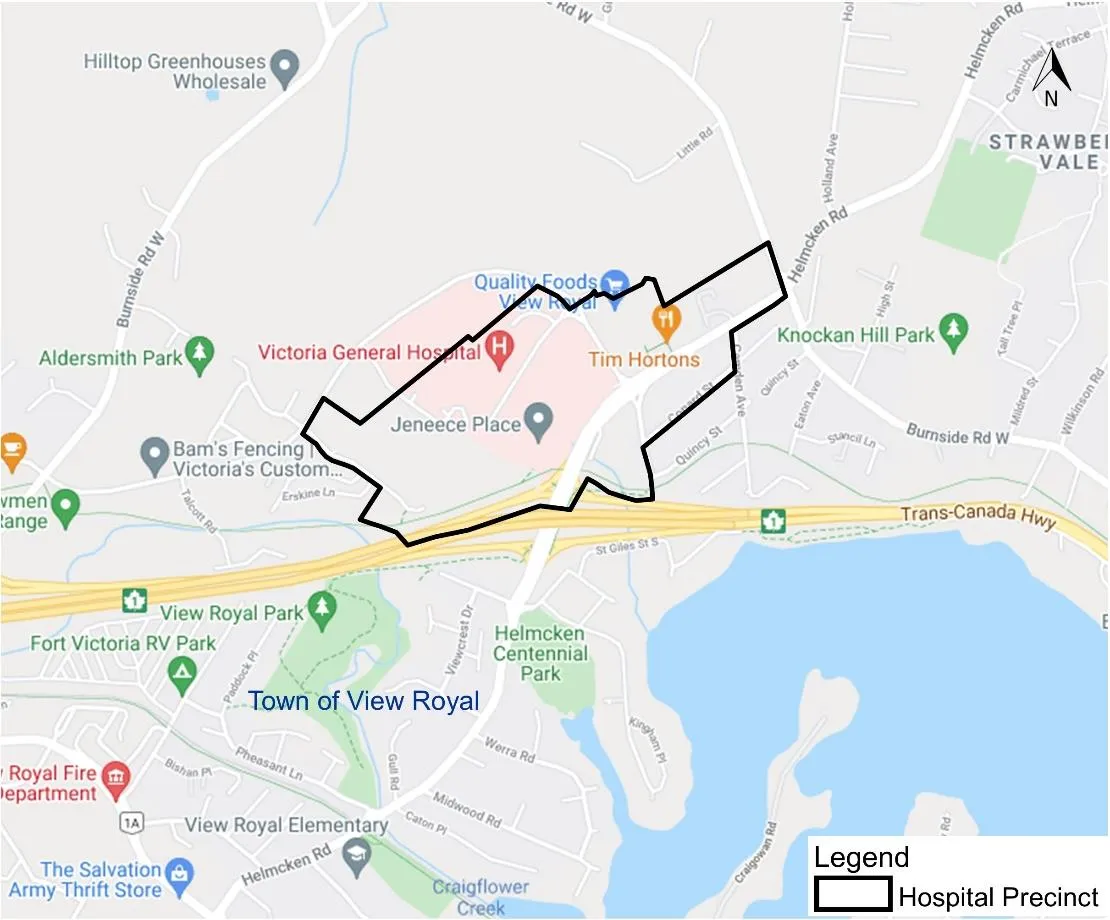
The Town should consider a variety of different opportunities for this neighbourhood:
- Properties fronting on Helmcken Road near Chancellor Avenue/Watkiss Way (across from the Eagle Creek) in the Northern Gateway Community Corridor should be considered for 4 to 6 storey mixed use development at minimum densities in the range of 2.0 FSR to 3.0 FSR. The higher the permitted density, the greater the number of sites that will be financially attractive for redevelopment.
- The vacant properties along Hospital Way adjacent to Victoria General Hospital should be considered for 4 to 6 storey mixed use development at minimum densities in the range of 2.0 FSR to 3.0 FSR. Portions of these properties should be considered for office development to create an opportunity for additional medical related office space. However, apartment development should also be permitted as stand-alone office space is unlikely to be financially attractive to private developers. In addition, the scale of office demand in View Royal is likely to be modest so there is unlikely to be sufficient demand to develop these properties entirely for office use.
- Parking for any commercial space should be permitted to be provided at grade in surface parking lots. However, the parking should be located behind new buildings with the building oriented to the street to help create a more walkable, pedestrian friendly environment. Any new commercial development with surface parking should be planned so that the surface parking can be redeveloped for higher density uses with underground parking over the longer term.
- Properties that are identified by the Town for multifamily residential development in the rest of the Hospital precinct should be considered for 4 to 6 storey apartment development at densities of 1.6 FSR to 2.5 FSR.
6.1.2 Town Centre
Another potential growth area in the Town is the future Town Centre. The boundaries of the future Town Centre are shown in Exhibit 31.
Exhibit 31 – Future Town Centre
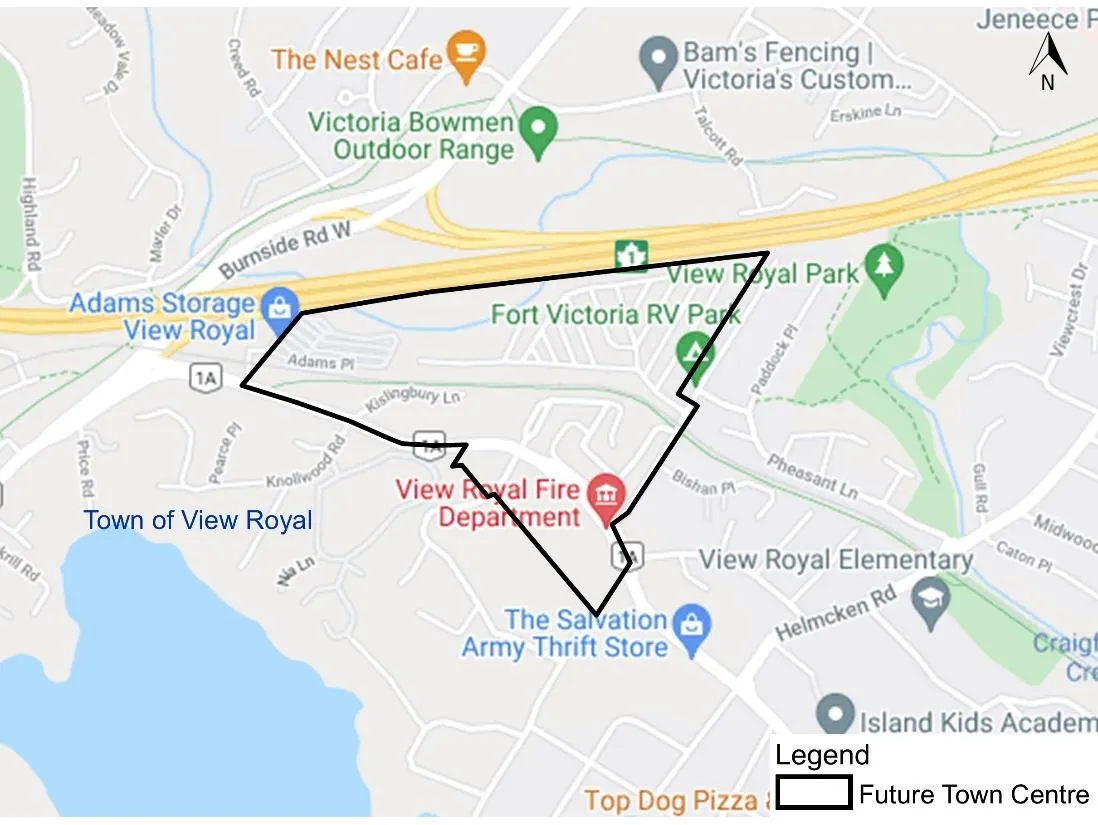
Redevelopment of parcels in the planned Town Centre is unlikely to be financially attractive in the short term because:
- The potential income from the existing uses (RV park) creates significant value to the owner, so land acquisition cost to any developer would be significant.
- Redevelopment of the lands will require new roads and park land (or other public space) which will require land dedications. This will reduce the amount of developable land.
- There will be substantial costs to any developer associated with providing the necessary servicing and infrastructure at the site to allow new development to proceed.
Over time, the viability of redevelopment will improve if the value of new strata apartment units and commercial space in the Town continues to increase.
The Town should treat redevelopment of the planned Town Centre as a longer term prospect. The area should be designated for a mix of apartment, retail and service, and mixed use development.
As part of any future planning for the lands, the Town should consider providing the flexibility to build taller, higher density buildings at these sites. Highrise construction is likely not financially attractive under current market conditions due to the high costs of concrete (or mass timber) construction. However, if apartment unit values continue to increase over time, highrise construction will become increasingly viable. If taller buildings are permitted, it will create the opportunity to achieve increased density which will help improve redevelopment economics for the Town Centre properties over time.
6.1.3 Island Highway Corridor
The Island Highway Corridor is another potential key growth area in the Town. The boundaries of the Commercial Corridor are shown in Exhibit 32.
Exhibit 32 – Island Highway Commercial Corridor
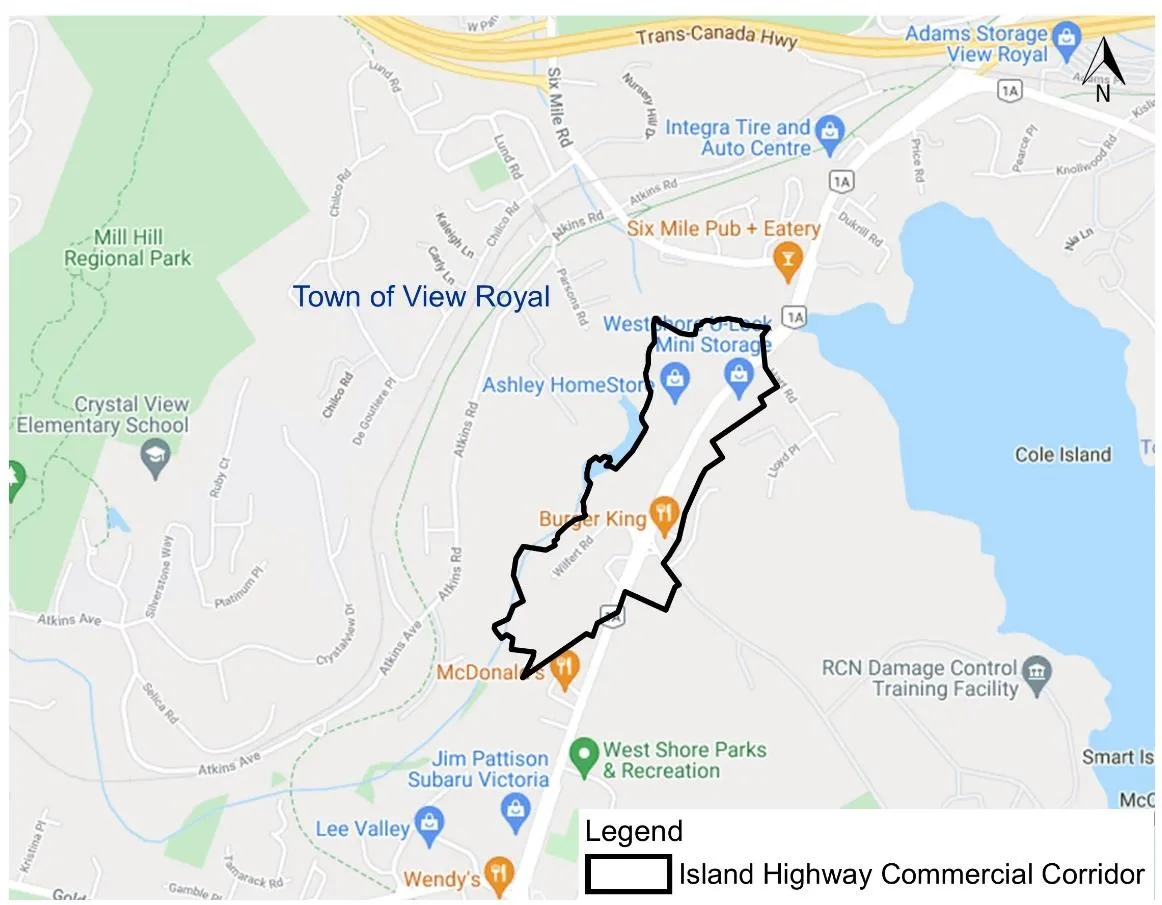
The Island Highway Corridor offers a variety of different opportunities. For portions of the Corridor where the Town wants to restrict residential development (such as the Western Gateway Community Corridor), the Town should consider the following:
- Designate properties for a mix of employment accommodating uses including office, retail and hotel as well as light industrial.
- Allow mixed office and light industrial development (stacked industrial). Higher density stacked industrial development is starting to occur in other municipalities on southern Vancouver Island (such as Colwood) as well as in the Metro Vancouver area. Our financial analysis indicates that this form of development will likely be financially viable at sites that are improved with low value existing commercial buildings. The Island Highway corridor in the Wilfert Neighbourhood is a good candidate for this type of development as it offers relatively large potential redevelopment sites with good vehicular access.
- Continue to allow heights up to four storeys as currently supported by the Commercial designation in the OCP.
- Parking for any commercial space should be permitted to be provided at grade in surface parking lots. However, the parking should be located behind new buildings with the building oriented to the street to help create a more walkable, pedestrian friendly environment. Any new commercial development with surface parking should be planned so that the surface parking can be redeveloped for higher density uses with underground parking over the longer term.
For locations in the Corridor that are envisioned for residential and mixed use development (such as the Helmcken-Harbour Community Corridor):
- Properties identified by the Town for mixed use development should be considered for 4 to 6 storey development at minimum densities in the range of 2.0 FSR to 3.0 FSR. The higher the permitted density, the greater the number of sites that will be financially attractive for redevelopment.
- Properties that are identified by the Town for multifamily residential development should be considered for 4 to 6 storey apartment development at densities of 1.6 FSR to 2.5 FSR.
6.1.4 Mixed Use Areas
For other locations in the Town that are identified for mixed use development, the Town should consider designating properties for 4 to 6 storey development at minimum densities in the range of 2.0 FSR to 3.0 FSR.
6.1.5 Mixed Residential Areas
For other locations in the Town that are identified for mixed residential development, the Town should consider designating properties for 4 to 6 storey apartment development at minimum densities in the range of 1.6 FSR to 2.5 FSR.
6.1.6 Residential Neighbourhoods
Infill housing (duplex, triplex, houseplex) and townhouse development can broaden the type of housing available in a community and can provide housing units that are less expensive than single family homes. However, infill development is often not financially viable for builders unless the permitted density is sufficient.
If the Town wants to encourage infill housing and townhouse development in existing residential neighbourhoods, we suggest the following:
- Explore the opportunity to permit infill housing with a minimum of four to six infill units per existing single family lot. Even at this unit density, profit margins for developers will likely be very low. We would suggest focusing infill units on larger single family lots (say 10,000 square feet or so) as these lots have a lower existing value per square foot than smaller single family lots, making them more attractive for redevelopment from a financial perspective.
- Consider allowing townhouse densities of at least 0.8 FSR to 0.9 FSR. This is likely the maximum density achievable assuming a 3 storey height limit and garage parking, but it is likely required to make assembly and redevelopment of most older single family houses financially viable.
6.2 Other Items
6.2.1 Parking Requirements
The Town should review its existing off-street parking requirements to determine if parking requirements can be reduced for apartment, office, retail and service uses. This will lower the cost of development and create more certainty for developers (rather than applying for a variance) which will improve redevelopment economics.
Parking for any commercial space should be permitted to be provided at grade in surface parking lots. However, the parking should be located behind new buildings with the building oriented to the street to help create a more walkable, pedestrian friendly environment. Any new commercial development with surface parking should be planned so that the surface parking can be redeveloped for higher density uses with underground parking over the longer term.
6.2.2 Prezoning
The Town could prezone sites in advance for the uses, heights and densities that it supports in the updated OCP. However, it should be noted that there will likely be drawbacks to this from the Town’s perspective. Prezoning sites could:
- Reduce the Town’s ability to obtain land dedications for new roads and services (if needed).
- Limit the ability to negotiate contributions towards amenities, roads and infrastructure costs.
If the Town chooses to prezone sites, it should:
- Only prezone sites in locations where the Town will not need to negotiate land dedications for new roads, services or public space. For example, the Town Centre area should not be prezoned.
- Only prezone in the specific locations where the Town wants to focus development in the foreseeable future.
- Design density bonus zoning districts that create the opportunity to obtain amenity contributions in return for bonus density.
6.2.3 Enforcement of Zoning Bylaws to Encourage Redevelopment
The Town indicated that owners of some under-utilized properties may be renting space for uses that are not specifically permitted under the current zoning. For example, some property owners may be renting space to long term residential tenants despite zoning that restricts the length of tenancies.
We think the Town should consider enforcing bylaws that restrict uses which are not permitted under existing zoning. This may encourage owners of these properties to sell for redevelopment sooner than they otherwise would.
7.0 Attachments
Location of Case Study Sites