This site is in beta — data may be incomplete and features are still being added.
Committee of the Whole/Documents/Presentation: Peninsula Streams and Shorelines: View Royal Council Projects
Presentation

Presentation: Peninsula Streams and Shorelines: View Royal Council Projects

March 14, 2023Pages 225–2575 sections

Extensive presentation documenting restoration projects including the Hospital Creek Marsh, Portage Inlet beach restoration, and Mill Stream watershed monitoring.

Hospital Creek Marsh RestorationPortage Inlet Linear Park Beach RestorationCoho Release in Millstream - 2022

Peninsula Streams and Shorelines: View Royal Council Projects Presentation

Kyle Armstrong MSc Restoration Coordinator March 2023


Areas of Focus

  • Research & Advocacy
  • Stewardship & Restoration
  • Education & Outreach

Town of View Royal Parks and Trails Map
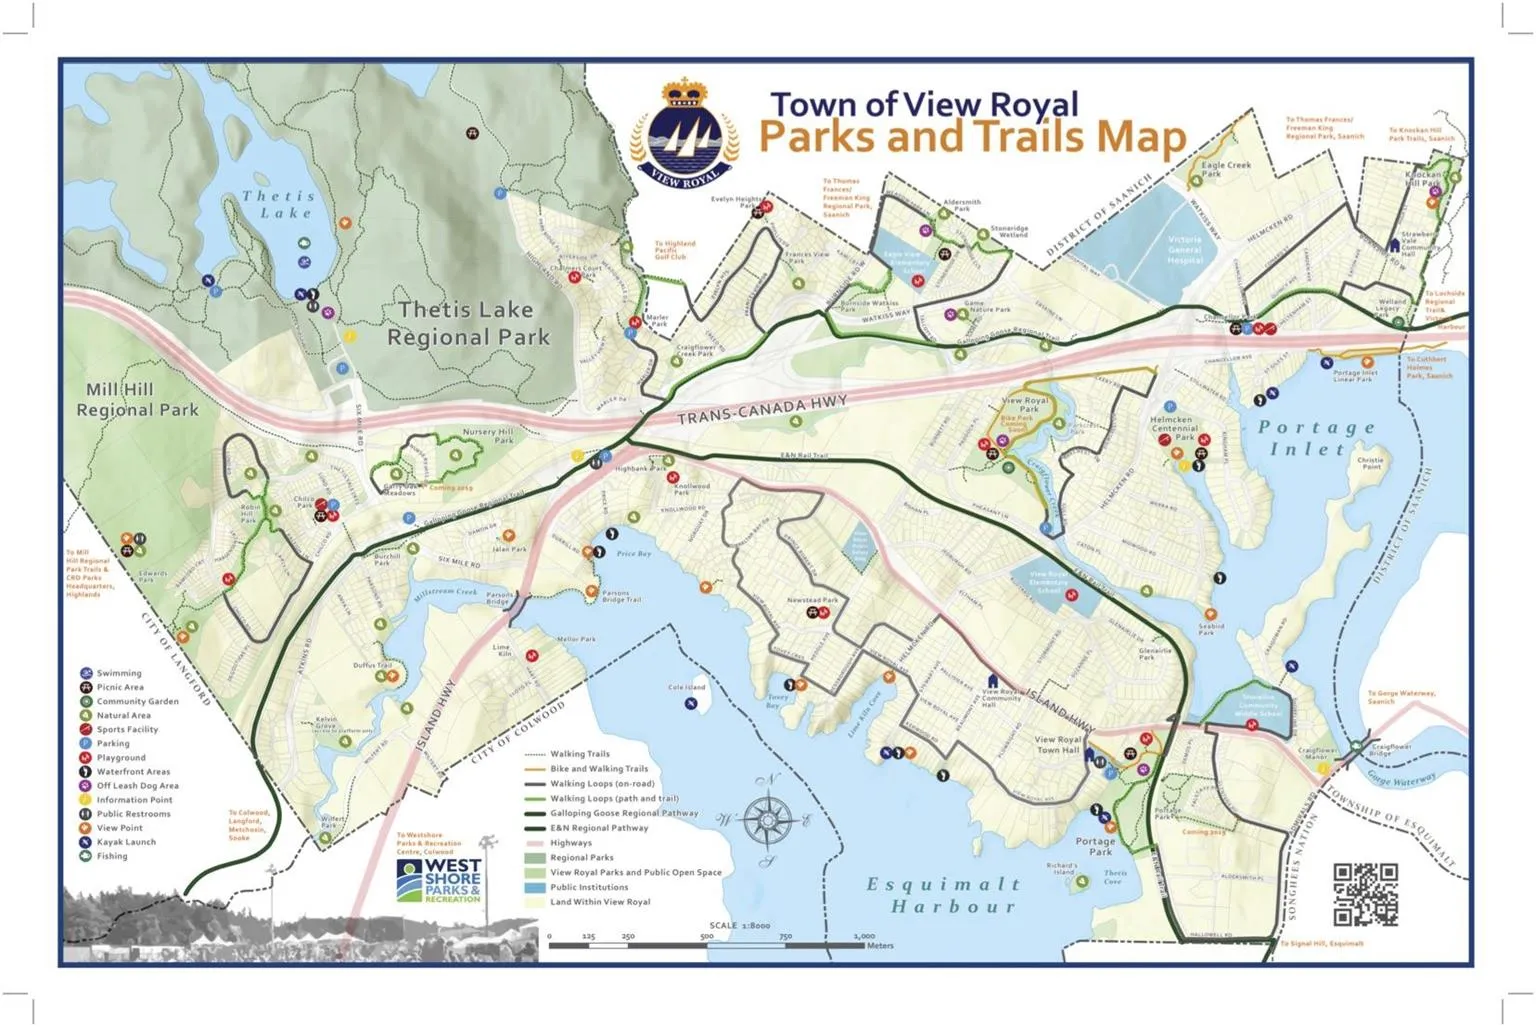
Comprehensive Parks and Trails Map for the Town of View Royal, highlighting regional parks, walking trails, and public institutions.

Strait of Georgia Marine Reference Guide
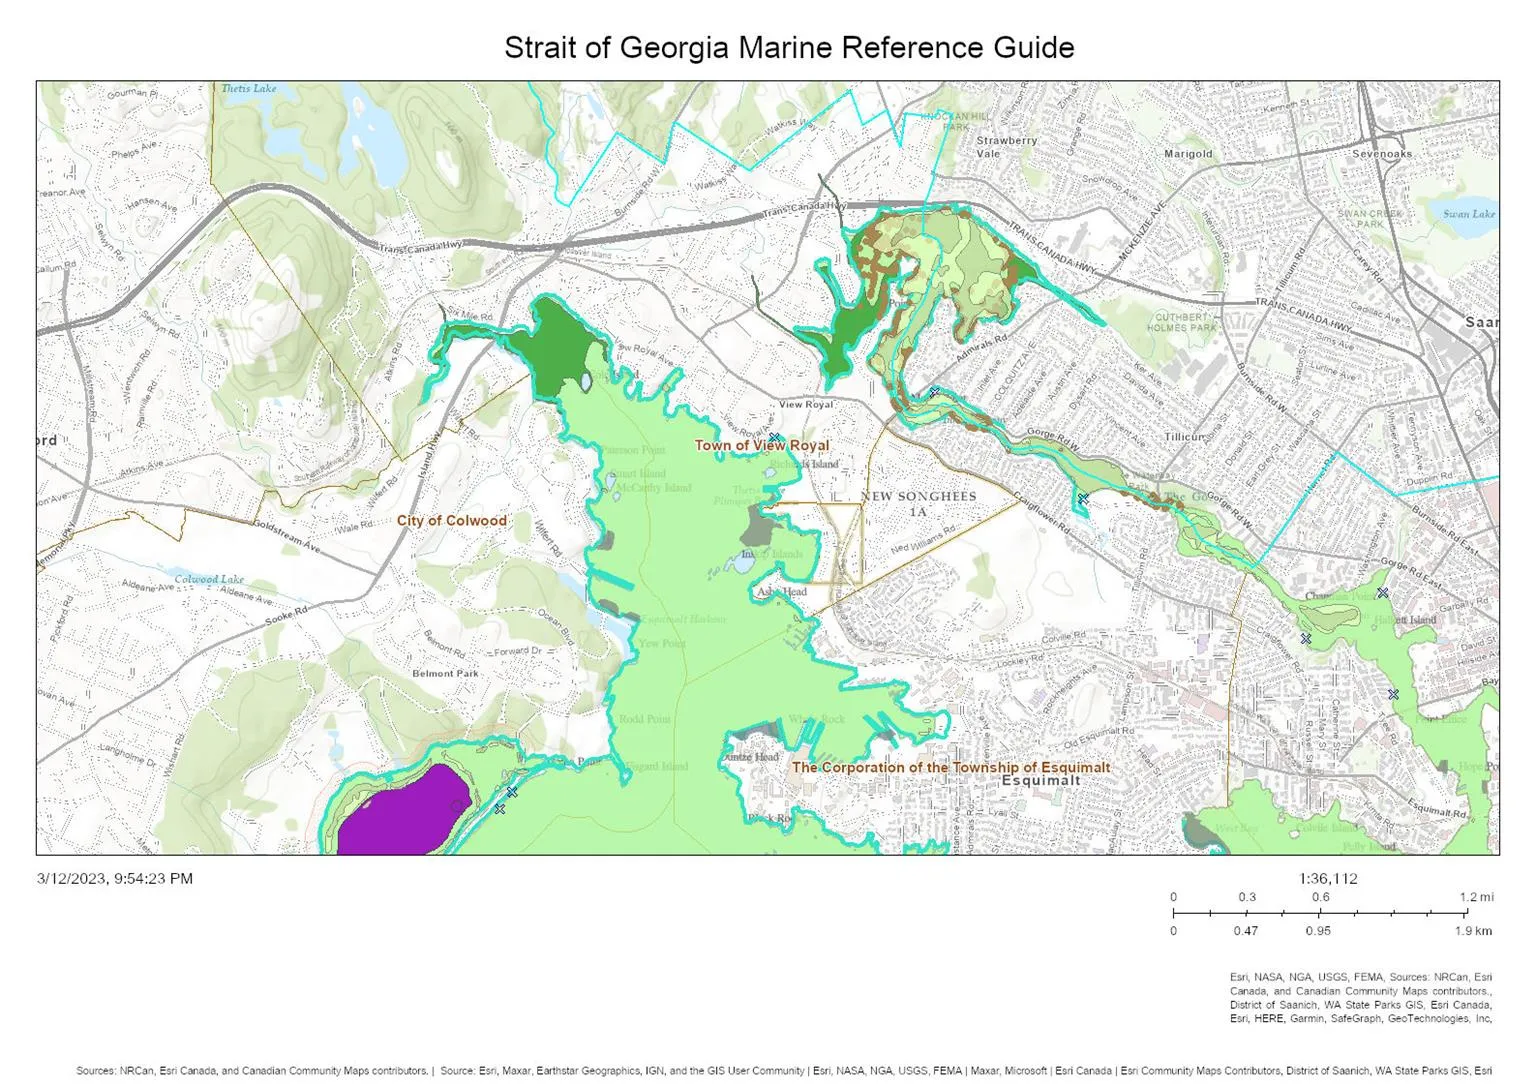
Map from the Strait of Georgia Marine Reference Guide focusing on the marine environments around the Town of View Royal, City of Colwood, and Township of Esquimalt.

Page 225–257

Portage Inlet Linear Park Beach Restoration
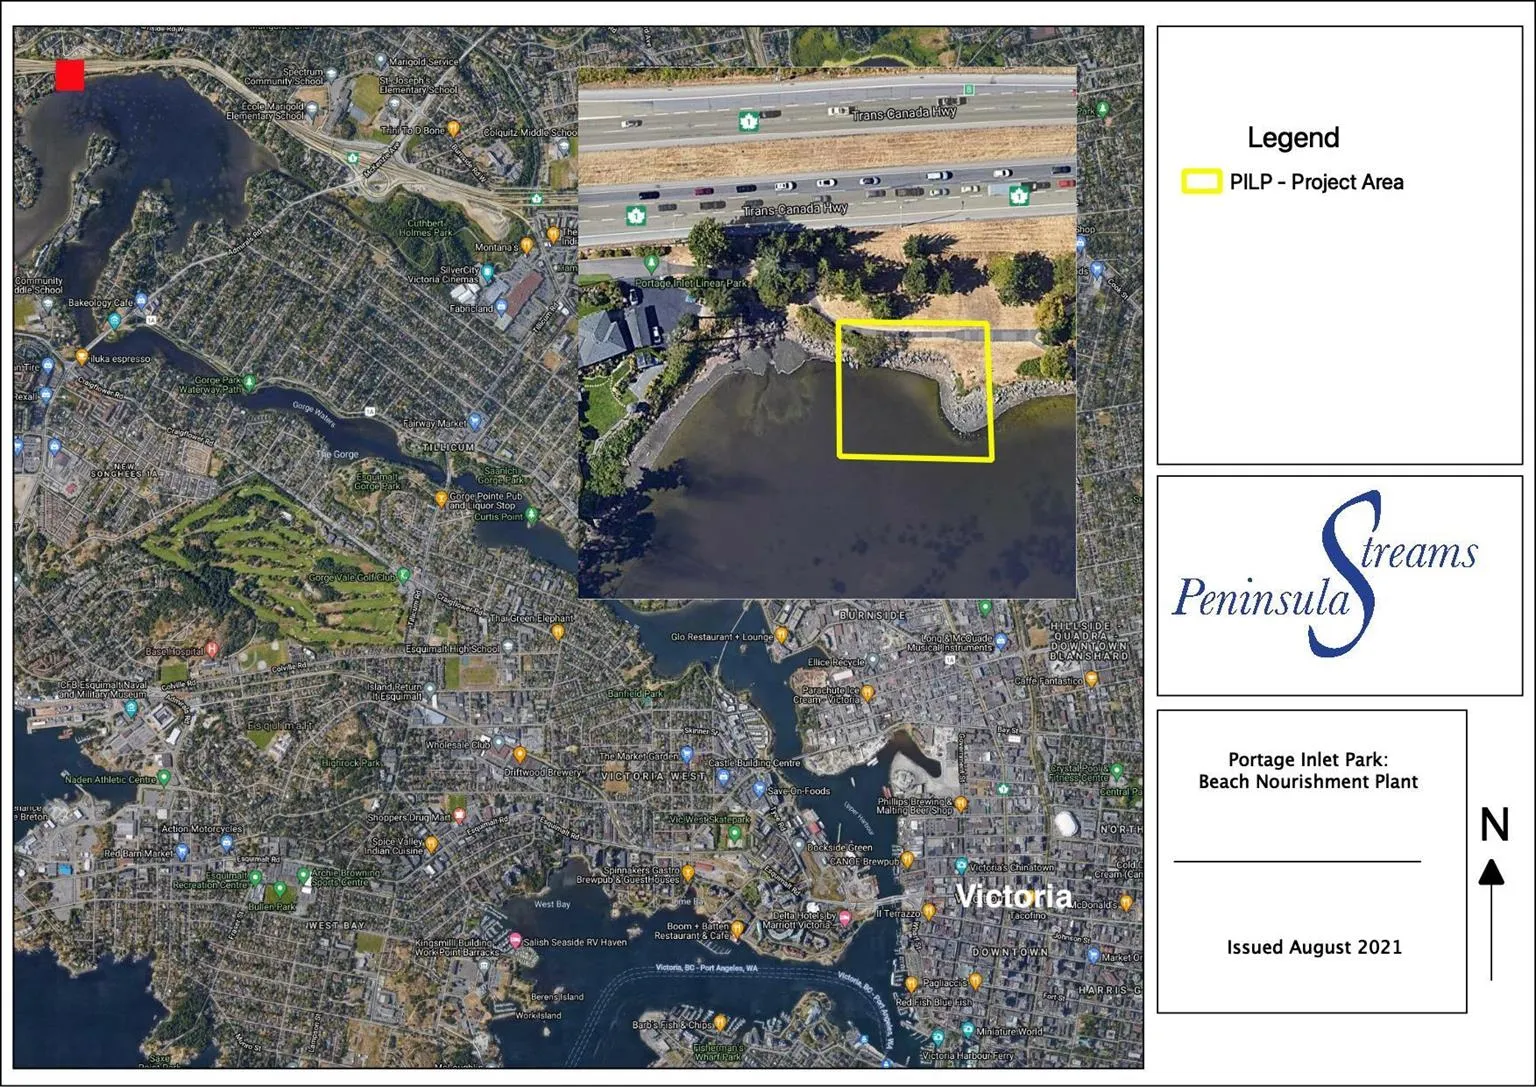
Aerial overview map identifying the Portage Inlet Park beach nourishment project area (PILP) near the Trans-Canada Highway.

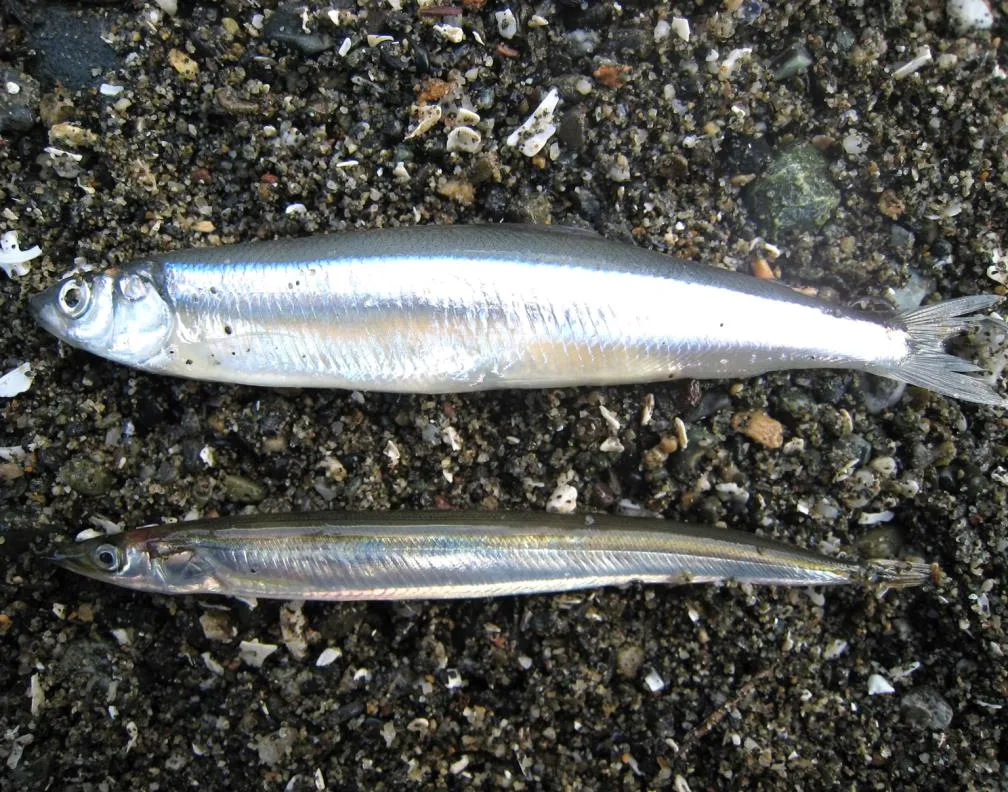
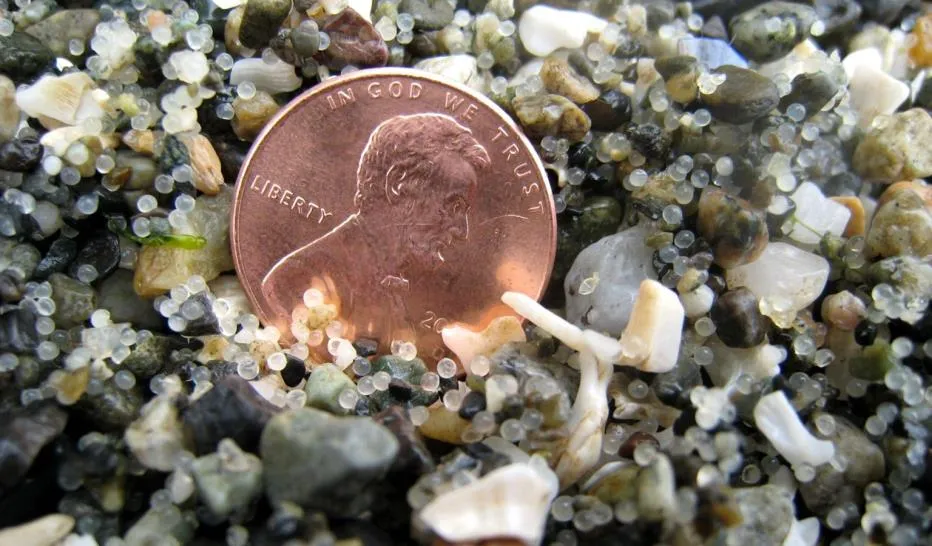
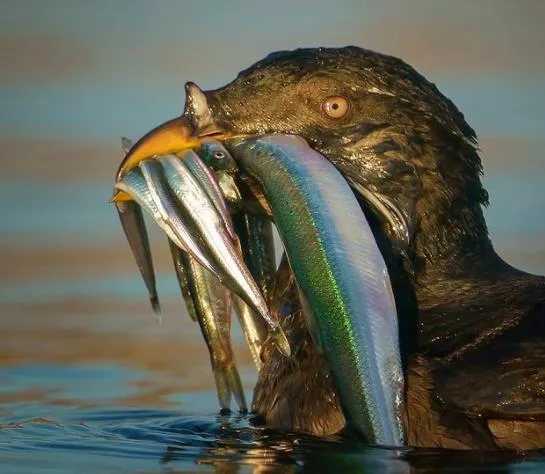
Forage Fish and the Marine Food Web
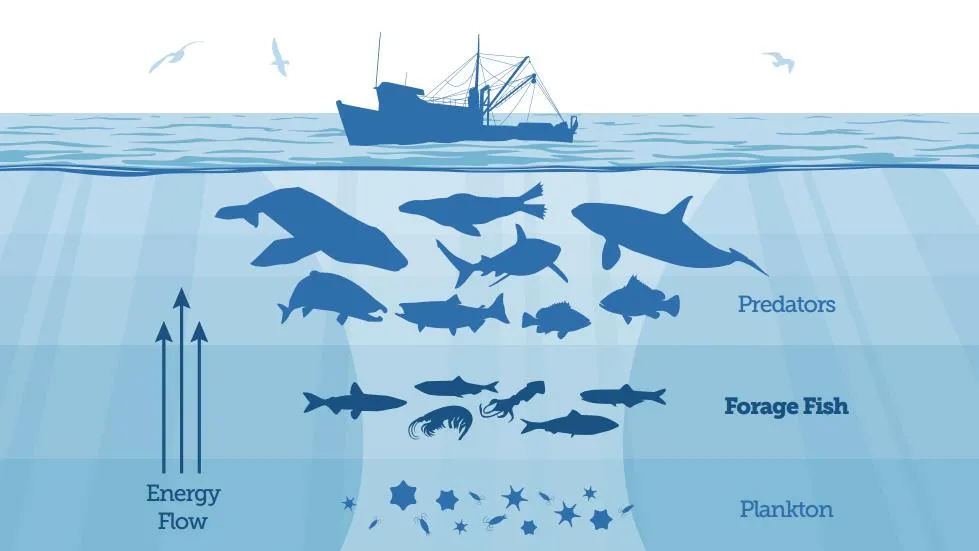
Photo of two silver forage fish (likely sand lance or surf smelt) on beach gravel.
Close-up photo of small, translucent forage fish eggs on sandy substrate, shown next to a penny for scale.
Diagram illustrating the marine food web, showing the upward energy flow from plankton through forage fish to top predators like whales, seals, and larger fish.
Photo of a bird with several small forage fish held in its beak.

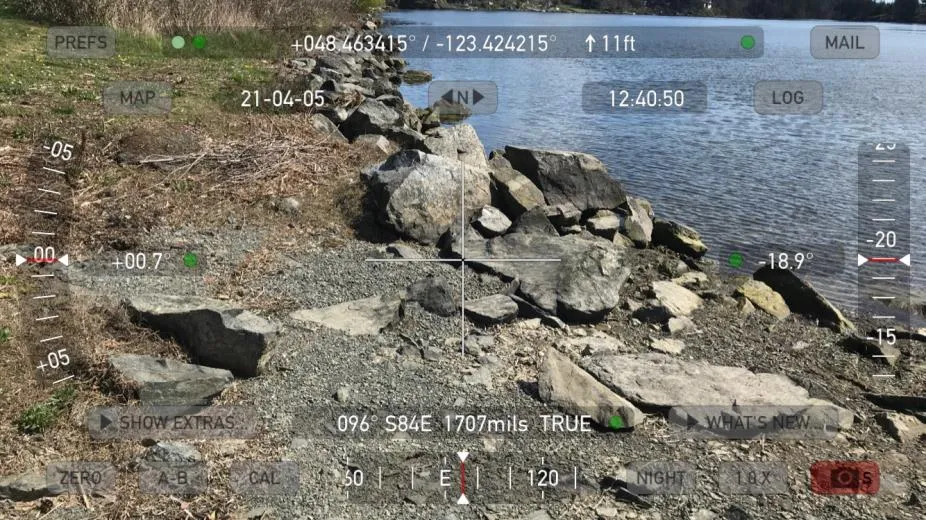
Existing Shoreline Conditions

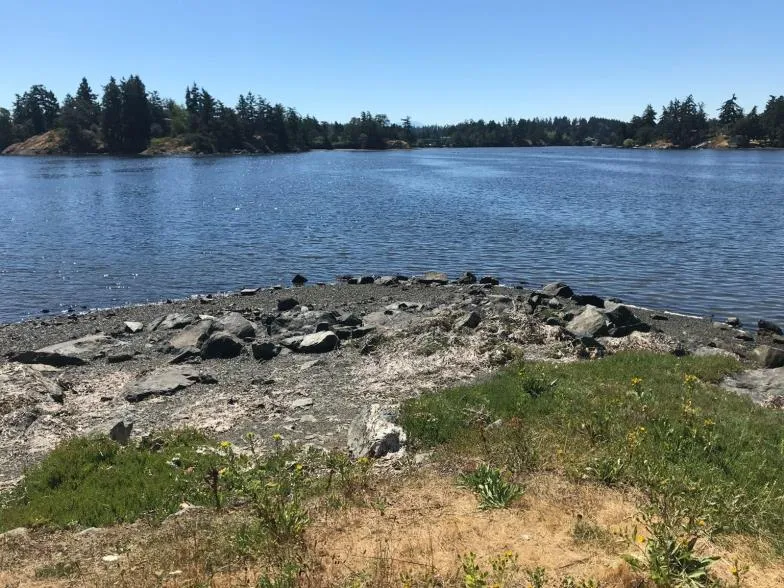
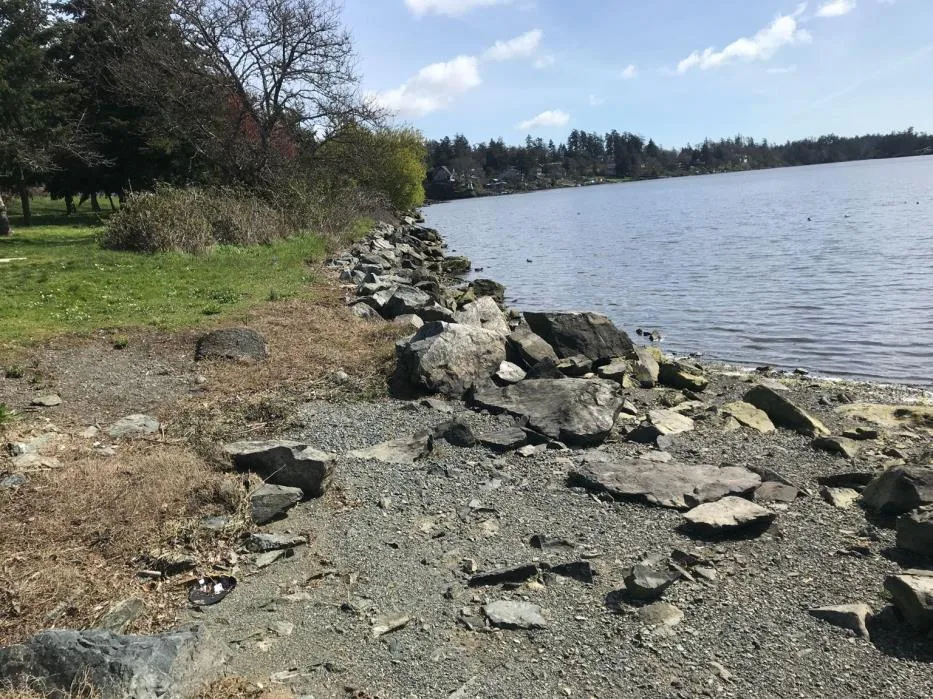
Shoreline photo showing a bank of large, unorganized boulders and loose gravel at the project site.
Another view of the rocky shoreline area prior to restoration work.
Photo of the shoreline with a camera interface overlay showing GPS coordinates (+048.463415 / -123.424215), the date (21-04-05), and an elevation of 11ft.

Restoration Design

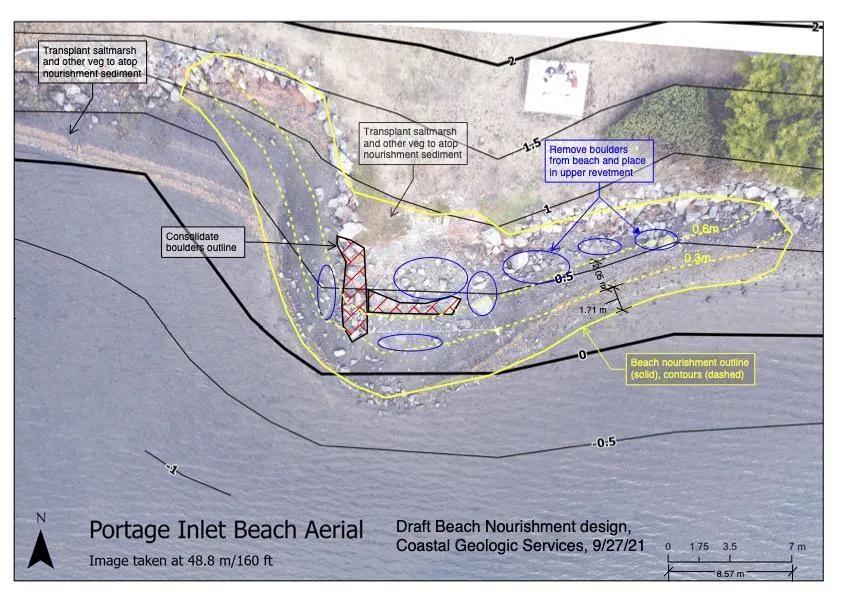
Draft Beach Nourishment design diagram for Portage Inlet Beach by Coastal Geologic Services, dated 9/27/21. The plan details the consolidation of boulders into an upper revetment and the placement of beach nourishment sediment.

Implementation and Planting

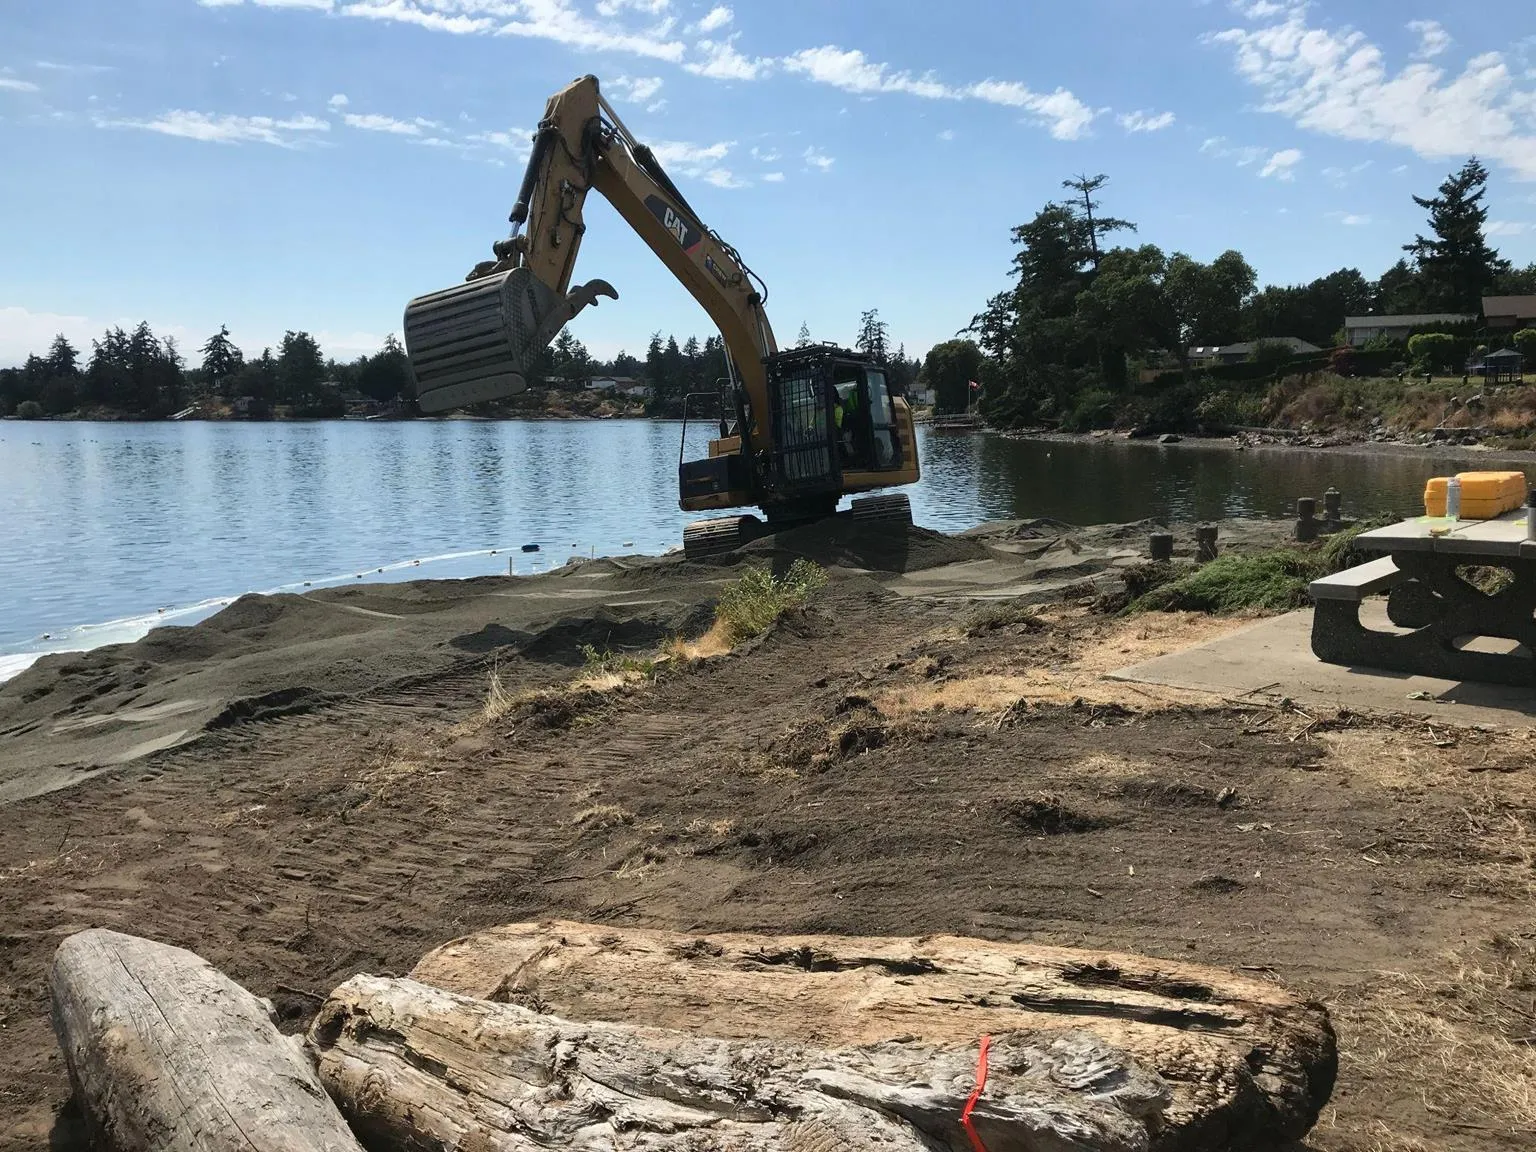
An excavator performing beach nourishment work on the Portage Inlet shoreline.
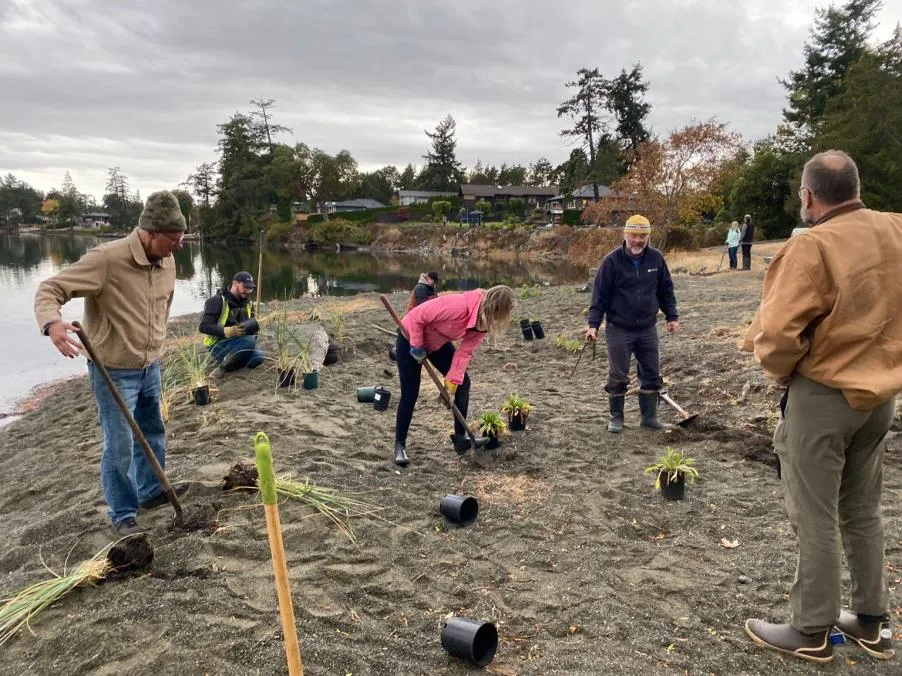
A group of volunteers planting grasses and other native vegetation into the newly placed beach sediment.

Restored Beach

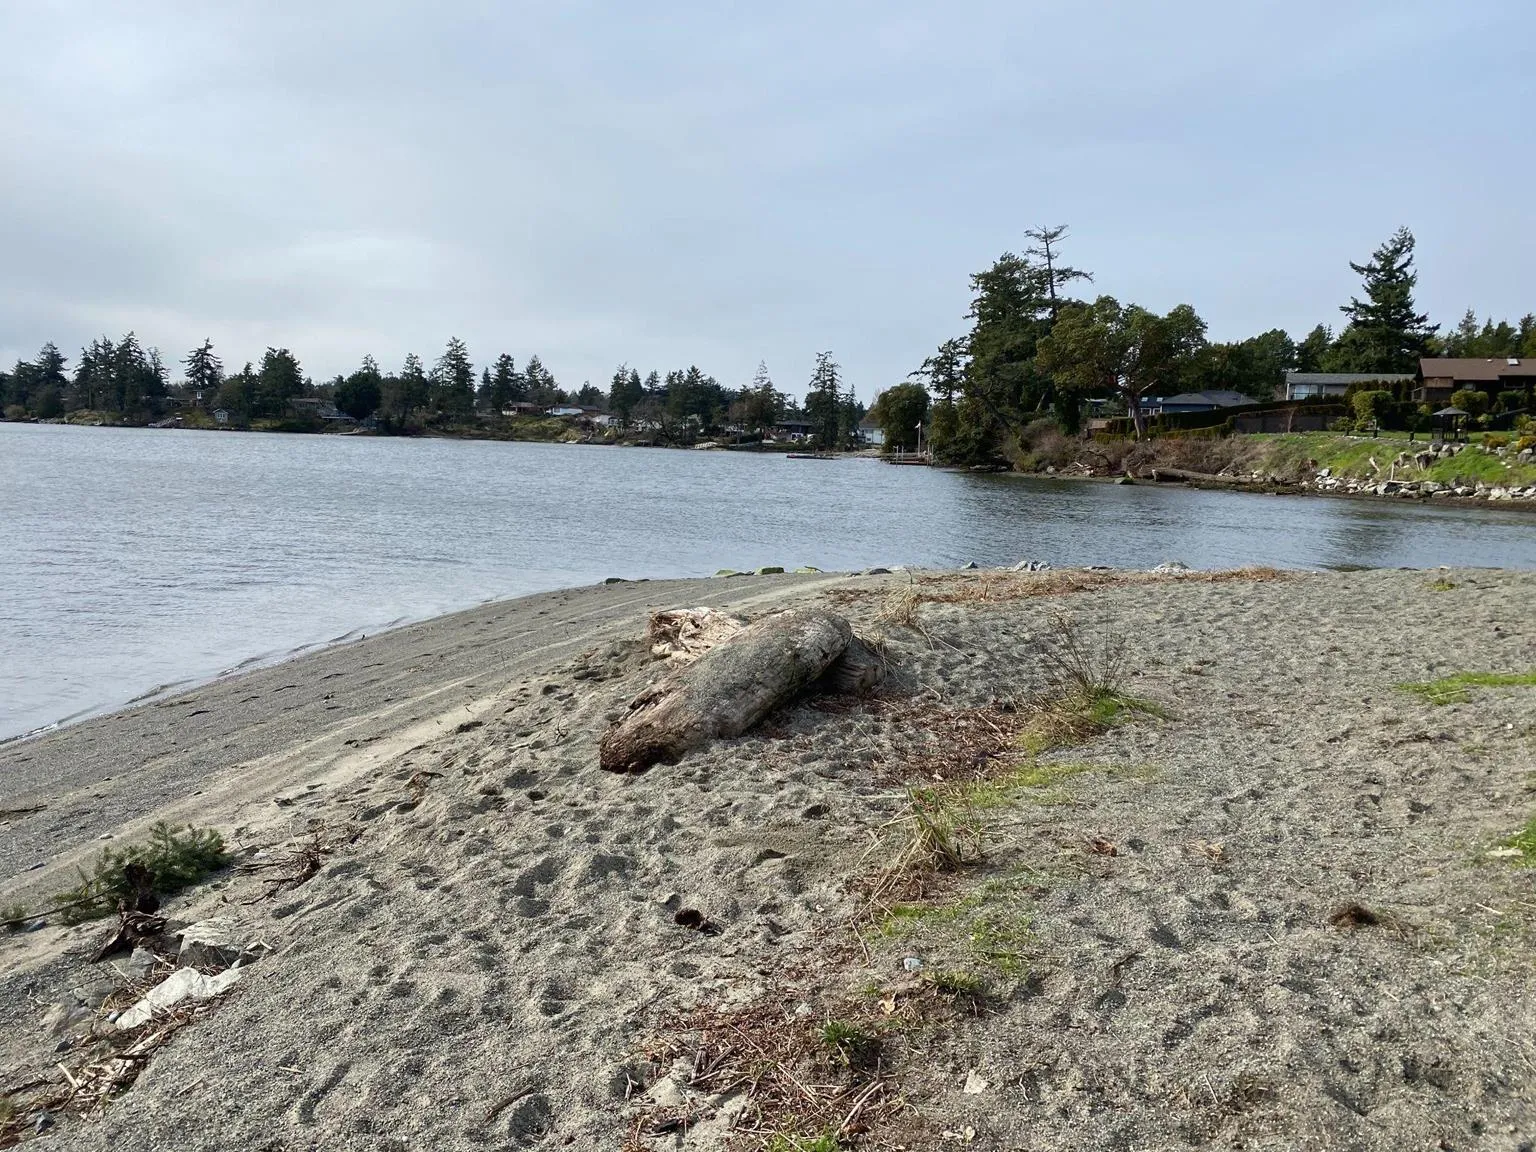
View of the completed beach restoration featuring a regraded shoreline with nourishment sediment and large driftwood logs.
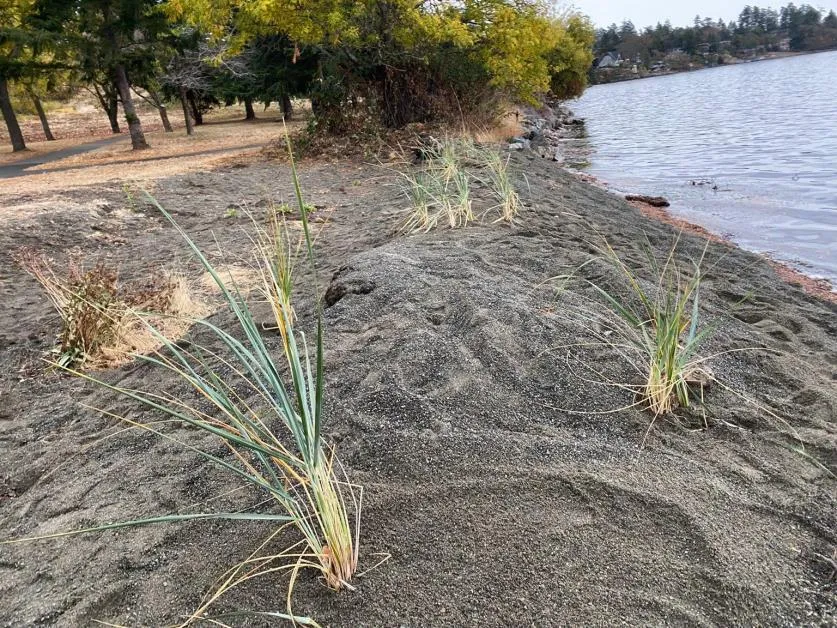
Close-up photo of native beach grass (Leymus mollis) beginning to establish in the new beach sediment.

Page 225–257

Hospital Creek Marsh Restoration
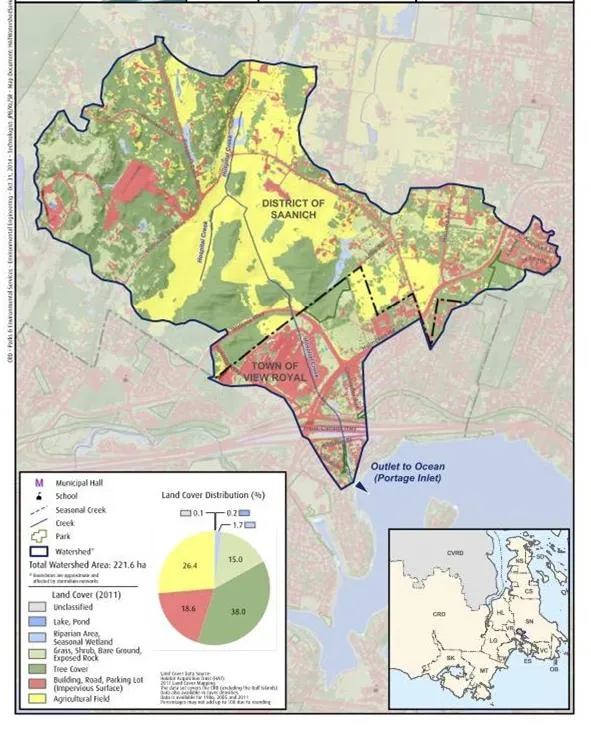
Map of the Hospital Creek watershed with an inset chart showing Land Cover Distribution (2011): 38.0% Tree Cover, 26.4% Riparian Area/Wetland/Exposed Rock, 18.6% Building/Road/Parking Lot, and 15.0% Agricultural Field.

Marsh Degradation

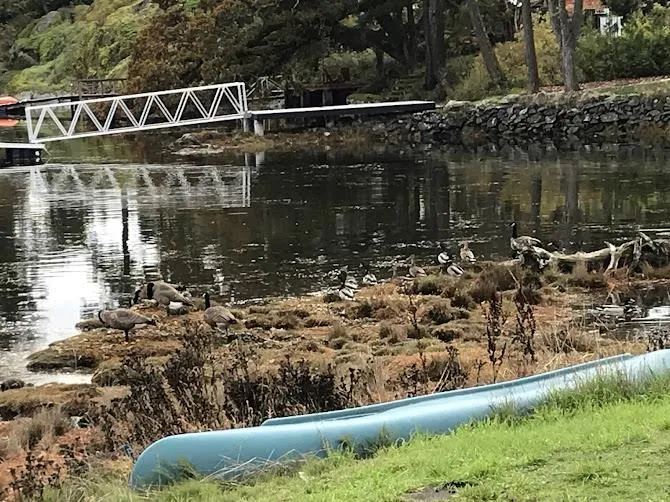
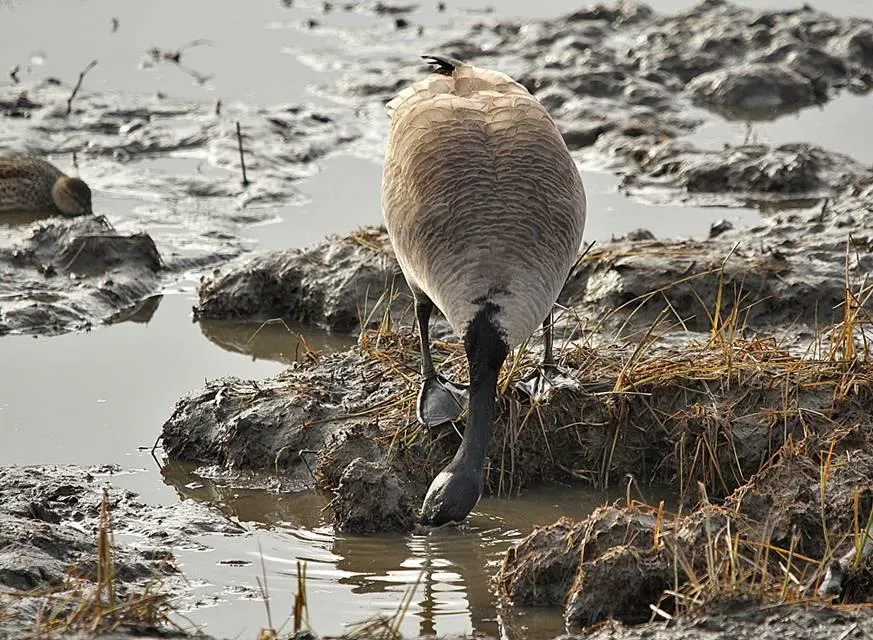
Photo of Canada Geese grazing on a severely degraded intertidal marsh area near a residential dock.
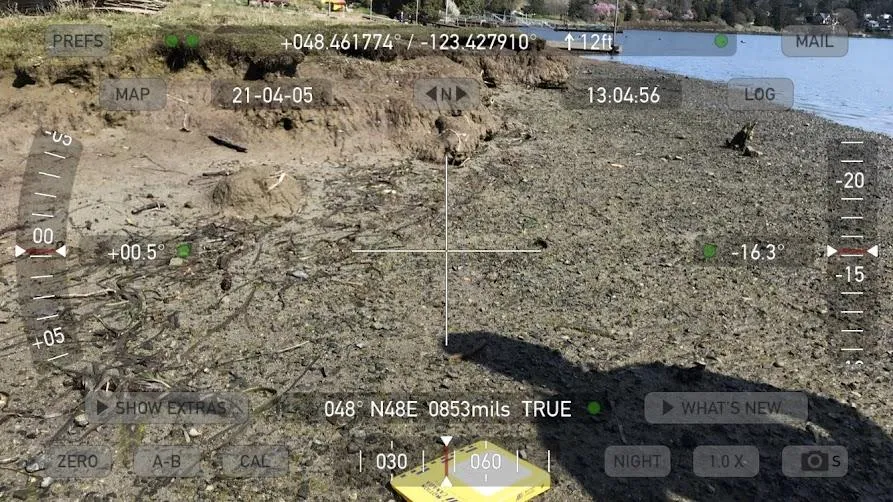
Photo of a muddy, sparsely vegetated intertidal area with a camera overlay showing coordinates (+048.461774 / -123.427910), the date (21-04-05), and an elevation of 12ft.
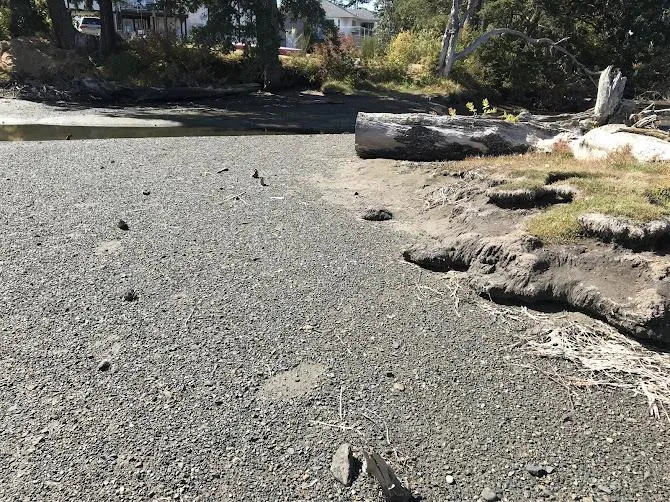
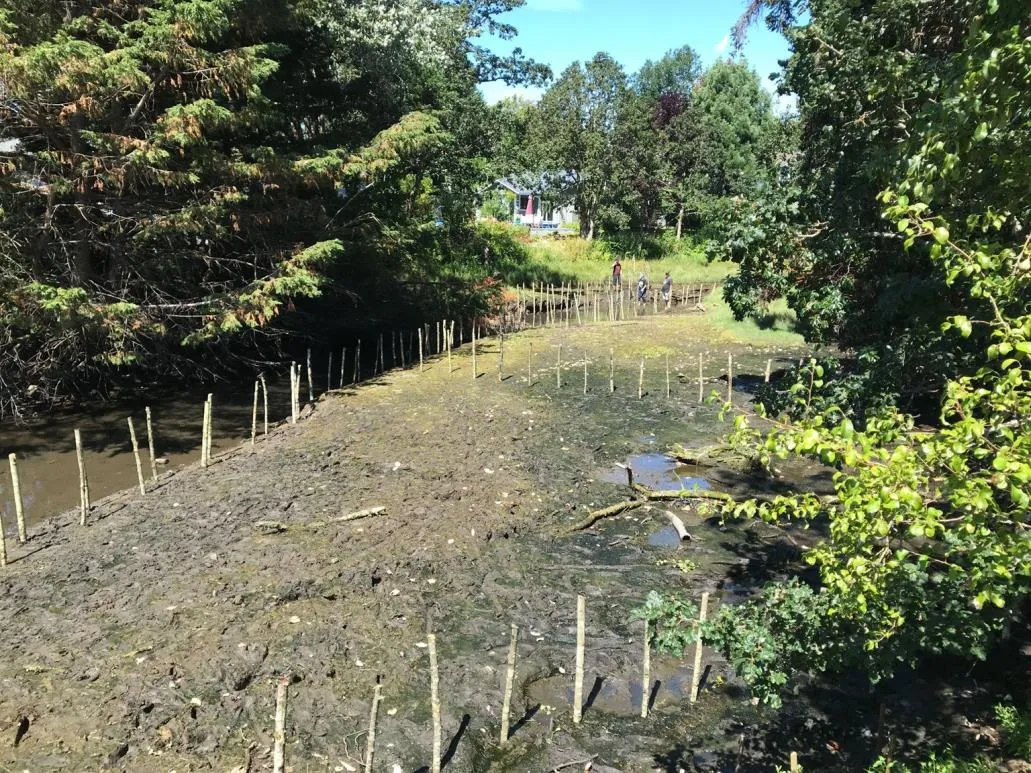
Ground-level view of an exposed mudflat area with scattered logs and minimal marsh vegetation.

Impact of Canada Geese

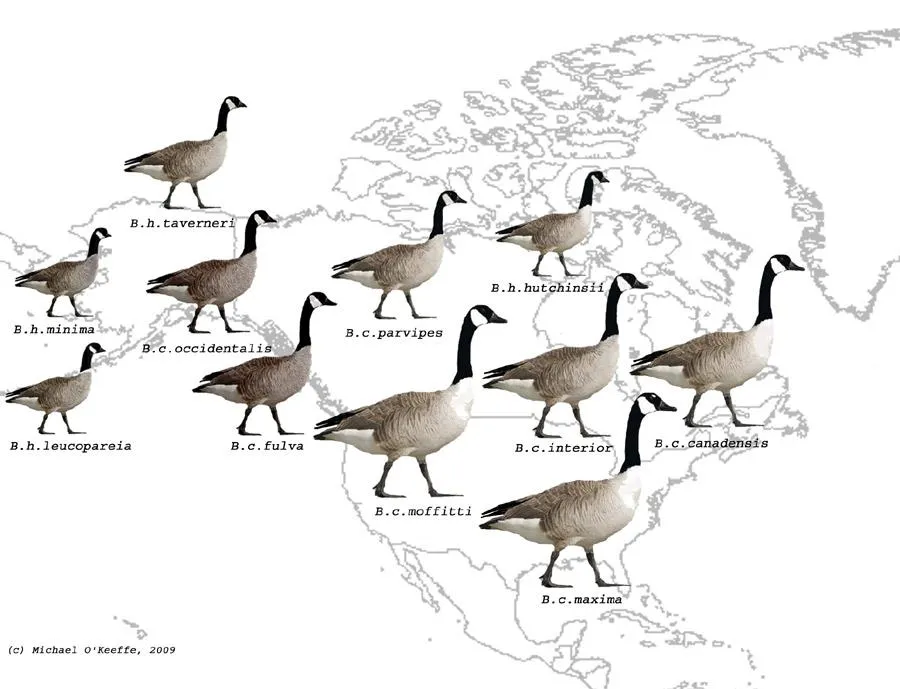
Illustration showing various subspecies of Canada Geese across North America, including *B.c. moffitti* and *B.c. fulva* highlighted in the Pacific Northwest.

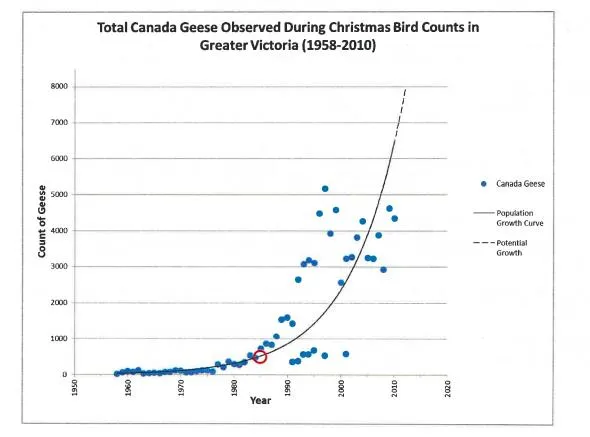
CRD Regional Mngmt Strategy 2012

Graph showing the exponential increase in Canada Geese populations in Greater Victoria based on Christmas Bird Counts from 1958 to 2010.
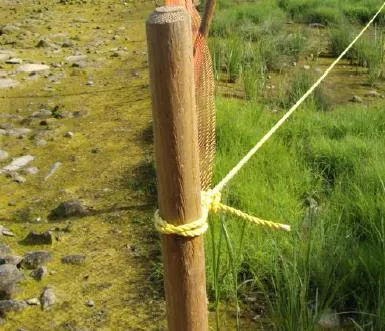
Close-up photo of a protective fence post and mesh used to exclude geese from sensitive restoration areas.

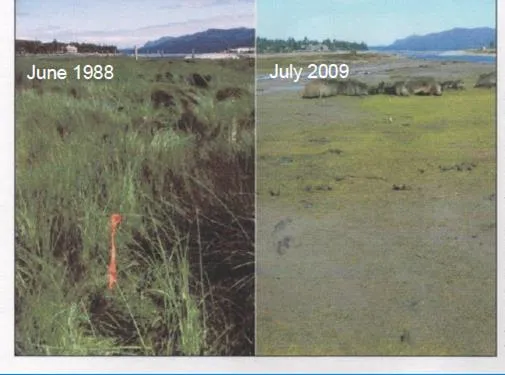
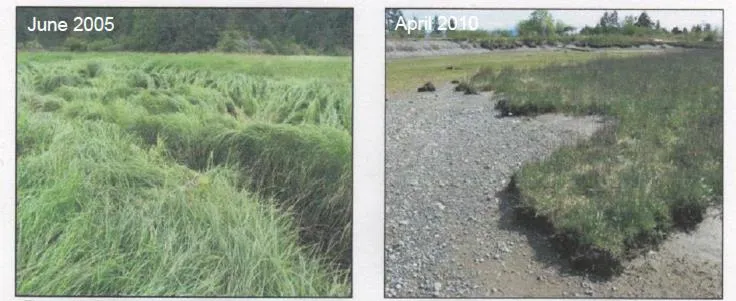
Historical Marsh Decline

Side-by-side comparison photos showing a lush marsh in June 1988 versus a barren mudflat in July 2009.
Side-by-side comparison photos showing thick marsh vegetation in June 2005 versus significantly reduced cover in April 2010.

Monitoring and Recovery

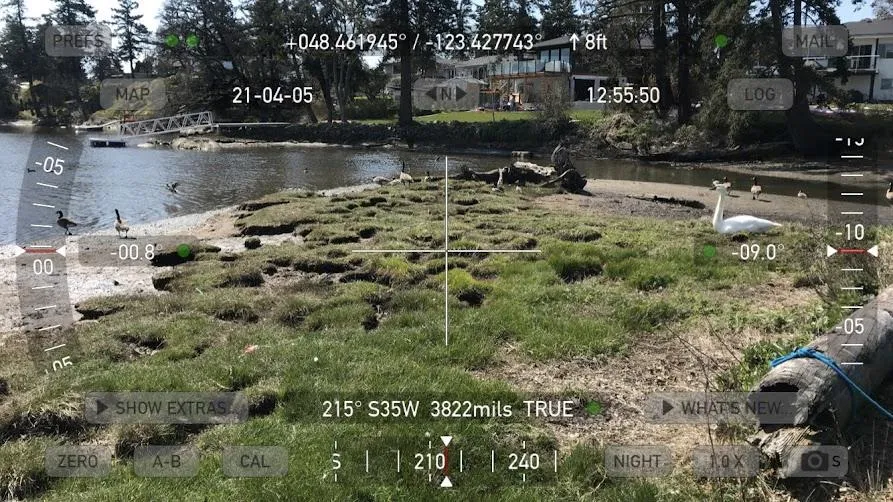
Wide-angle photo of a marsh restoration area with camera interface showing coordinates (+048.461945 / -123.427743), the date (21-04-05), and an elevation of 8ft.
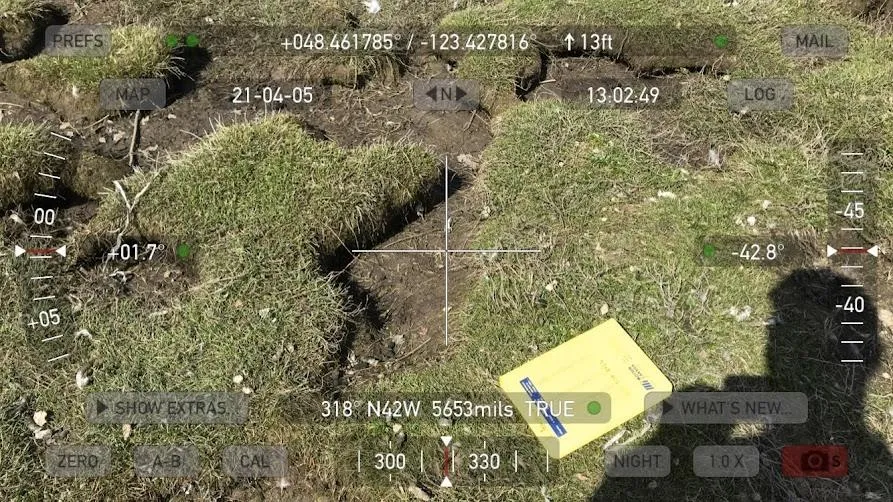
Close-up photo of struggling marsh vegetation "islands" with camera interface showing coordinates (+048.461785 / -123.427816) and an elevation of 13ft.
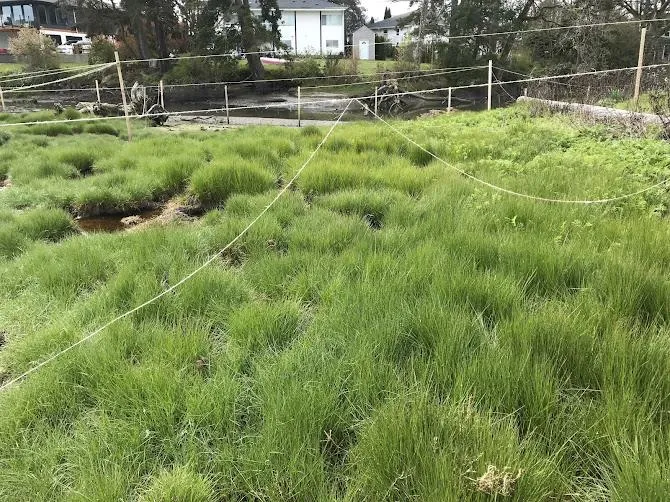
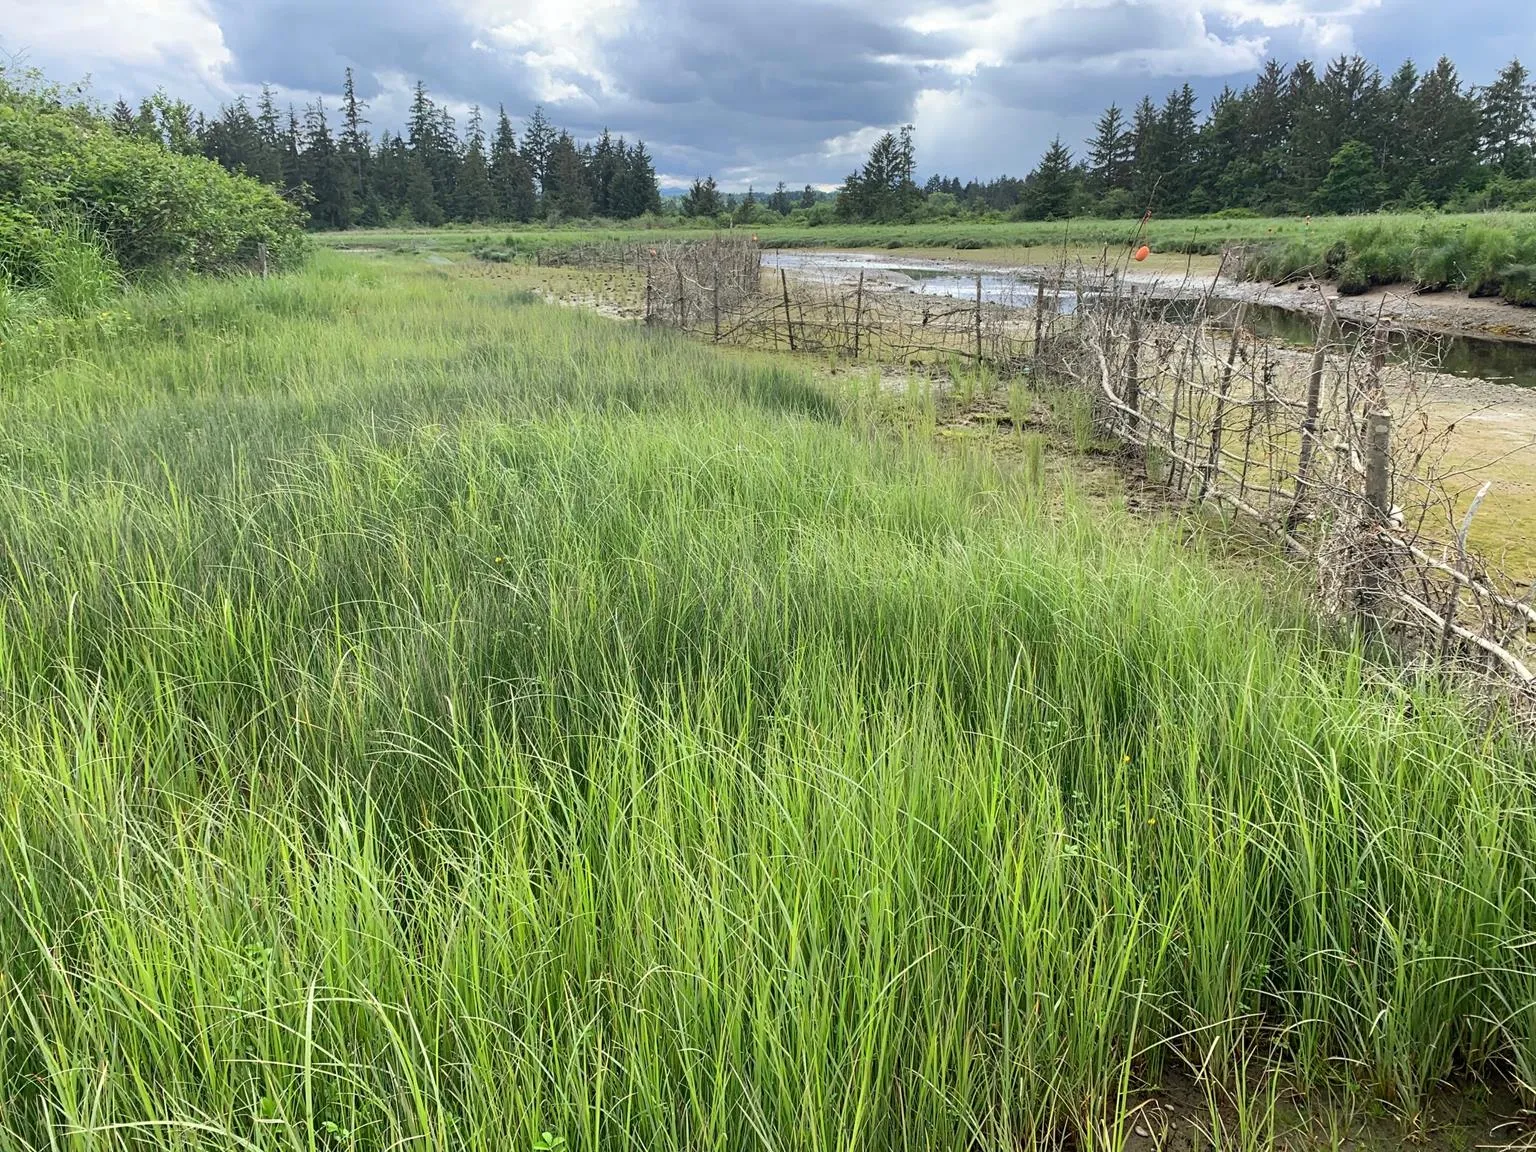
Photo showing lush, healthy marsh grass recovery within a fenced protection zone.
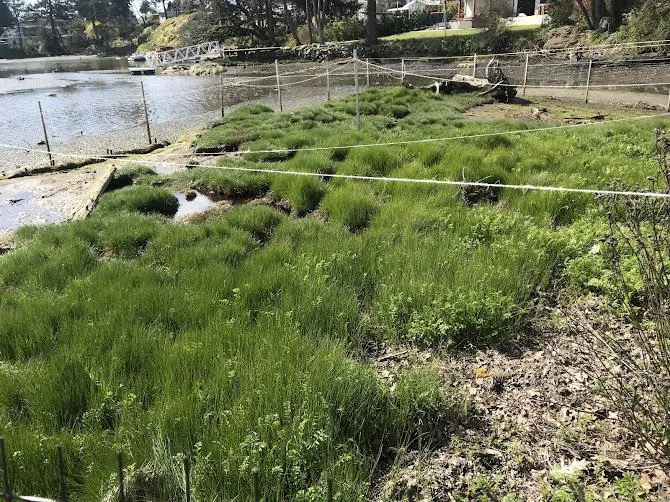
Another view of thriving marsh vegetation successfully protected from grazing.

Fencing and Restoration Work

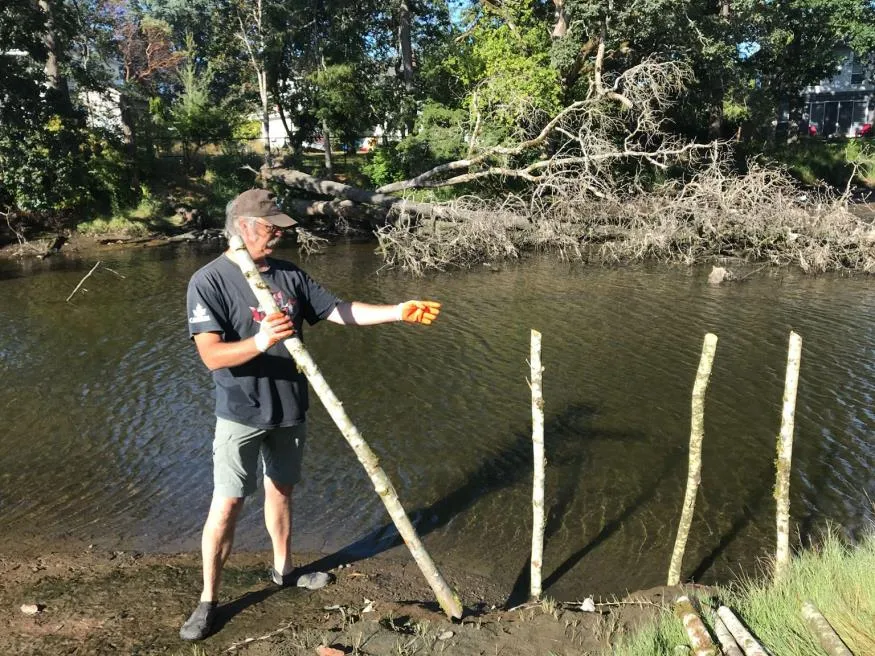
A person holding a long wooden stake to be used for constructing goose exclusion fencing.
A series of wooden stakes driven into the intertidal mud to support protective fencing.
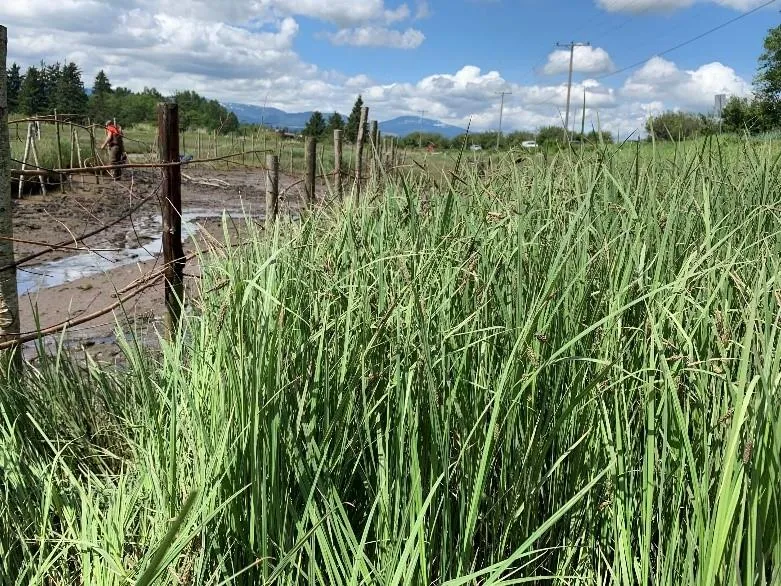
Wide view of a healthy, protected tidal marsh area behind a woven wood and rope fence.

Page 225–257

Mill Stream Watershed

Fish Array in Kelvin Grove Park
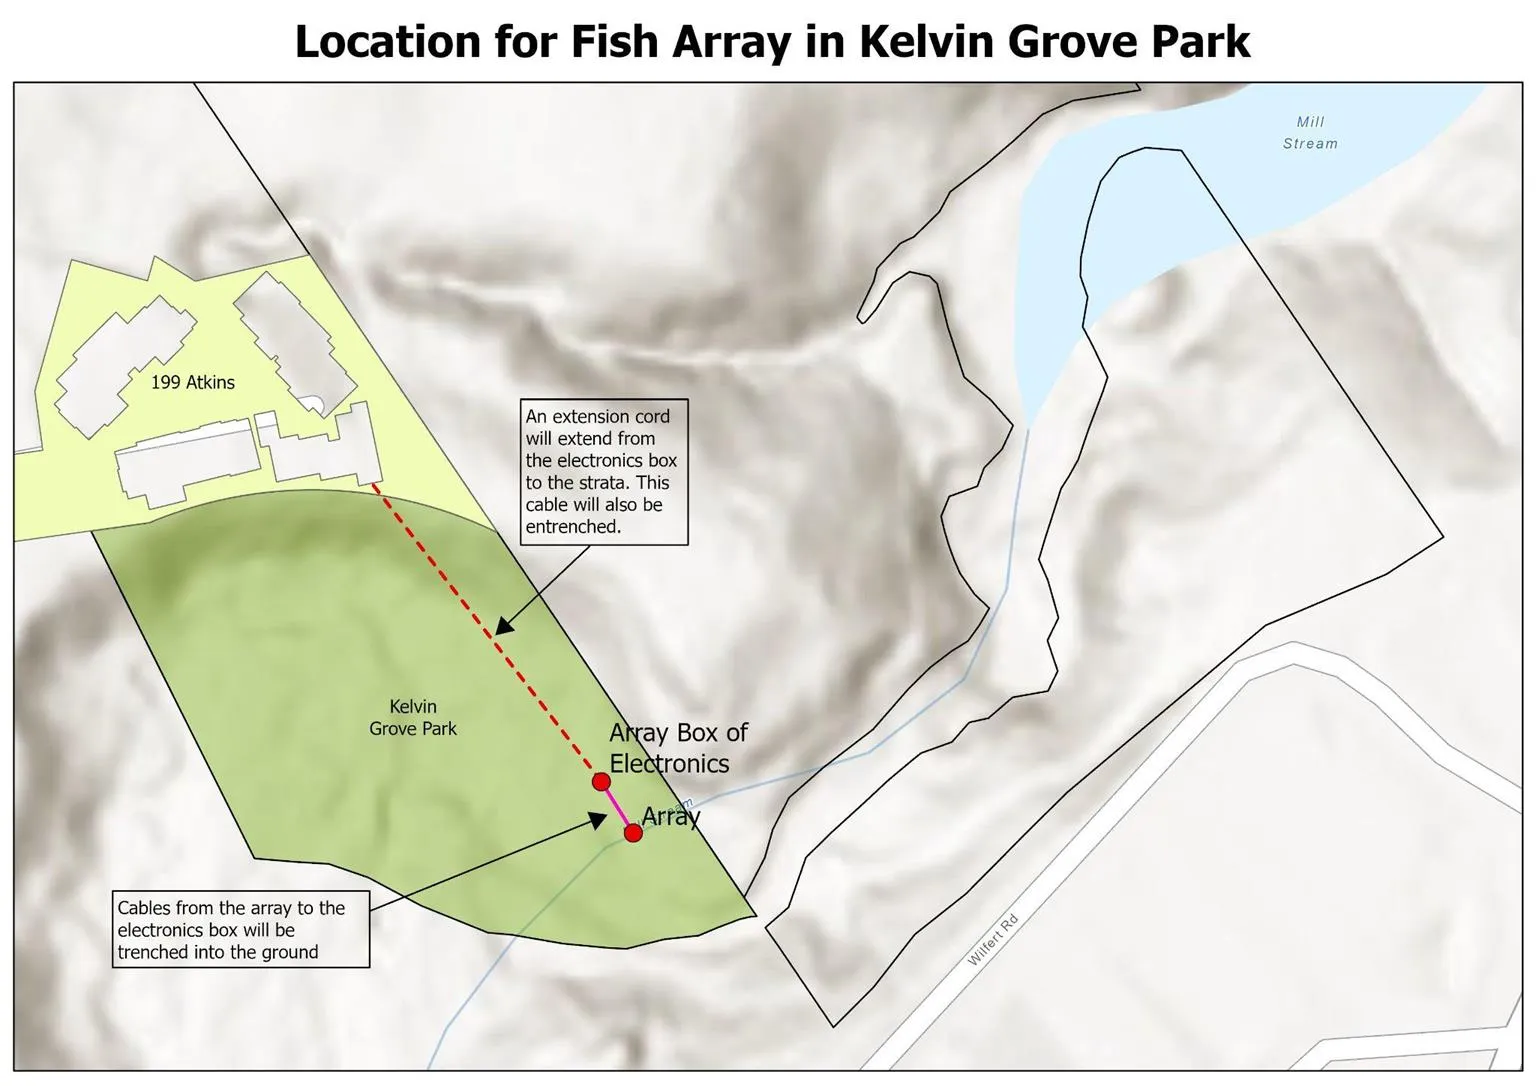
Technical map titled "Location for Fish Array in Kelvin Grove Park" showing the location of the electronics box at 199 Atkins and the cable route to the array in Mill Stream.
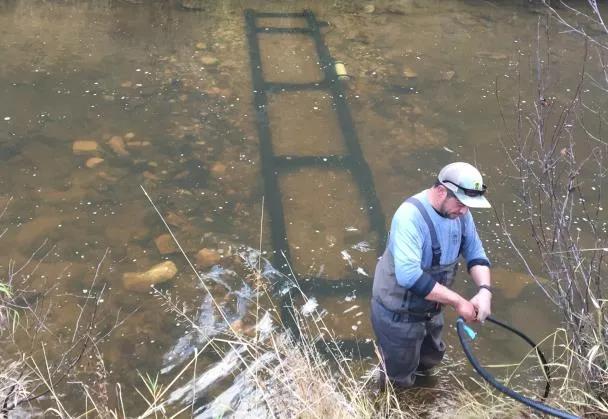
Photo of a PIT tag antenna array being installed on the stream bed by a person in waders.
  • The information collected from the array will help us to understand the migration patterns, timings and survivability of both coho and cutthroat.
  • Each PIT tag has a unique identification code associated with it that allows us to monitor fish at different life stages – as they migrate out through the freshwater, into the marine environment and then again as they return as adults.
  • We’ll use this information to piece together survival estimates at these different points. Salmon that reach the ocean safely and survive their years at sea return to the rivers as adults to spawn and contribute to recovery of threatened and endangered populations.

Coho Release Data - 2022
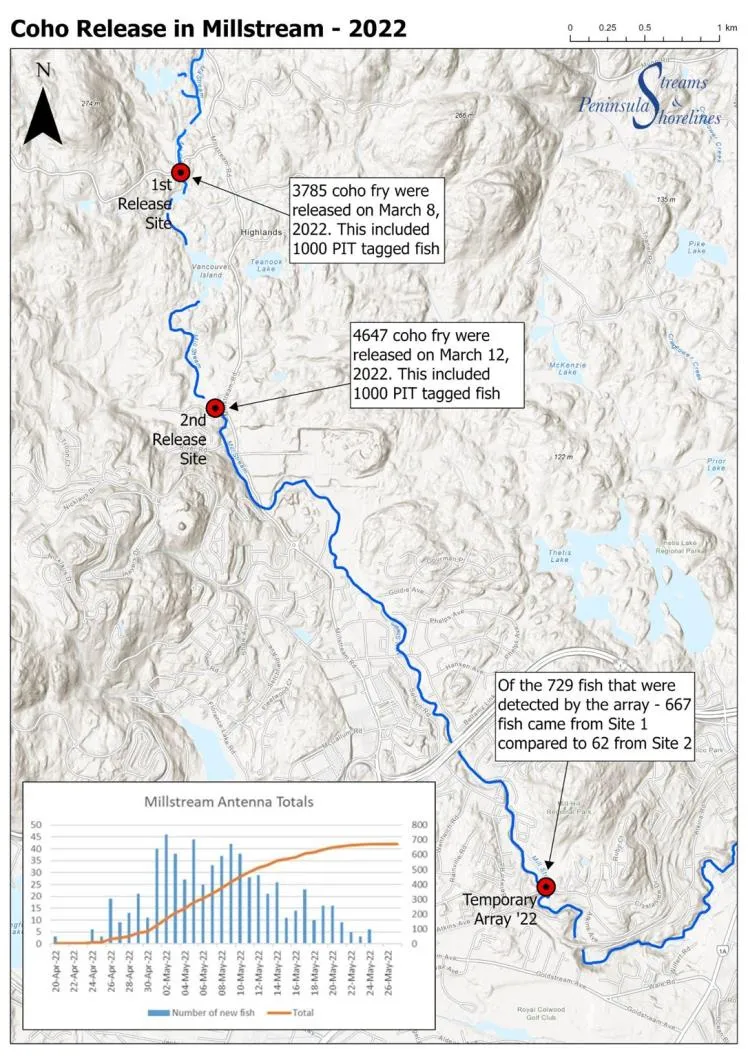
Map and chart titled "Coho Release in Millstream - 2022." On March 8, 3,785 fry were released at Site 1 (1,000 tagged), and on March 12, 4,647 fry were released at Site 2 (1,000 tagged). A bar chart shows daily detections at the temporary array from April to May 2022, totaling 729 fish detections (667 from Site 1 and 62 from Site 2).

Page 225–257

View Royal Park Tidal Marsh Restoration
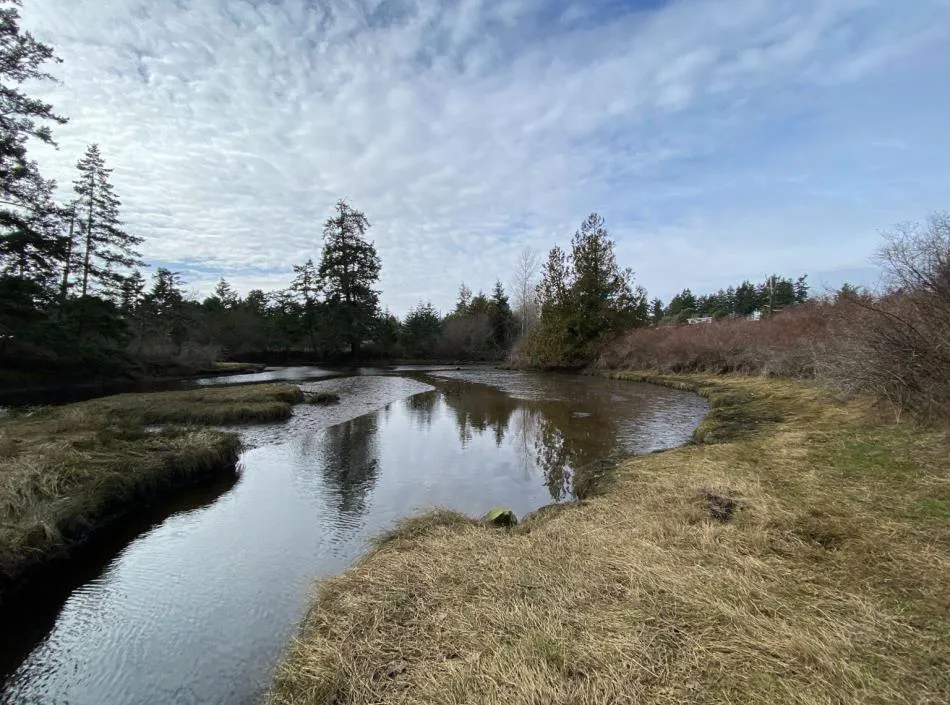
Scenic view of the tidal marsh area along Craigflower Creek in View Royal Park.
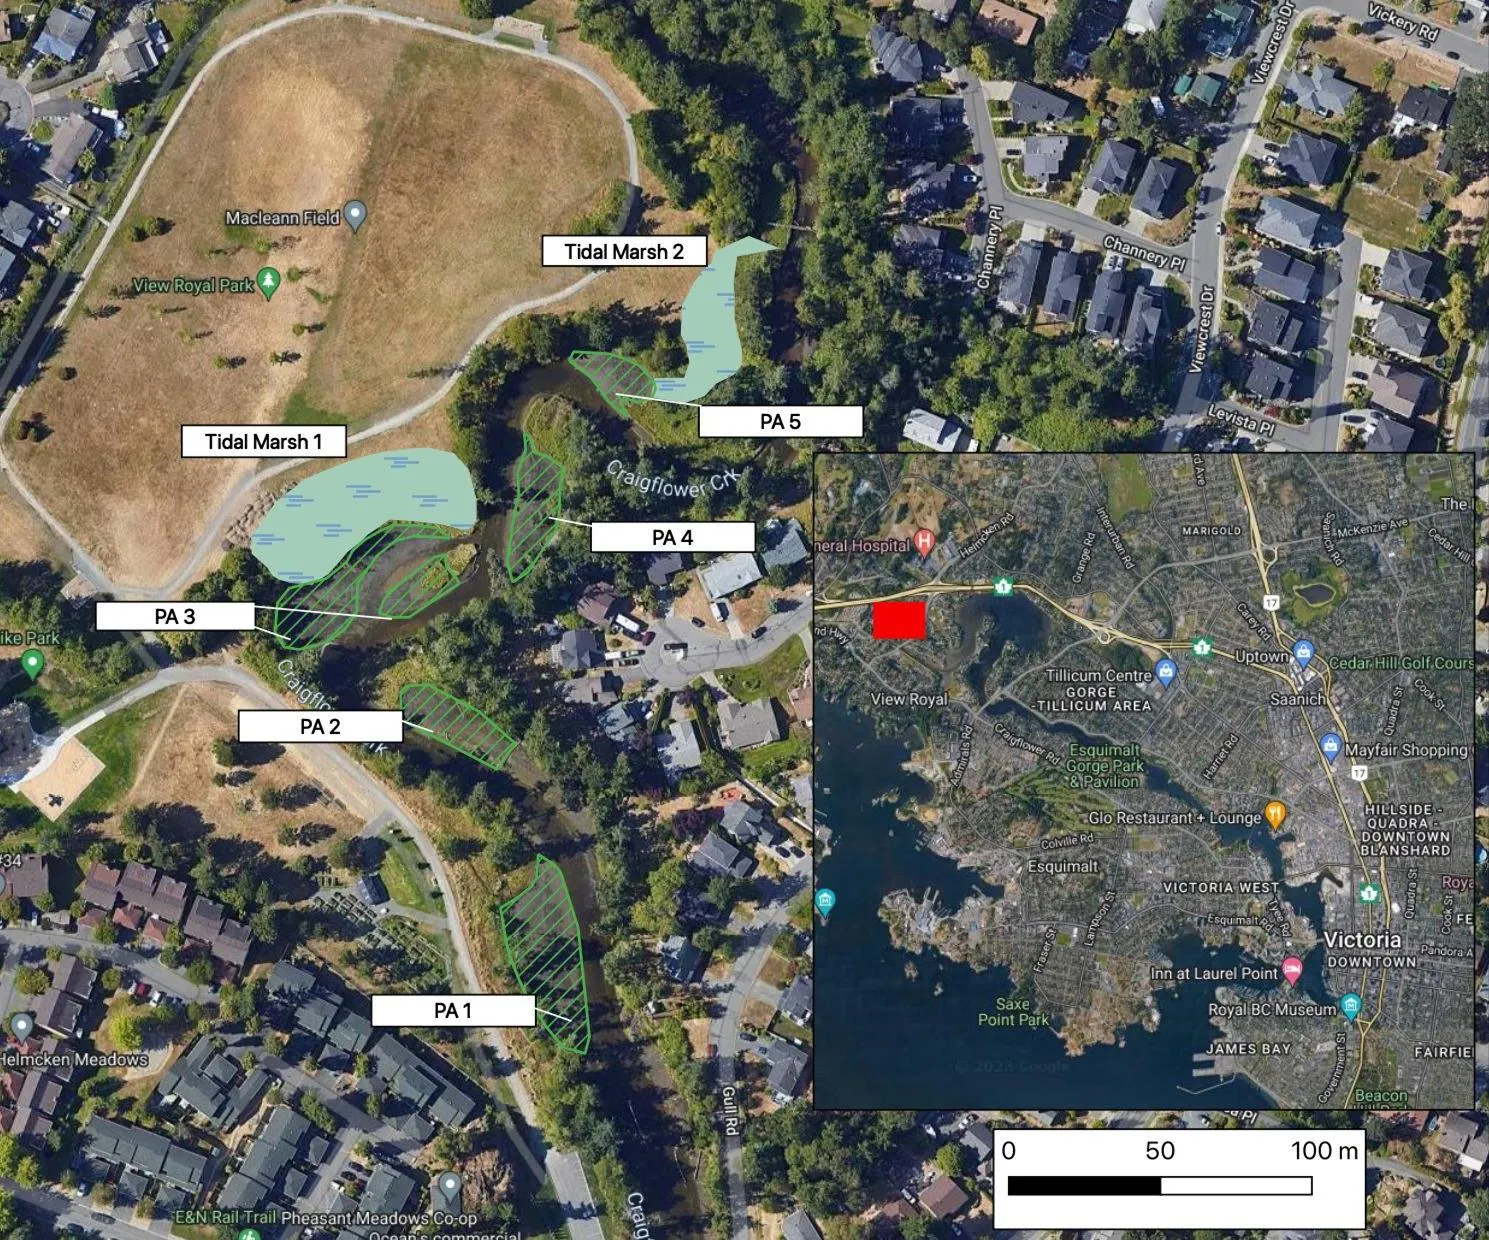
Aerial map of View Royal Park identifying five project areas (PA 1 through PA 5) along Craigflower Creek for tidal marsh restoration.
Photo of a Canada Goose feeding in the mud of a tidal marsh.
Comparison photo showing lush vegetation within a fenced area on the right and bare mud where geese have access on the left.
Aerial map showing tidal marsh restoration project areas along Craigflower Creek.
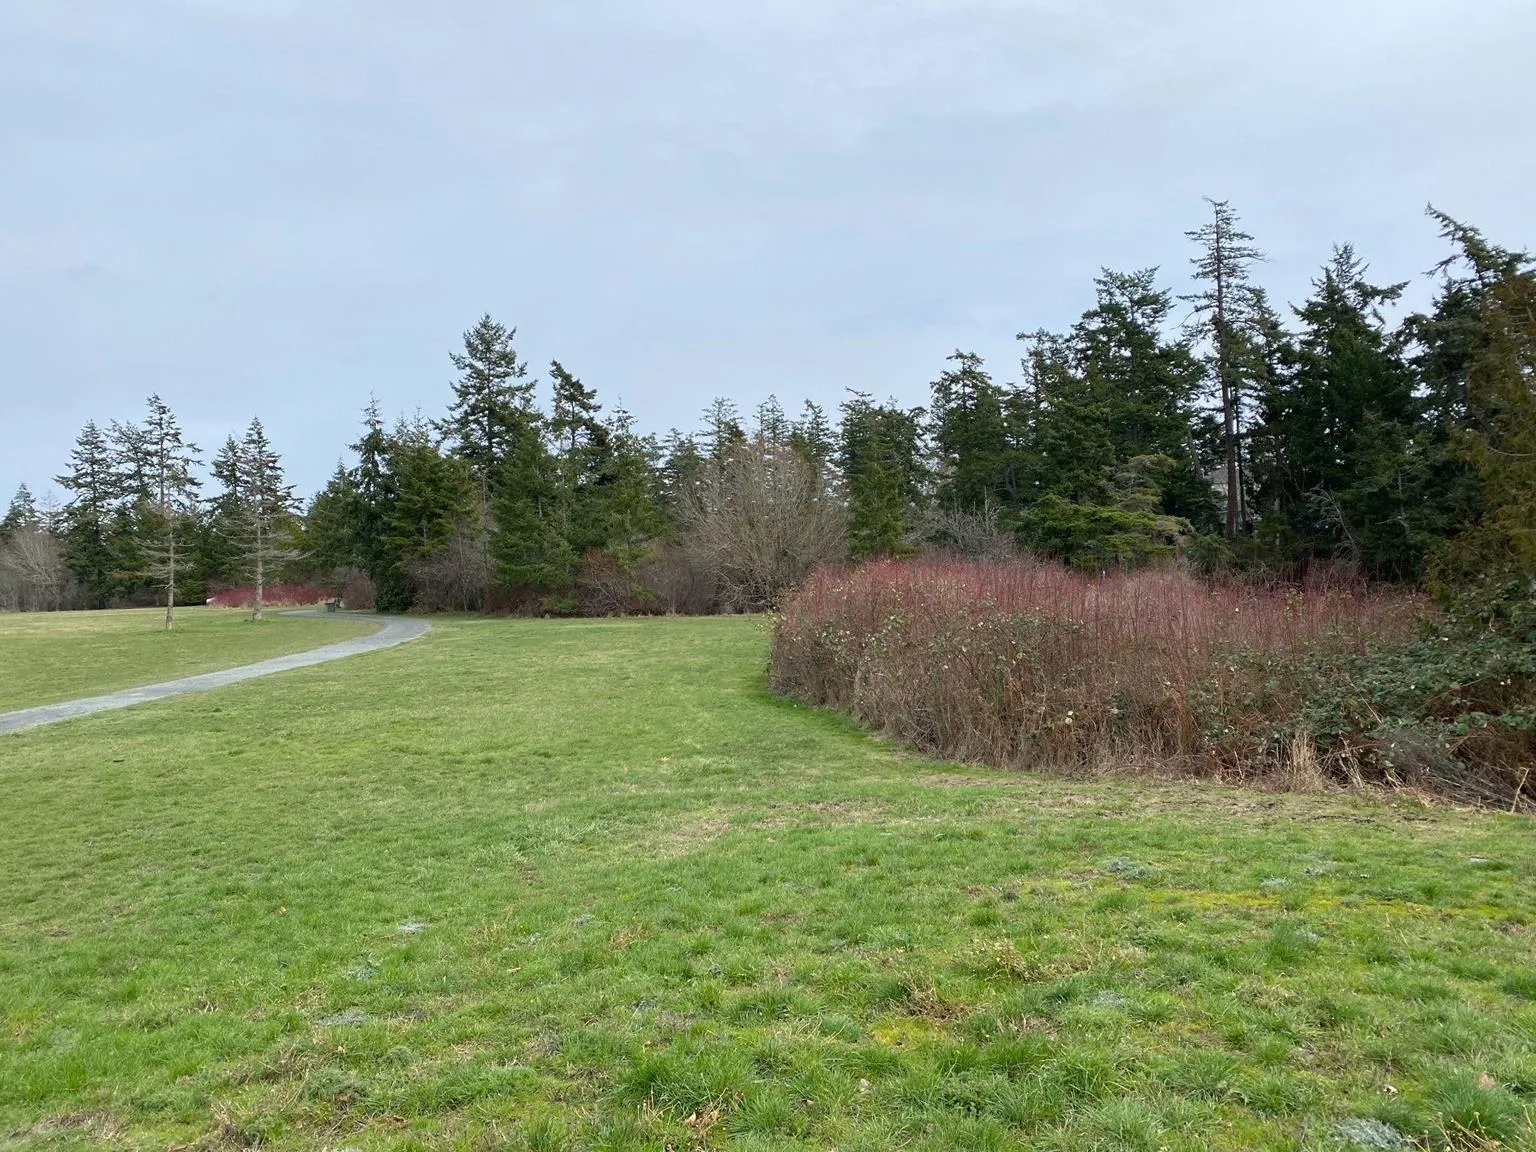
Photo of an open grassy field and walking path in View Royal Park.
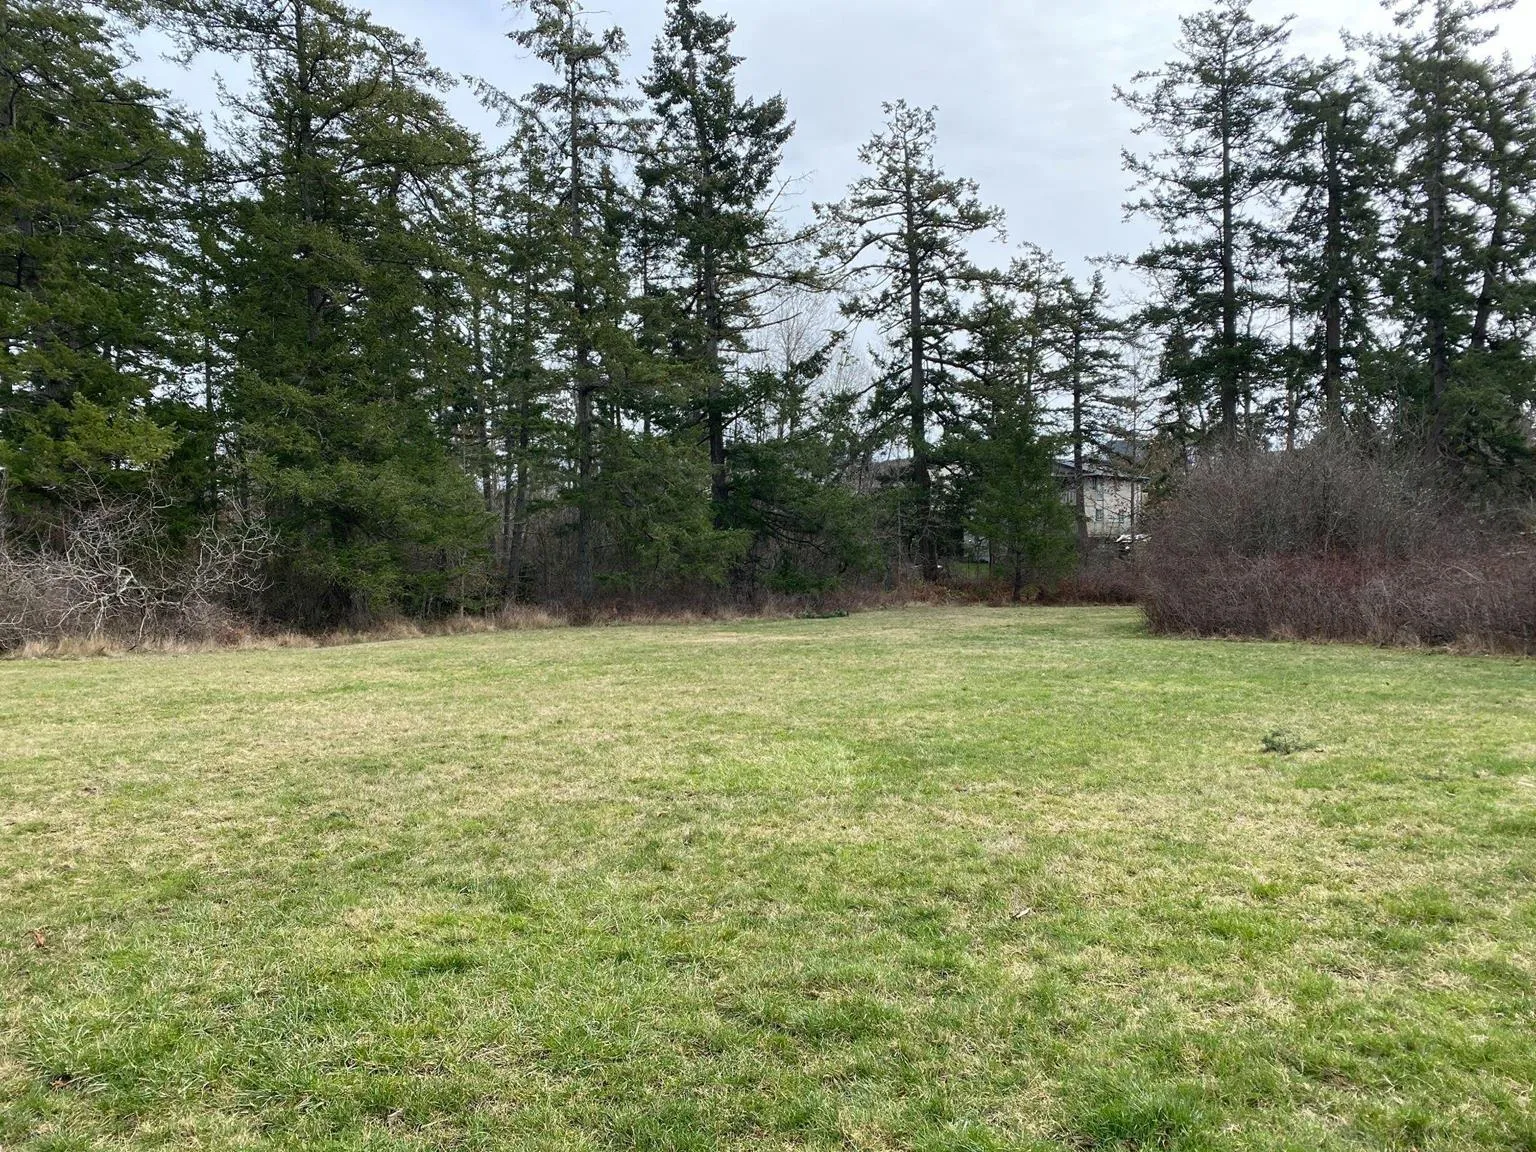
Photo of a grassy upland area in View Royal Park bordered by coniferous trees.
Page 225–257

Document Images

(1)
Document image
Extracted from: 2023 03 14 Committee of the Whole Agenda - Agenda - Pdf