Capital Bike Municipal Sponsor Report - Everyone Rides Grades 4 and 5 2022
Year-end report detailing the results and benefits of the Everyone Rides program in View Royal schools during 2022.
Municipal Sponsor Report
Everyone Rides Grades 4 and 5 2022
Overview
In September 2022 we were pleased to return to View Royal Elementary to deliver our “Everyone Rides Grades 4 and 5” program, having last visited during our first season running the program in fall 2020. Our goal of delivering a second program, reaching an entirely new cohort of grade 4 and 5 students, was made possible in-part by matching funds from the Town of View Royal. An overview of the program is included in this report.
Over the two-day Everyone Rides Grades 4 and 5 (ERG45) course, we instructed the school’s 97 students in grades 4 and 5 in basic bike mechanics, traffic safety, rules of the road, and bike handling skills. On our day 1 “in-class” session on September 26, we taught the five classes about helmet fit, how to make sure their bikes are safe to ride, safety tips, and principles of traffic safety. These sessions are 50–60 minutes long and provide a foundation for the on-bike portion.
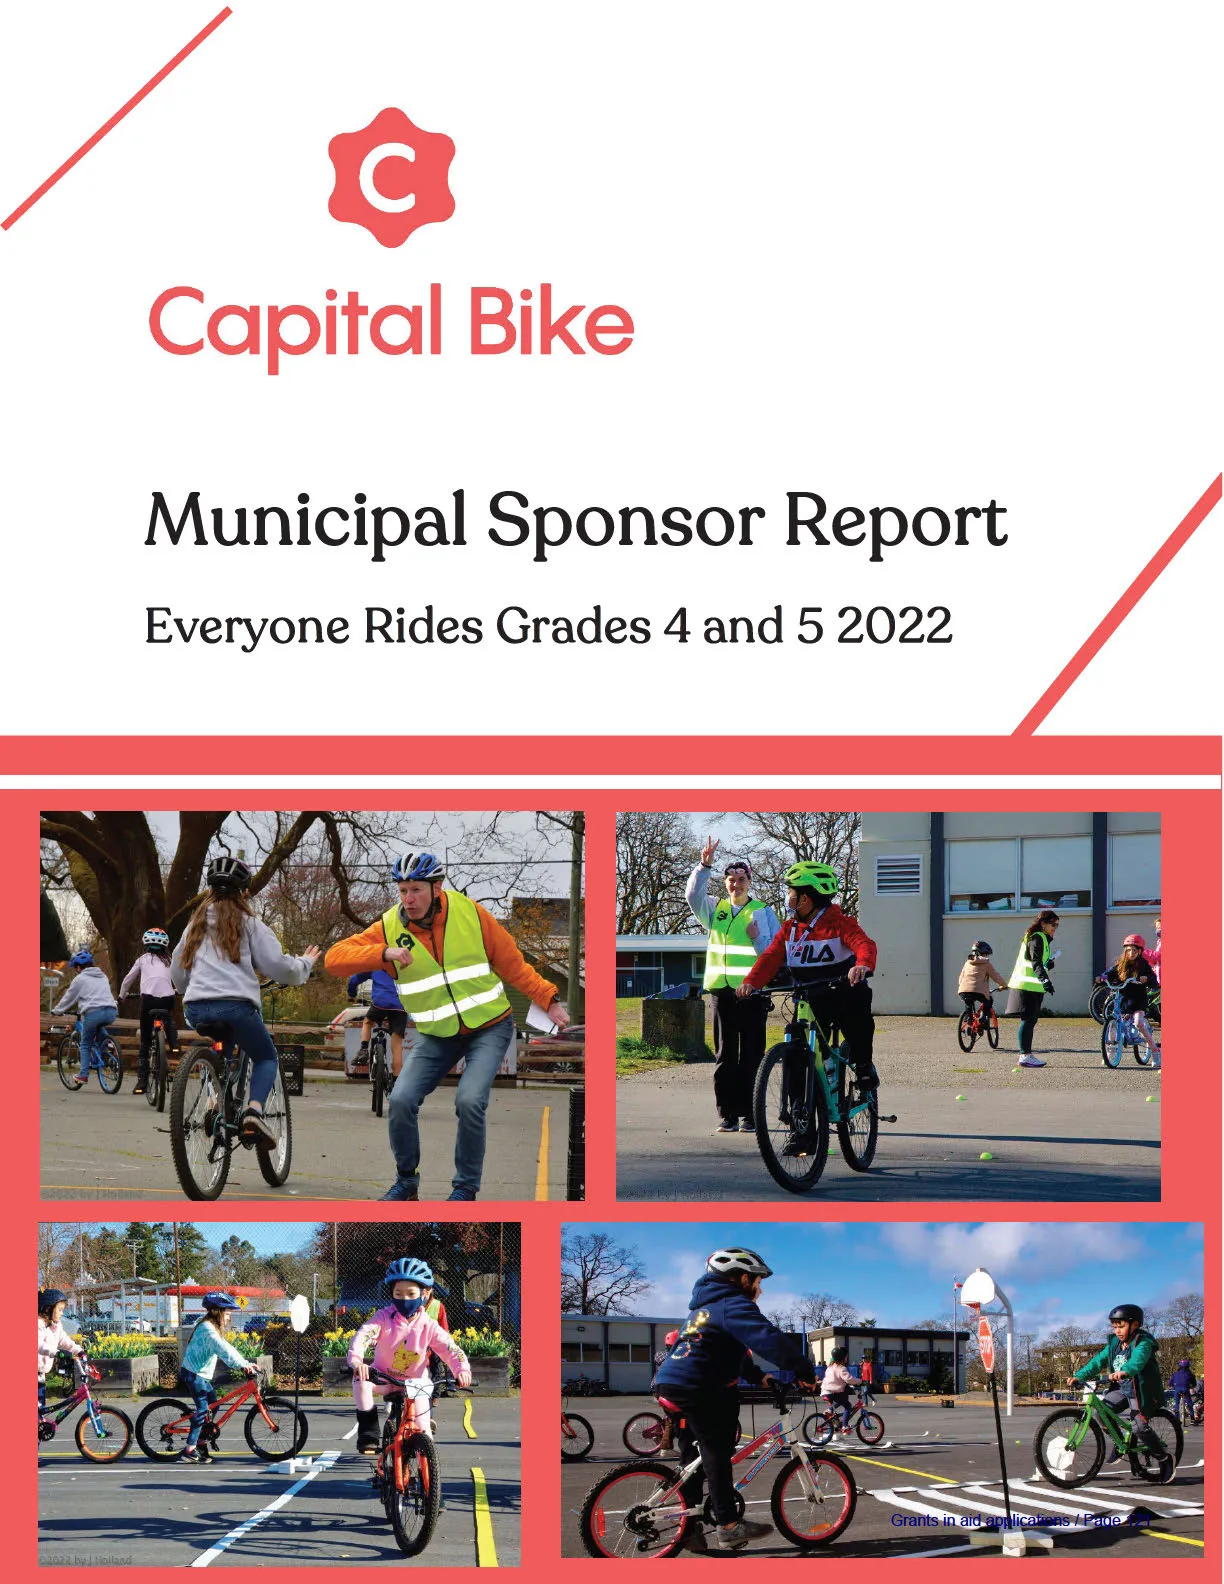
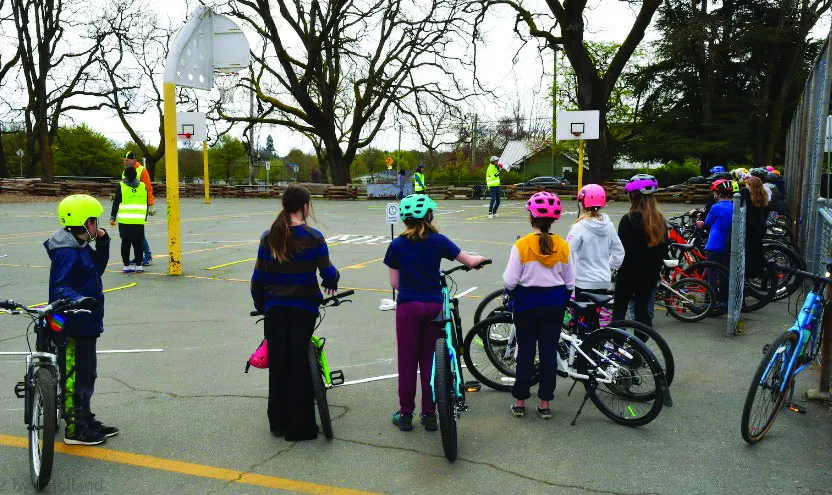
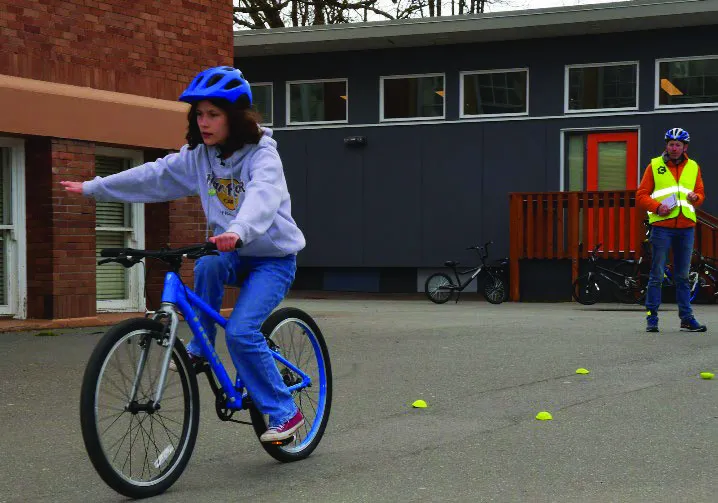
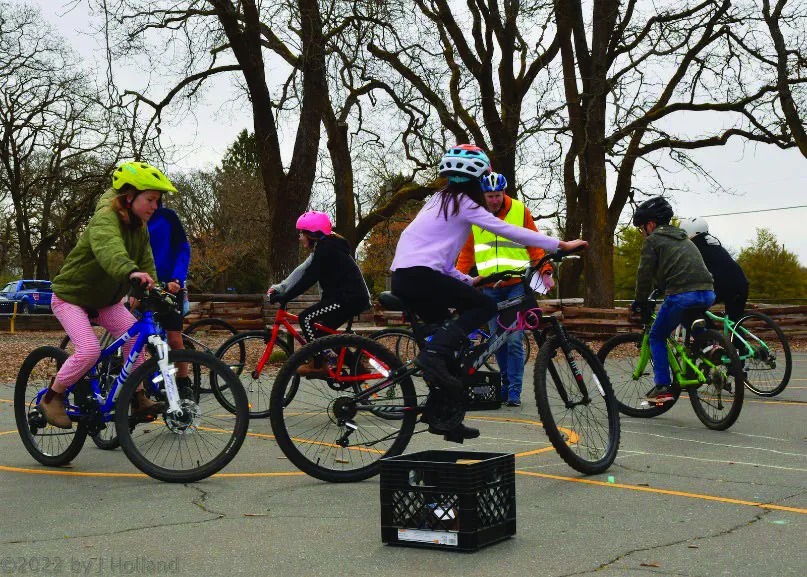
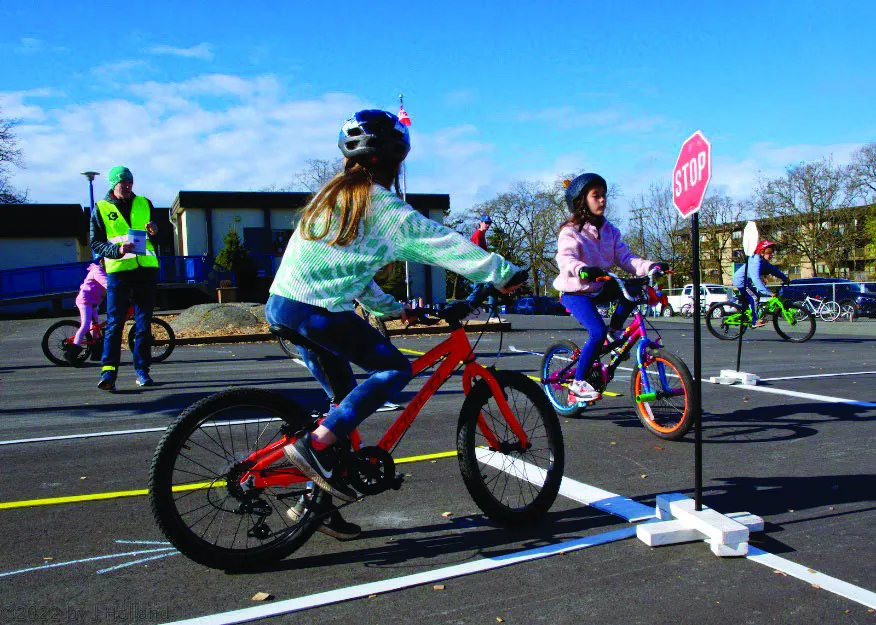
Taught in 90-minute blocks, the on-bike portion includes 4 stations teaching bike handling skills through fun games, multi-use trail etiquette, rules of the road and right-of-way at intersections, and signalling and shoulder checks. To make the course accessible, we provide a fleet of 22 bikes for students to borrow for the duration of the course. Our fleet also includes 2 strider bikes, for new riders to learn balancing before using pedal bikes, and a recumbent trike for students with mobility limitations to be able to participate fully in the program.
The photos included in this report are from two programs in spring 2022, at Oaklands and Cloverdale Elementary, by our volunteer photographer John Holland, as View Royal decline photo permissions this year. They show the same activities and stations as the course at View Royal.
Summary of Results
View Royal Elementary
- Number of students: 97
- Number of classes: 5
- Number of teachers engaged: 6
2022 Everyone Rides Season
- Number of schools: 27
- Number of courses: 32
- Number of students: 3,135 students
- Number of classes: 137
- Number of teachers engaged: 167
- Average rating of the overall quality of the course: 4.6/5
Community Benefit
The benefits of this program extend beyond the students who participate. By offering this bike education we are contributing to healthier, happier, and safer communities. Benefits to the school and community include:
- Healthier kids: by giving students the tools they need to bike to school and in their community, we give them the opportunity to make physical activity a greater part of their lives.
- Reduced congestion: schools in Greater Victoria struggle increasingly with congestion at pickup and drop-off times and are increasingly promoting active transportation to ameliorate this issue. By instructing students in safe biking we aid schools in meeting these goals.
- Safer communities: Teaching students aged 9 and 10 about safe cycling helps keep vulnerable road users safe in the local community.
- Courteous road and trail users: by teaching how to communicate courteously and follow the rules on roads and trails we are helping foster a community of considerate and polite cyclists in your community.
Thank you for your continued support!
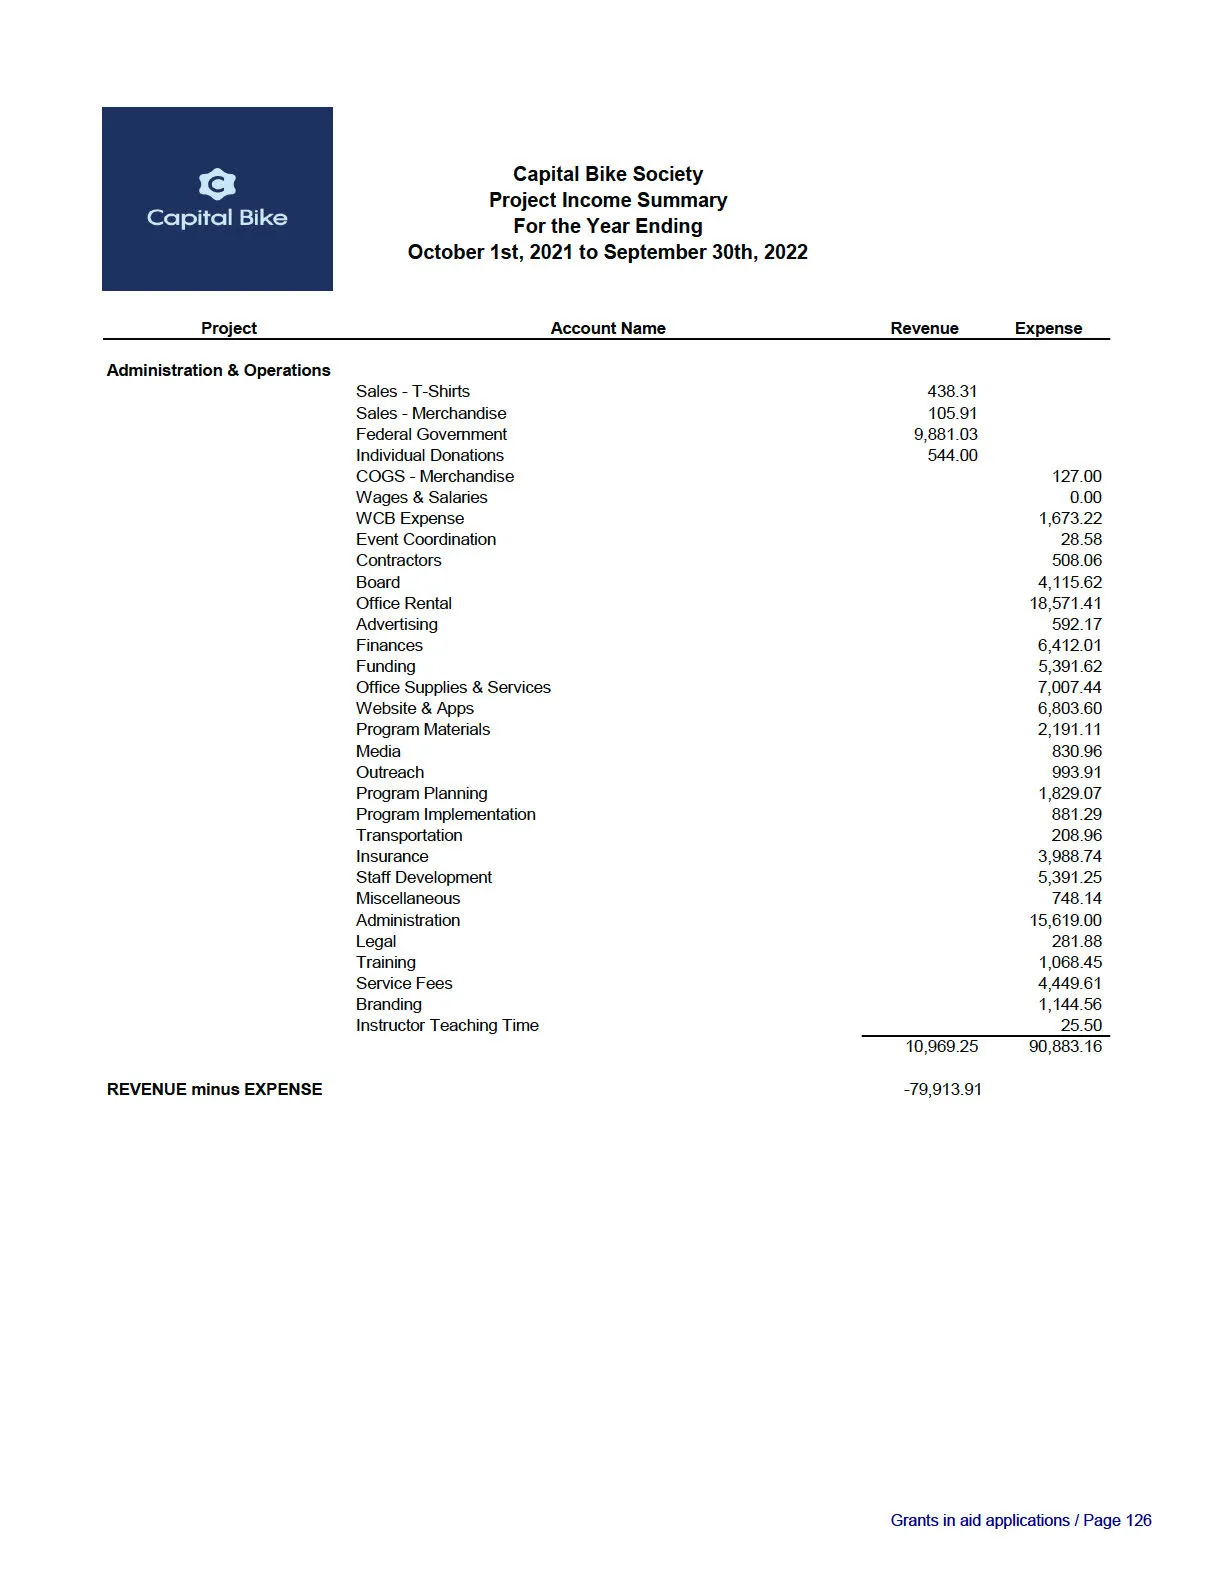
Capital Bike Society Project Income Summary
For the Year Ending October 1st, 2021 to September 30th, 2022
| Project | Account Name | Revenue | Expense |
|---|---|---|---|
| Administration & Operations | |||
| Sales - T-Shirts | 438.31 | ||
| Sales - Merchandise | 105.91 | ||
| Federal Government | 9,881.03 | ||
| Individual Donations | 544.00 | ||
| COGS - Merchandise | 127.00 | ||
| Wages & Salaries | 0.00 | ||
| WCB Expense | 1,673.22 | ||
| Event Coordination | 28.58 | ||
| Contractors | 508.06 | ||
| Board | 4,115.62 | ||
| Office Rental | 18,571.41 | ||
| Advertising | 592.17 | ||
| Finances | 6,412.01 | ||
| Funding | 5,391.62 | ||
| Office Supplies & Services | 7,007.44 | ||
| Website & Apps | 6,803.60 | ||
| Program Materials | 2,191.11 | ||
| Media | 830.96 | ||
| Outreach | 993.91 | ||
| Program Planning | 1,829.07 | ||
| Program Implementation | 881.29 | ||
| Transportation | 208.96 | ||
| Insurance | 3,988.74 | ||
| Staff Development | 5,391.25 | ||
| Miscellaneous | 748.14 | ||
| Administration | 15,619.00 | ||
| Legal | 281.88 | ||
| Training | 1,068.45 | ||
| Service Fees | 4,449.61 | ||
| Branding | 1,144.56 | ||
| Instructor Teaching Time | 25.50 | ||
| Project Totals | 10,969.25 | 90,883.16 | |
| REVENUE minus EXPENSE | -79,913.91 |
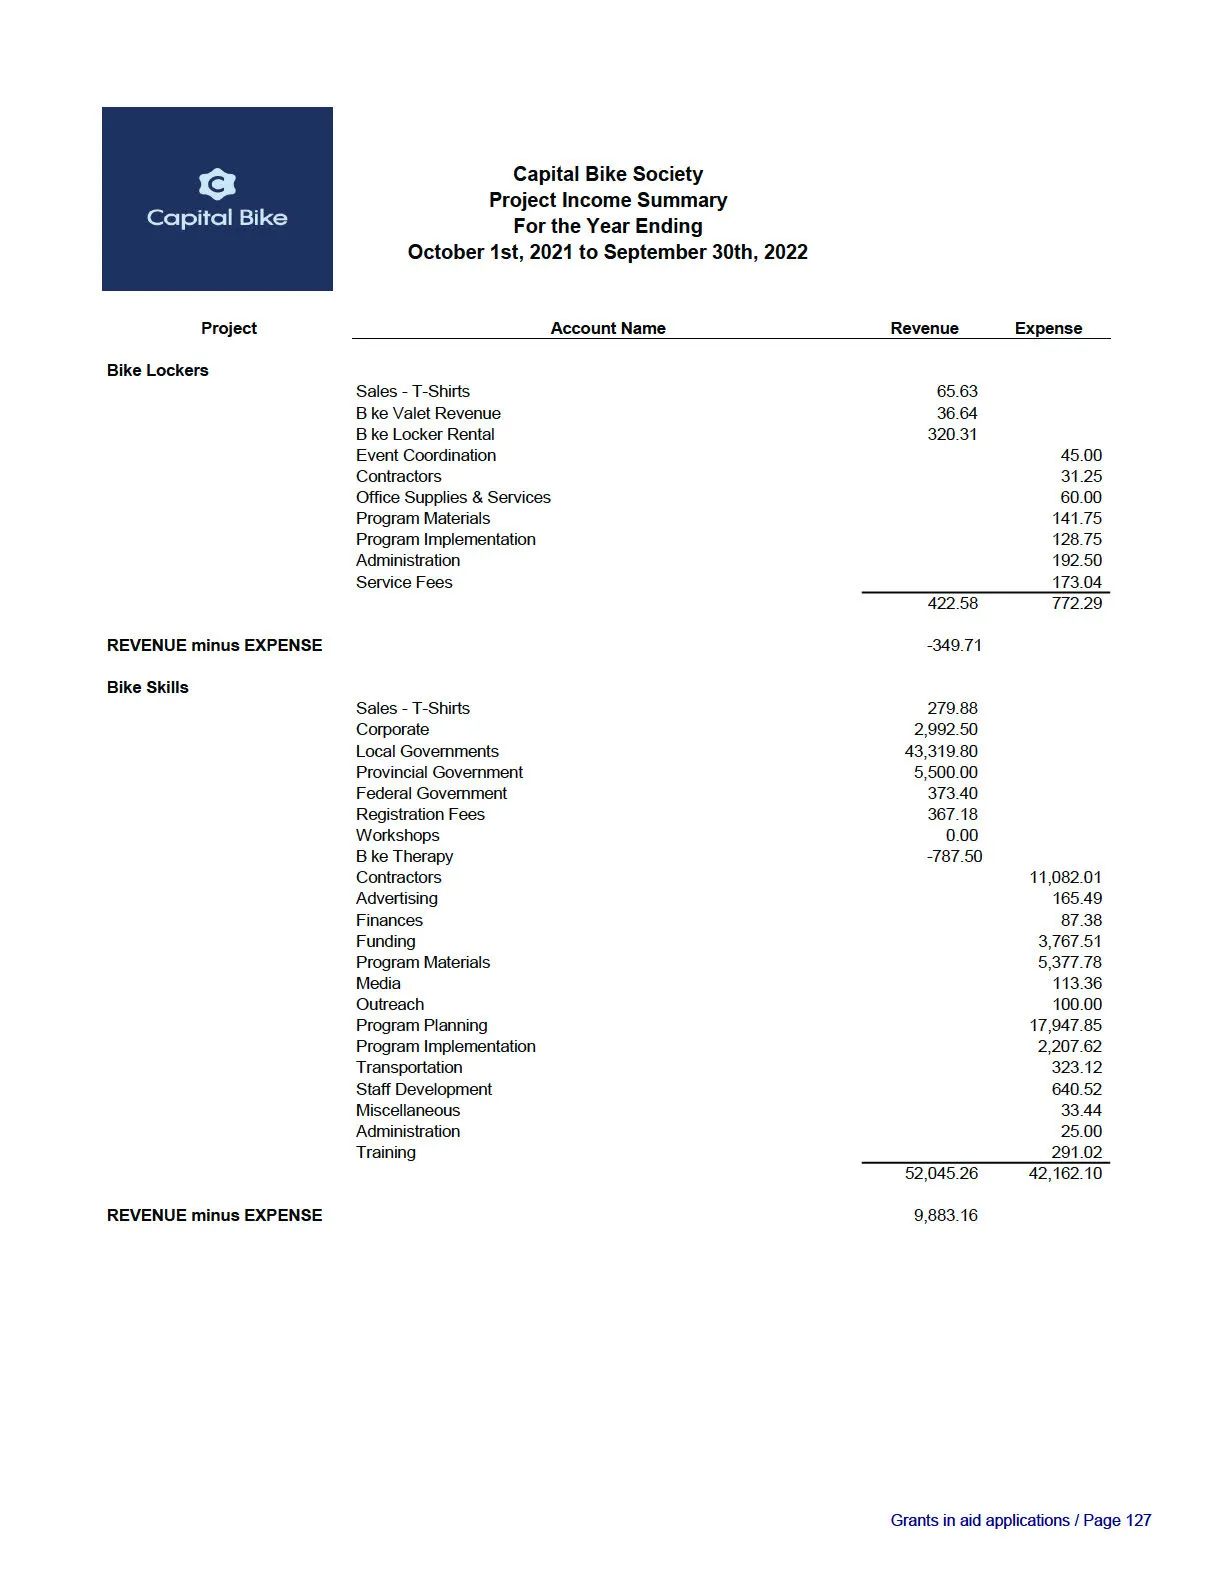
| Project | Account Name | Revenue | Expense |
|---|---|---|---|
| Bike Lockers | |||
| Sales - T-Shirts | 65.63 | ||
| Bike Valet Revenue | 36.64 | ||
| Bike Locker Rental | 320.31 | ||
| Event Coordination | 45.00 | ||
| Contractors | 31.25 | ||
| Office Supplies & Services | 60.00 | ||
| Program Materials | 141.75 | ||
| Program Implementation | 128.75 | ||
| Administration | 192.50 | ||
| Service Fees | 173.04 | ||
| Project Totals | 422.58 | 772.29 | |
| REVENUE minus EXPENSE | -349.71 | ||
| Bike Skills | |||
| Sales - T-Shirts | 279.88 | ||
| Corporate | 2,992.50 | ||
| Local Governments | 43,319.80 | ||
| Provincial Government | 5,500.00 | ||
| Federal Government | 373.40 | ||
| Registration Fees | 367.18 | ||
| Workshops | 0.00 | ||
| Bike Therapy | -787.50 | ||
| Contractors | 11,082.01 | ||
| Advertising | 165.49 | ||
| Finances | 87.38 | ||
| Funding | 3,767.51 | ||
| Program Materials | 5,377.78 | ||
| Media | 113.36 | ||
| Outreach | 100.00 | ||
| Program Planning | 17,947.85 | ||
| Program Implementation | 2,207.62 | ||
| Transportation | 323.12 | ||
| Staff Development | 640.52 | ||
| Miscellaneous | 33.44 | ||
| Administration | 25.00 | ||
| Training | 291.02 | ||
| Project Totals | 52,045.26 | 42,162.10 | |
| REVENUE minus EXPENSE | 9,883.16 |
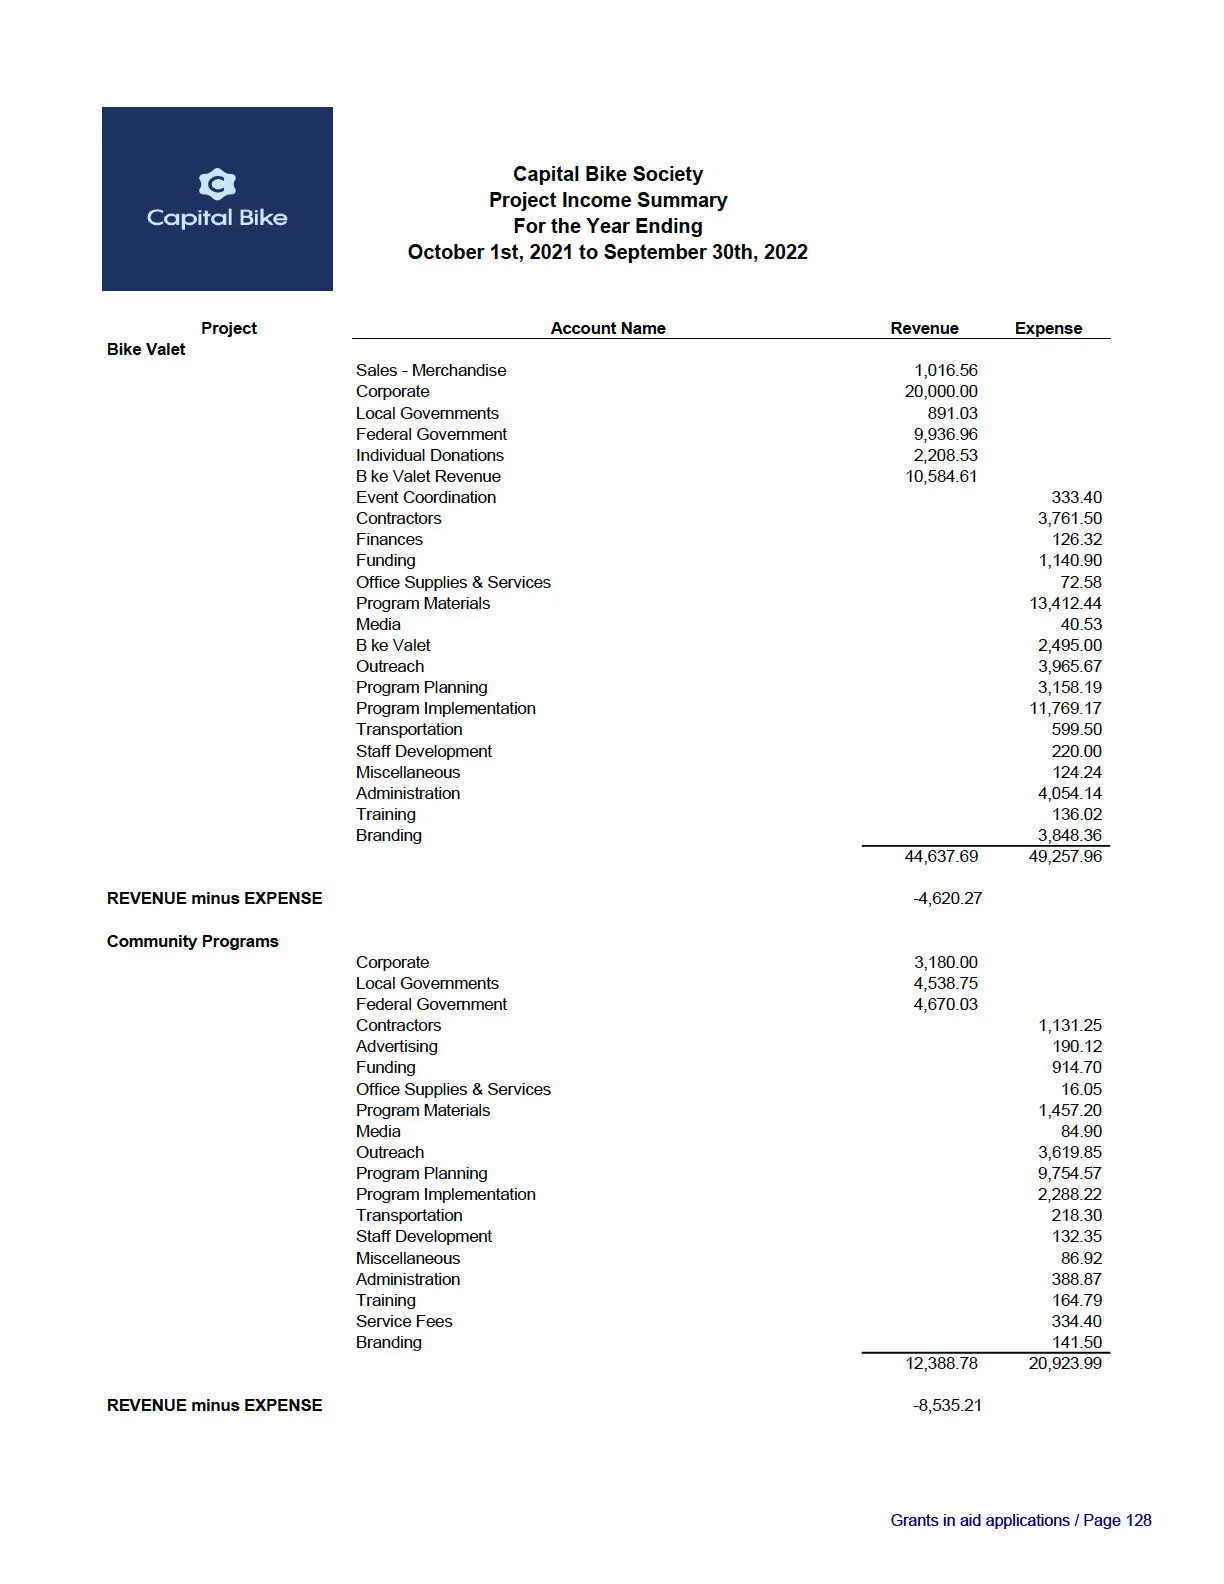
| Project | Account Name | Revenue | Expense |
|---|---|---|---|
| Bike Valet | |||
| Sales - Merchandise | 1,016.56 | ||
| Corporate | 20,000.00 | ||
| Local Governments | 891.03 | ||
| Federal Government | 9,936.96 | ||
| Individual Donations | 2,208.53 | ||
| Bike Valet Revenue | 10,584.61 | ||
| Event Coordination | 333.40 | ||
| Contractors | 3,761.50 | ||
| Finances | 126.32 | ||
| Funding | 1,140.90 | ||
| Office Supplies & Services | 72.58 | ||
| Program Materials | 13,412.44 | ||
| Media | 40.53 | ||
| Bike Valet | 2,495.00 | ||
| Outreach | 3,965.67 | ||
| Program Planning | 3,158.19 | ||
| Program Implementation | 11,769.17 | ||
| Transportation | 599.50 | ||
| Staff Development | 220.00 | ||
| Miscellaneous | 124.24 | ||
| Administration | 4,054.14 | ||
| Training | 136.02 | ||
| Branding | 3,848.36 | ||
| Project Totals | 44,637.69 | 49,257.96 | |
| REVENUE minus EXPENSE | -4,620.27 | ||
| Community Programs | |||
| Corporate | 3,180.00 | ||
| Local Governments | 4,538.75 | ||
| Federal Government | 4,670.03 | ||
| Contractors | 1,131.25 | ||
| Advertising | 190.12 | ||
| Funding | 914.70 | ||
| Office Supplies & Services | 16.05 | ||
| Program Materials | 1,457.20 | ||
| Media | 84.90 | ||
| Outreach | 3,619.85 | ||
| Program Planning | 9,754.57 | ||
| Program Implementation | 2,288.22 | ||
| Transportation | 218.30 | ||
| Staff Development | 132.35 | ||
| Miscellaneous | 86.92 | ||
| Administration | 388.87 | ||
| Training | 164.79 | ||
| Service Fees | 334.40 | ||
| Branding | 141.50 | ||
| Project Totals | 12,388.78 | 20,923.99 | |
| REVENUE minus EXPENSE | -8,535.21 |
Document Images
(4)