Attachment 8 - A Transportation Review Report
Comprehensive traffic impact study assessing road networks, trip generation, levels of service, and parking requirements for the proposed townhouses.
A Transportation Review Report For MIXED RESIDENTIAL DEVELOPMENT - TOWNHOMES
296 Eltham Road & 242 Helmcken Road, View Royal, Victoria, BC
Prepared for Jeffery Sengara, Owner
January 3, 2023
ADDOZ ENGINEERING INC Clients are Our First Priority
81 Evansridge Circle NW, Calgary, AB T3P0H9 Cell 1: 587-703-5222 Cell 2: 587-703-9321 Email: ealsaidi@addozeng.ca
TABLE OF CONTENTS
1.0 INTRODUCTION ..................................................................................................................................... 5 1.1 General ............................................................................................................................... 5 1.2 Planned Development......................................................................................................... 5 1.3 Purpose of Study................................................................................................................. 5 1.4 Methodologies..................................................................................................................... 7
2.0 EXISTING CONDITIONS........................................................................................................................ 8 2.1 Area Road Network............................................................................................................. 8 2.2 Existing Traffic Volumes and Conditions ............................................................................ 8 2.4 Existing Heavy Vehicle Composition ................................................................................ 11
3.0 PROJECTED TRAFFIC VOLUMES ..................................................................................................... 12 3.1 Site Generated Trips ......................................................................................................... 12 3.1.1 Pass-by Trips .................................................................................................................... 12 3.1.2 Internal Trips ..................................................................................................................... 13 3.2 Trip Distribution ................................................................................................................. 13 3.3 Trip Assignment ................................................................................................................ 13 3.3.1 Site Generated Traffic Volumes........................................................................................ 13 3.3.2 Post Development Traffic Volumes................................................................................... 13
4.0 EVALUATION AND RECOMMENDED IMPROVEMENTS .................................................................. 16 4.1 Level of Service Criteria for Intersections ......................................................................... 16 4.2 Capacity and Level of Service Analyses........................................................................... 16 4.2.1 Existing 2022 Traffic Conditions ....................................................................................... 17 4.2.2 Post Development Traffic Conditions................................................................................ 18 4.3 Intersection Layout Assessment, Left Turn Requirement................................................. 18 4.4 Access and Major Intersections’ Sight Distance Review .................................................. 21
5.0 PARKING AND TRAVEL DEMAND MANAGEMENT REVIEWS......................................................... 29 5.1 Vehicle Parking Supply / Demand Analysis and Loading Requirement ........................... 29 5.2 Bicycle Parking Supply / Demand Analysis ...................................................................... 29 5.3 Travel Demand Management ........................................................................................... 30
6.0 CONCLUSIONS AND RECOMMENDATIONS..................................................................................... 31
Appendices:
Appendix A: Project Development Site Plans Appendix B: Turning Movement Traffic Count Data Appendix C: Synchro - HCM 6th Edition Capacity Analysis Reports
List of Figures
| Figure | Title | Page |
|---|---|---|
| Figure 1a | Site Location Map | 6 |
| Figure 1b | Local Context Aerial Map | 6 |
| Figure 1c | Existing Intersection Lane Configuration and Control Type | 9 |
| Figure 2 | Existing 2022 Peak Hour Traffic Volumes | 10 |
| Figure 3 | Existing 2022 Pedestrian Crossing and Bicycle Peak Hour Volumes | 10 |
| Figure 4 | Direction of Approach and Site Access Distribution | 14 |
| Figure 5 | Site Generated Peak Hour Traffic Volumes | 14 |
| Figure 6 | Post Development Peak Hour Traffic Volumes | 15 |
| Figure 7 | Collision History at Helmcken Road and Eltham Intersection | 20 |
| Figure 8a | Sight Distance and Visibility for 90° Intersection Approaches | 22 |
| Figure 8b | Design Sight Distance For Departures From Stop Controlled Approach | 25 |
| Figure 9 | Sight Distance Field Measurement at Helmcken Road and Eltham Road | 27 |
| Figure 10 | Sight Distance Field Measurement at Access A1 on Eltham Road | 28 |
List of Tables
| Table | Title | Page |
|---|---|---|
| Table 1 | Adjacent Highway Heavy Vehicle Composition (in %) | 11 |
| Table 2 | Trip Generation Rates, ITE Trip Generation Manual | 12 |
| Table 3 | Projected Site-Generated Peak-Hour Volume | 12 |
| Table 4 | Level of Service Criteria for Unsignalized Intersections | 16 |
| Table 5 | Level of Service Criteria for Signalized Intersections | 16 |
| Table 6 | Capacity Analysis for Existing 2022 Traffic Conditions | 17 |
| Table 7 | Capacity Analysis for Post Development, Opening Traffic Conditions | 18 |
| Table 8 | Town of View Royal’s Parking Requirements (Supply / Demand Analysis) | 29 |
| Table 9 | Town of View Royal’s Bicycle Parking Requirements (Supply / Demand) | 29 |
1.0 INTRODUCTION
1.1 General
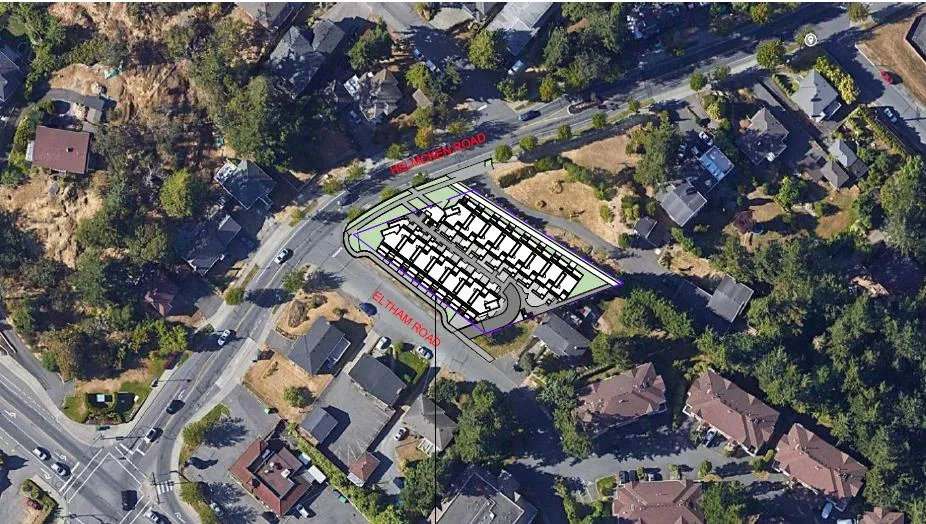
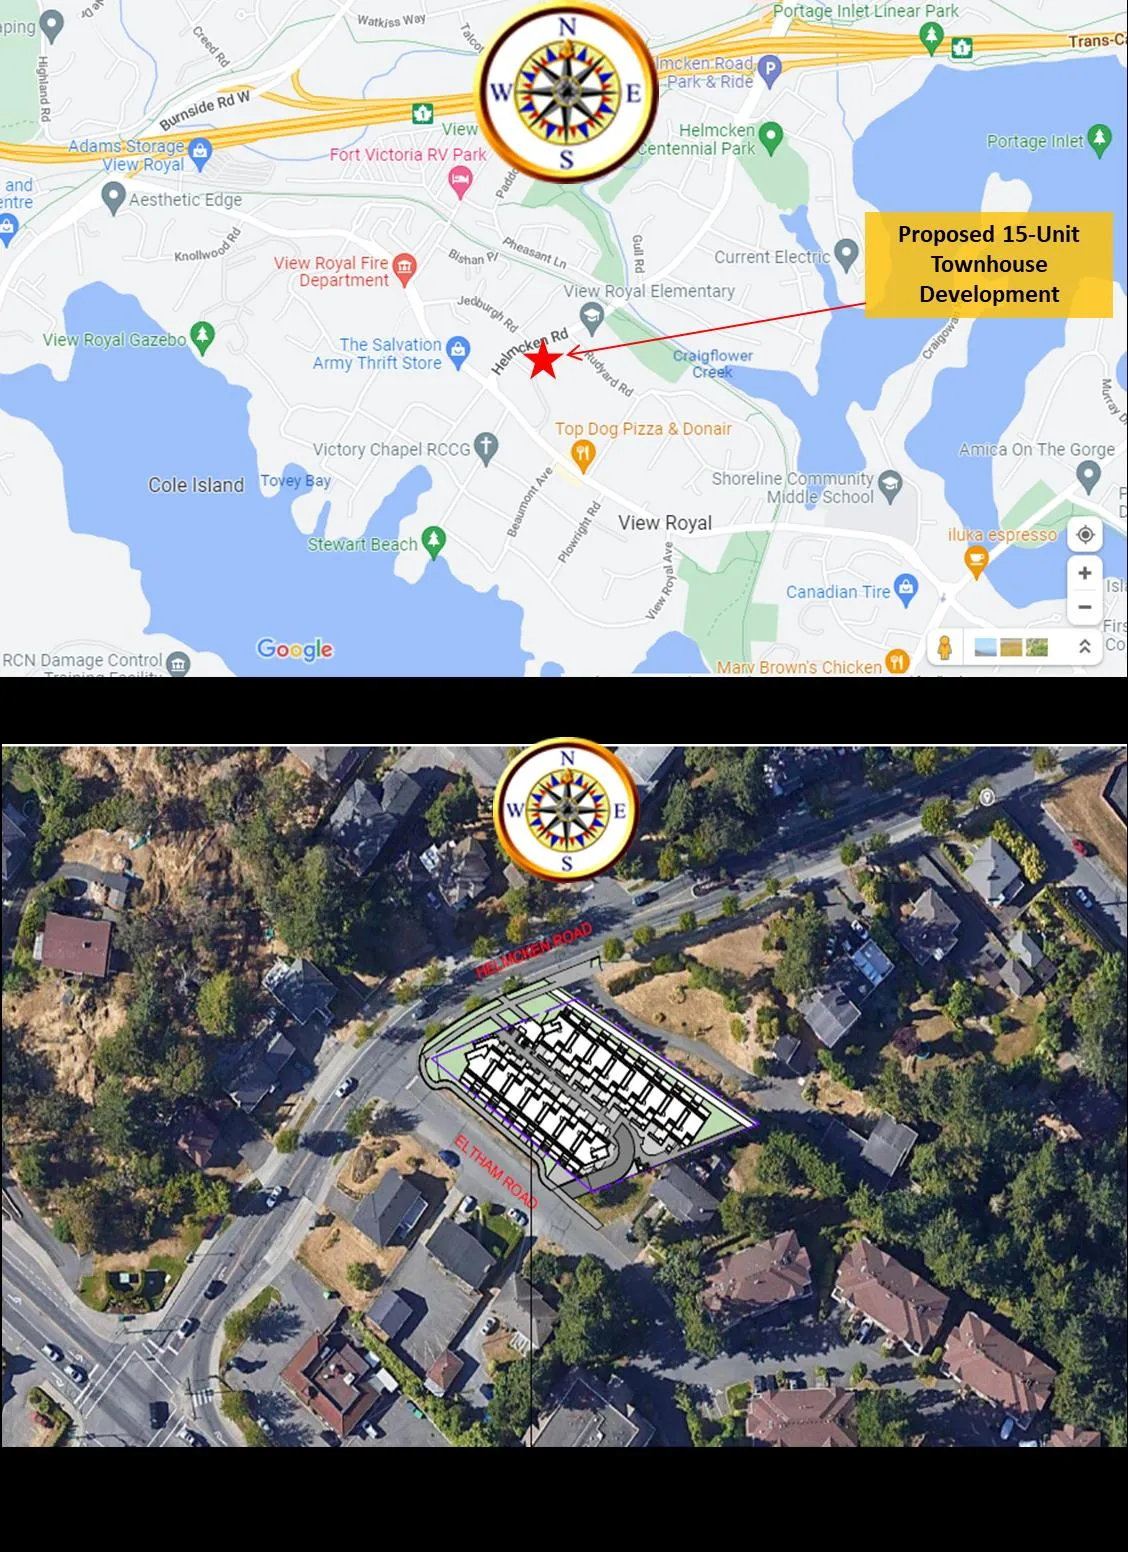
Mr. Jeffery Sengara retained Addoz Engineering Inc. to prepare a transportation review in support of the proposed Mixed-Use Residential Development, Townhomes to be in View Royal, Victoria, British Columbia. The proposed development will consist of a total of 15-Unit townhouses. The development will be located at 296 Eltham Road & 242 Helmcken Road, View Royal, BC. The project will be located on the northeastern quadrant of Helmcken Road and Eltham Road intersection. This transportation review is being prepared to assess potential transportation impacts of the proposed development and to satisfy View Royal’s requirements for such a study as a result of the proposed development.
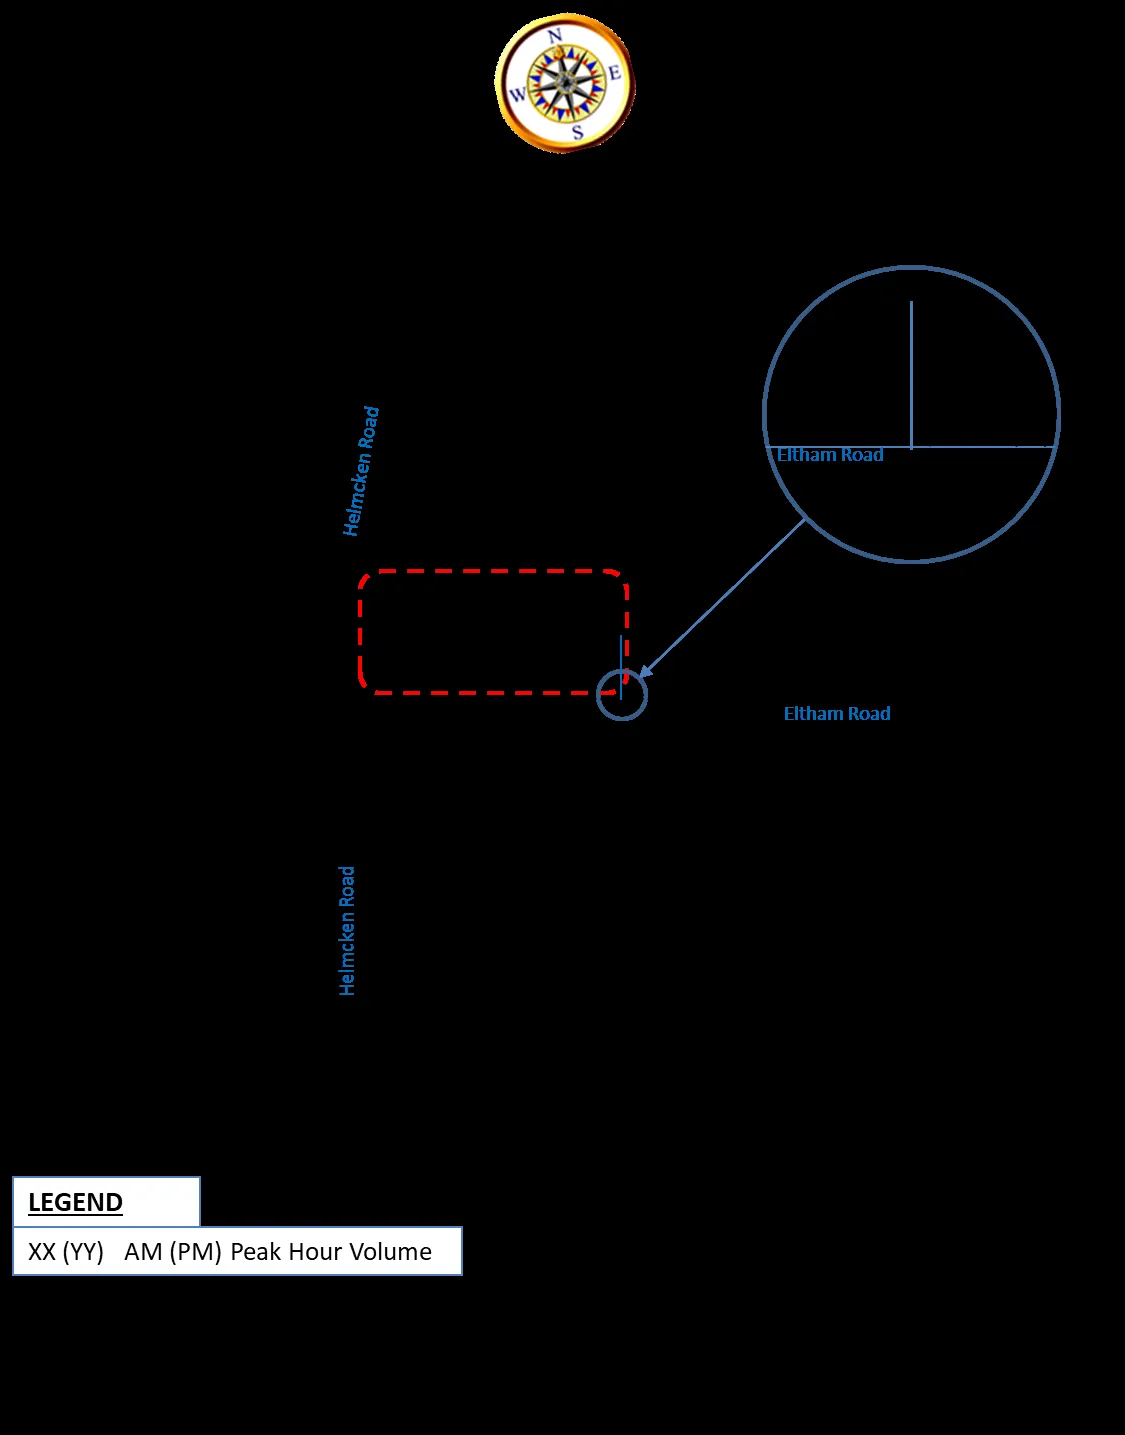
Figure 1a presents a site map that presents the general location of the proposed development, and Figure 1b presents a local context aerial map.
1.2 Planned Development
The proposed development will occupy the existing two houses currently located at 296 Eltham Road & 242 Helmcken Road, View Royal, BC. The proposed development will consist of 15-unit townhouses and one underground parking level. The proposed site plans are attached in Appendix A of this report.
1.3 Purpose of Study
The primary purposes of this transportation review study are:
- To evaluate the traffic operations and levels of service (LOS) at the following intersections:
- Helmcken Road and Eltham Road intersection; and
- Eltham Road and Site Access intersection.
- To evaluate any potential project traffic impacts of the proposed development to the surrounding roadway network, and to determine if the roadways, site access and traffic circulations in the project vicinities would be suitable for the intended development and the amount of development traffic volumes anticipated.
- To identify suitable intersection control and geometric configurations that would be required to properly service the proposed development including conducting left-turn lane assessment for the Helmcken Road and Eltham Road intersection, based on Transportation Association of Canada (TAC)’s standards.
- Also, to identify any needed short-term and long-term roadway improvements in the project areas to enable acceptable traffic operations that would satisfy View Royal’s requirements.
1.4 Methodologies
This transportation review utilizes the following evaluation methodologies:
- Data collection including but not limited to existing roadway and intersection geometric characteristic, pavement markings, and traffic control types.
- A new peak hour traffic count collected on a typical weekday at the major study intersection.
- Trip generation estimate for the proposed development were based on appropriate Trip Generation land use categories available in the trip generation manual published by the Institute of Transportation Engineers (ITE), 11th Edition.
- Distribution of the site generated trips to/from the development site based on population, land uses, roadway network, and existing traffic patterns in the project vicinities.
- Assignment of the project trips to the adjacent roadways based on the proposed project site plan and the estimated roadway trip distribution characteristics.
- Intersection layout assessment based on the Transportation Association of Canada’s standards will be completed to determine any needed improvements for the study intersection. The study will analyze whether there is a need for a left turn lane for either Helmcken Road or Eltham Road.
- Sightline field measurement and assessment will be completed for the site access intersection and the Helmcken Road / Eltham Road intersection. The town indicated they have concerns with respect to the sightlines, both vertical and horizontal, as a result of this development.
- Existing and Post Development traffic capacity analysis for the study area intersections and roadways to identify possible capacity constraints and to assess overall traffic impacts of the proposed development, which is based on the latest Highway Capacity Manual (HCM) methodologies by the Transportation Research Board, the US National Academies of Sciences, Engineering and Medicine.
2.0 EXISTING CONDITIONS
2.1 Area Road Network
There are two roadways providing access to the site as described below. These roadways are Helmcken Road and Eltham Road. A brief description of each of these roadways follows.
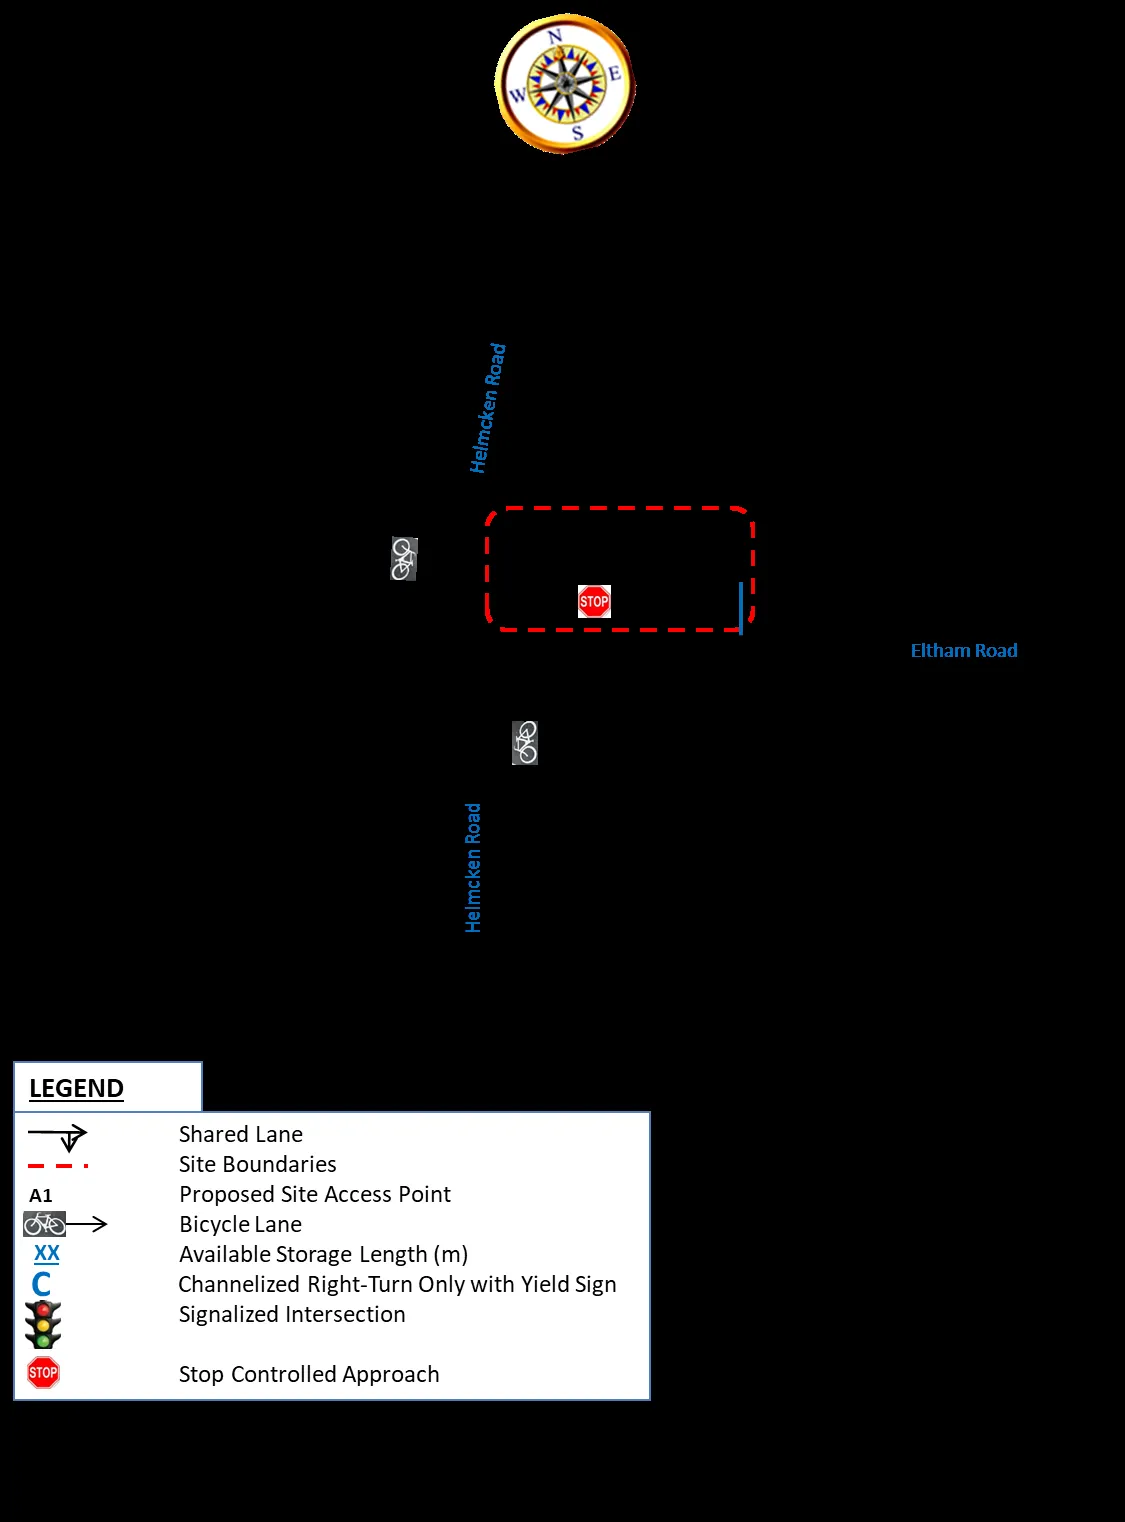
Helmcken Road is a two-lane two-way undivided roadway that runs in the north / south directions in the vicinity of the proposed development and intersects with Eltham Road creating a T-intersection. Helmcken Road connects the areas south of Eltham Road to provincial Highway 1 and the areas to the north of Highway 1. The speed limit on Helmcken Road is posted at 40 Km / hr. in the vicinity of the proposed development. Helmcken Road has marked bicycle lanes on the northbound and southbound direction adjacent to vehicle travel lanes.
Eltham Road is a two-lane two-way undivided paved local roadway that runs in the east / west directions in the vicinity of the site. The speed limit on Eltham Road is not posted but the prima facie speed is 40 Km/hr.
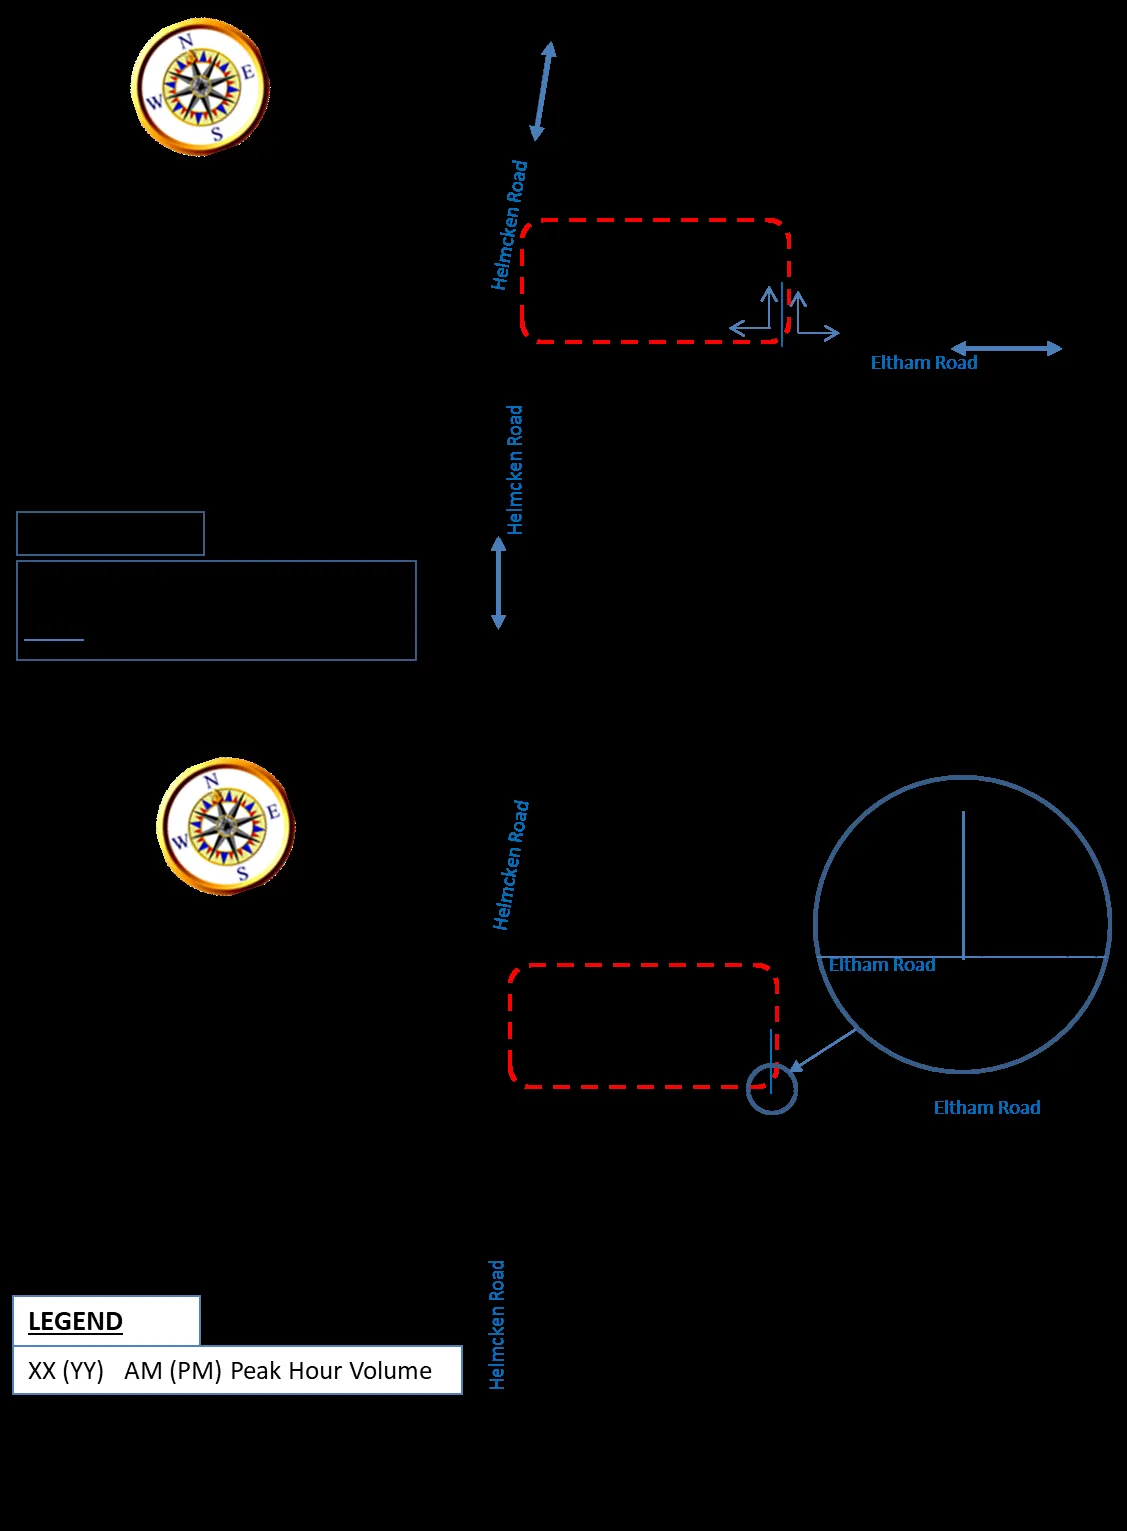
The intersection of Helmcken Road and Eltham Road is a 3-leg unsignalized intersection with stop-control sign on Eltham Road approach and a free flow operation on Helmcken Road north / south approaches. This intersection has one left/right shared lane in the westbound direction, one shared through/left lane in southbound direction, and one through/right lane in the northbound direction. Refer to Figure 1c that presents the current intersection layout for more details.
2.2 Existing Traffic Volumes and Conditions
A field and desktop reconnaissance of the site and its surroundings was conducted to establish a database of the existing conditions. The peak period for the proposed residential development would typically occur during the weekday morning and afternoon periods. Turning movement traffic count data was collected on Tuesday, December 13, 2022 from 7:00 AM to 9:00 AM and from 4:00 PM to 6:00 PM for the a.m. and p.m. peak periods respectively at the following study intersection:
- Helmcken Road and Eltham Road Intersection.
The Existing 2022 AM and PM peak-hour traffic volumes for the above intersection are illustrated on Figure 2. Details of the collected traffic count data for the study intersection are contained in Appendix B.
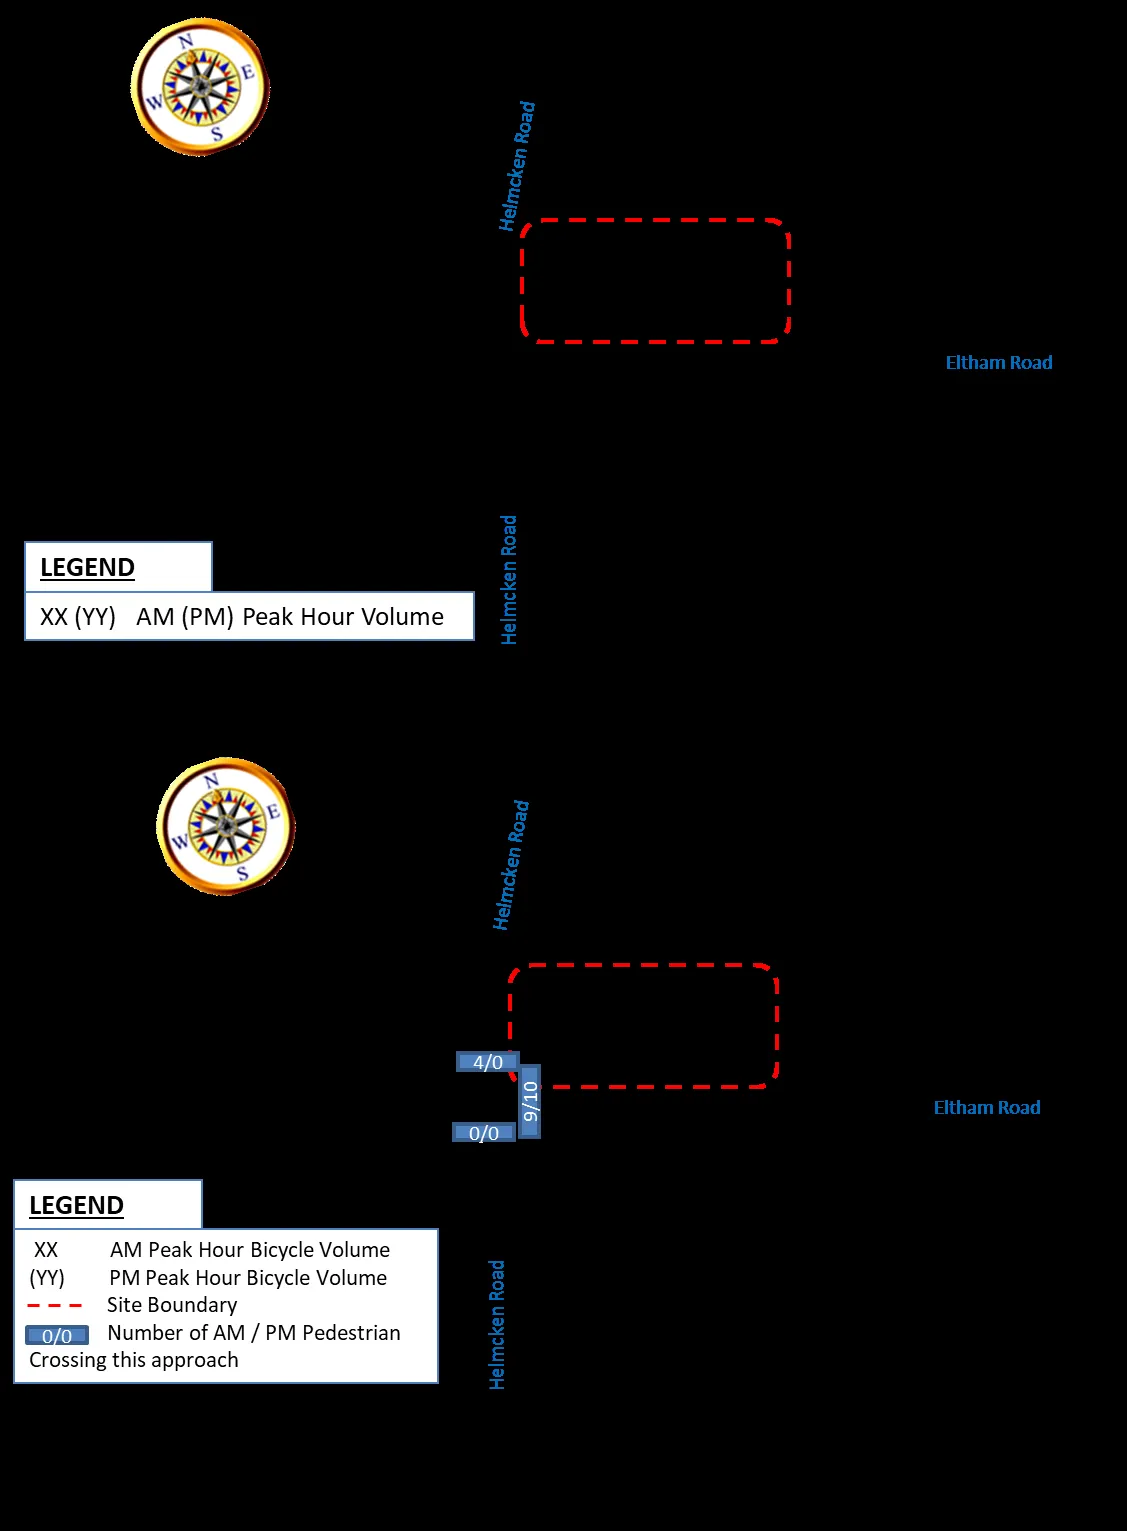
Additionally, the Existing 2022 bicycle traffic and pedestrian crossing the study intersection are presented on Figure 3. A review of Figure 3 indicates that observed bicycle traffic was low; however, pedestrian crossing was significant. The numbers of conflicting pedestrian and bicycle were considered in the Synchro capacity analyses for the study intersection.
2.4 Existing Heavy Vehicle Composition
The AM peak hour and PM peak hour heavy vehicle compositions were determined from the recent turning movement traffic count completed for this study. The resulted heavy vehicle percentages are presented in Table 1. Note that the sum of Single Unit Trucks and the Tractor Trailer Unit were considered to represent heavy vehicle traffic and their percentages are presented in the below table.
Table 1: Adjacent Highway Heavy Vehicle Composition (in %)
| Description | Existing 2022 Traffic Volume Data | ||
|---|---|---|---|
| Helmcken Road | Eltham Road | ||
| South of Eltham Road | North of Eltham Road | East of Helmcken Road | |
| AM Peak Hour | 4.0% | 1.0% | 5.0% |
| PM Peak Hour | 3.0% | 3.0% | 0.0% |
The capacity analyses for major study intersection utilized above heavy vehicle percentages. Noting that for the approaches with a percentage lower than 2%, a heavy vehicle percentage of 2% was utilized in the capacity analyses for that approach.
3.0 PROJECTED TRAFFIC VOLUMES
3.1 Site Generated Trips
To estimate the number of vehicle trips expected to be generated by a development, trip generation rates are applied based on the proposed land uses and intensity. The number of trips that would be generated by a proposed development would usually be estimated based on the rates published in Trip Generation Manual, 11th Edition by the Institute of Transportation Engineers (ITE).
The trip generation rates along with the proposed land uses and the corresponding ITE land use codes are presented in Table 2. The proposed development’s generated trips are presented in Table 3.
Table 2: Trip Generation Rates ITE 11th Edition Trip Generation Manual
| Land Use | ITE Code | Dwelling Units | AM Peak Hour | PM Peak Hour | Daily Trips total | ||||
|---|---|---|---|---|---|---|---|---|---|
| In | out | total | in | out | total | ||||
| Single-Family Attached Housing | 215 | Dwelling Units | 31% | 69% | 0.48 | 57% | 43% | 0.57 | 7.2 |
Table 3: Projected Site-Generated Peak-Hour and Daily Traffic Volumes
| Development | ITE Code | Density | AM Peak Hour | PM Peak Hour | Daily Trips Total | ||||
|---|---|---|---|---|---|---|---|---|---|
| in | out | total | in | out | total | ||||
| Proposed 15-Unit Townhouses | 215 | 15 Units | 2 | 5 | 7 | 5 | 4 | 9 | 108 |
3.1.1 Pass-by Trips
Pass-by trips are not new trips, but they are the trips that are attracted from the traffic passing the site on adjacent roadways. While pass-by trips are new trips at the access points to the site, they are not new trips on the adjacent roadway systems. Since the proposed development will include a residential Development, no pass-by trips are expected for such a development. Therefore, no reduction for pass-by trips considered.
3.1.2 Internal Trips
An internal trip is a trip that has both its origin and destination within a multi-use or mixed-use development area under investigation, which should be deducted from the total number of trips departing and entering the study site. The appropriate internal trip reduction rates are based on the characteristics of the mixed land uses. The proposed development will include a residential land use, hence internal trips are not expected for such development. Therefore, no reduction for internal trips considered.
3.2 Trip Distribution
The directions from which vehicles will approach and depart a site is a function of several variables, including the population and employment distribution within the development’s area of influence, the operational characteristics of the road system, and the ease with which drivers can travel over various sections of the roadway network without encountering congestion. The directional distribution of new project trips by the proposed Residential Development was estimated based on existing traffic patterns coupled with the above factors. The resulting directional distribution are as follows:
- 48% of site generated trips will travel to and from the north on Helmcken Road.
- 48% of site generated trips will travel to and from the south on Helmcken Road.
- 04% of site generated trips will travel to and from the east on Eltham Road.
The resulting traffic direction of approach and site access distribution is illustrated on Figure 4.
3.3 Trip Assignment
3.3.1 Site Generated Traffic Volumes
The projected peak-hour generated traffic volumes for the proposed 15-Unit Residential Development were assigned to the adjacent roadways based on the estimated directional distribution as shown on Figure 4. The resulted site generated AM peak hour and PM peak hour trips are illustrated on Figure 5.
3.3.2 Post Development Traffic Volumes
To determine the Post Development traffic volumes, the Existing 2022 traffic volumes shown on Figure 2 were added to development’s site-generated trips shown on Figure 5. The resulted Post Development, Opening, peak-hour traffic volumes are illustrated on Figure 6.