Committee of the Whole/Documents/2023 – 2027 FINANCIAL PLAN PRESENTATION - West Shore Parks & Recreation
Presentation
2023 – 2027 FINANCIAL PLAN PRESENTATION - West Shore Parks & Recreation
February 14, 2023Pages 56–7621 sections
Slide presentation providing an overview of the WSPR financial projections, challenges, and major expense increases for the upcoming five-year period.
7-8% inflation cited as a budget challengeCompletion of Skatepark projected for March 2023Non-discretionary expense increase: $234,8162% wage increase in current collective agreement
2023 – 2027 FINANCIAL PLAN
Town of View Royal February 14, 2023
Page 56–76
Today’s presentation includes:
- 2022 program highlights
- 2022 financial projections and major variances
- 2023 budget challenges
- 5-Year financial plan 2023-2027
- 2023 major expense increases
- Summary of the 2023 capital projects
- Skatepark update
- 5-Year Reserve Continuity
- Requisition impact to each municipality
- Conclusion
Page 56–76
2022 Program Highlights:
- Youth Programs
- 975 Swimming Lessons, 252 Skating lessons, 224 Licensed Care Children, 4,000 Summer Campers
- Facility Rentals
- 8,900 Field Hours, 15,132 Ice Hours, 4,600 Pool Hours
- Drop-in Programs
- 105,000 Fitness Users, 115,000 Swimmers, 16,000 Skaters, 2,800 Sports Users, 3,800 Youth Night Drop-ins, 34,100 Golf Rounds
- Supporting Community Events
- Change Makers (Regional Event at Starlight Stadium - Langford)
- National Indigenous Peoples Day (Regional Event at Royal Roads - Colwood)
- Beecher Bay End of School Celebration (Metchosin)
- Highlands Fall Fling (Highlands)
- Langford Light Up & Truck Light Parade (Langford) - Upcoming
- Colwood Christmas Light Up (Colwood) - Upcoming
Page 56–76
2022 Projection
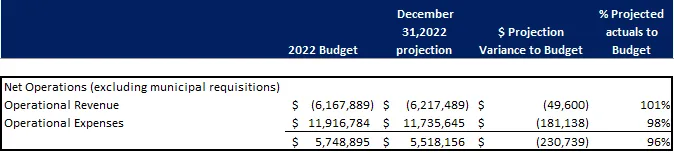
| Net Operations (excluding municipal requisitions) | 2022 Budget | December 31, 2022 projection | $ Projection Variance to Budget | % Projected actuals to Budget |
|---|---|---|---|---|
| Operational Revenue | $ (6,167,889) | $ (6,217,489) | $ (49,600) | 101% |
| Operational Expenses | $ 11,916,784 | $ 11,735,645 | $ (181,138) | 98% |
| $ 5,748,895 | $ 5,518,156 | $ (230,739) | 96% |
Page 56–76
2022 Projection Major Variances
| Major Variances: | Amount | Comments |
|---|---|---|
| Parks & Maintenance | $396,055 | Vacant positions – 8 FT vacancies from January to July |
| Community recreation | 215,661 | Budget was conservative due to COVID 19 |
| Fitness & Wellness | 43,474 | More programs offered and strong participation |
| Sports | 40,246 | Higher demand on field rentals |
| Administration | (186,681) | Expenses not budgeted to utilize the current year surplus and free up funding for 2023 |
| Weight & Rehab | ( 95,199) | Weight room closure in January and over inflated pass sale expectations |
| Curling/Dry Floor | ( 75,718) | Dry floor rental over inflated expectations for the year, no Netflix rentals this year |
| Golf | ( 33,530) | Cold and raining spring |
| Other | ( 73,569) | Minor variances from other programs |
| Total Surplus/(Deficit) | $230,739 | Net operation surplus for 2022 |
Page 56–76
2023 Budget challenges – 2021 Restart Fund
- In 2022, $209,513 unused restart funds were deferred from 2021 to 2022 to reduce the 2022 requisition from 8.36% to the approved 5.14%
- Comparing to 2022’s budget funding, 2023 is short by $209,513 or 3.22%
- This deficit has been addressed in the proposed 2023 budget through increased performance expectations
Page 56–76
2023 Budget challenges – Legislated increases to labour costs
- Legislated changes to employee sick and statutory holiday pay
- Resulted in increased auxiliary staffing costs
- 5 days of paid sick time – 2% or $65,000
- Statutory holiday pay for those not working the holiday if qualify – 1% or $32,500
- The 2023 Budget addresses these through fee increases
Page 56–76
2023 Budget challenges – Regional wage increases
- Regionally CUPE received an 11% wage increase over 3 years
- Our agreement for 2023 includes a 2% wage increase, thus we will be 5% behind the region for going into 2024
- In preparation for our next round of negotiations, the 2023 budget includes a wage contingency
Page 56–76
2023 Budget challenges – High inflation rates
- With the 7-8% inflation that the economy is experiencing, our operating costs are increasing
- In line with the Board guidance of matching the burden of increasing costs with both taxes and user fees, the management team has decided to combat this with a second fee increase on admissions and programs that was effective January 1st, 2023.
- The 2023 Budget has been developed reflecting the proposed fee increase
Page 56–76
5-Year Financial Plan 2023-2027
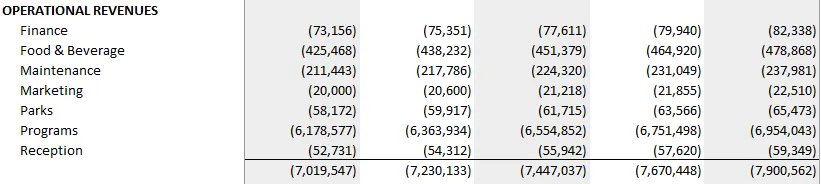
| OPERATIONAL REVENUES | 2023 | 2024 | 2025 | 2026 | 2027 |
|---|---|---|---|---|---|
| Finance | (73,156) | (75,351) | (77,611) | (79,940) | (82,338) |
| Food & Beverage | (425,468) | (438,232) | (451,379) | (464,920) | (478,868) |
| Maintenance | (211,443) | (217,786) | (224,320) | (231,049) | (237,981) |
| Marketing | (20,000) | (20,600) | (21,218) | (21,855) | (22,510) |
| Parks | (58,172) | (59,917) | (61,715) | (63,566) | (65,473) |
| Programs | (6,178,577) | (6,363,934) | (6,554,852) | (6,751,498) | (6,954,043) |
| Reception | (52,731) | (54,312) | (55,942) | (57,620) | (59,349) |
| Total | (7,019,547) | (7,230,133) | (7,447,037) | (7,670,448) | (7,900,562) |
- 2023 revenue budget is $851,658 or 13.8% higher than 2022’s $6,167,889
- 3% increase year over year in future years
Page 56–76
5-Year Financial Plan 2023-2027
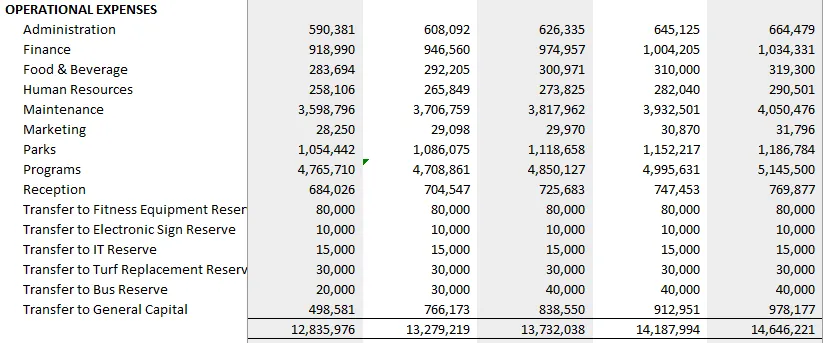
| OPERATIONAL EXPENSES | 2023 | 2024 | 2025 | 2026 | 2027 |
|---|---|---|---|---|---|
| Administration | 590,381 | 608,092 | 626,335 | 645,125 | 664,479 |
| Finance | 918,990 | 946,560 | 974,957 | 1,004,205 | 1,034,331 |
| Food & Beverage | 283,694 | 292,205 | 300,971 | 310,000 | 319,300 |
| Human Resources | 258,106 | 265,849 | 273,825 | 282,040 | 290,501 |
| Maintenance | 3,598,796 | 3,706,759 | 3,817,962 | 3,932,501 | 4,050,476 |
| Marketing | 28,250 | 29,098 | 29,970 | 30,870 | 31,796 |
| Parks | 1,054,442 | 1,086,075 | 1,118,658 | 1,152,217 | 1,186,784 |
| Programs | 4,765,710 | 4,708,861 | 4,850,127 | 4,995,631 | 5,145,500 |
| Reception | 684,026 | 704,547 | 725,683 | 747,453 | 769,877 |
| Transfer to Fitness Equipment Reserve | 80,000 | 80,000 | 80,000 | 80,000 | 80,000 |
| Transfer to Electronic Sign Reserve | 10,000 | 10,000 | 10,000 | 10,000 | 10,000 |
| Transfer to IT Reserve | 15,000 | 15,000 | 15,000 | 15,000 | 15,000 |
| Transfer to Turf Replacement Reserve | 30,000 | 30,000 | 30,000 | 30,000 | 30,000 |
| Transfer to Bus Reserve | 20,000 | 30,000 | 40,000 | 40,000 | 40,000 |
| Transfer to General Capital | 498,581 | 766,173 | 838,550 | 912,951 | 978,177 |
| Total | 12,835,976 | 13,279,219 | 13,732,038 | 14,187,994 | 14,646,221 |
- 2023 expense budget is $919,193 or 7.7% higher than 2022’s $11,916,783
- 3% increase year over year in future years
Page 56–76
2023 Major Expense Increases
- Non-discretionary - $234,816
- 2% wage increase $103,619 for regular staff and $45,348 for Auxiliaries
- Utility Increase - $40,982
- Insurance - $44,867
- Discretionary - $226,363
- Addition of 3 Team Lead positions in ASC that require Class 4 driver’s licenses – allow for managing the program and consistency in drivers - $30,000
- 1.76% of wages added to contingency to insulate us as we fall behind on wage increases $136,363
- $60,000 annual transfer to capital reserve as per direction provided at the Fall 2021 owners meeting
- Overall, the total expense increase is $461,179. We increased our fees, program offerings and performance expectations for $184,131.
- A requisition increase of $277,048 to compensate the difference.
Page 56–76
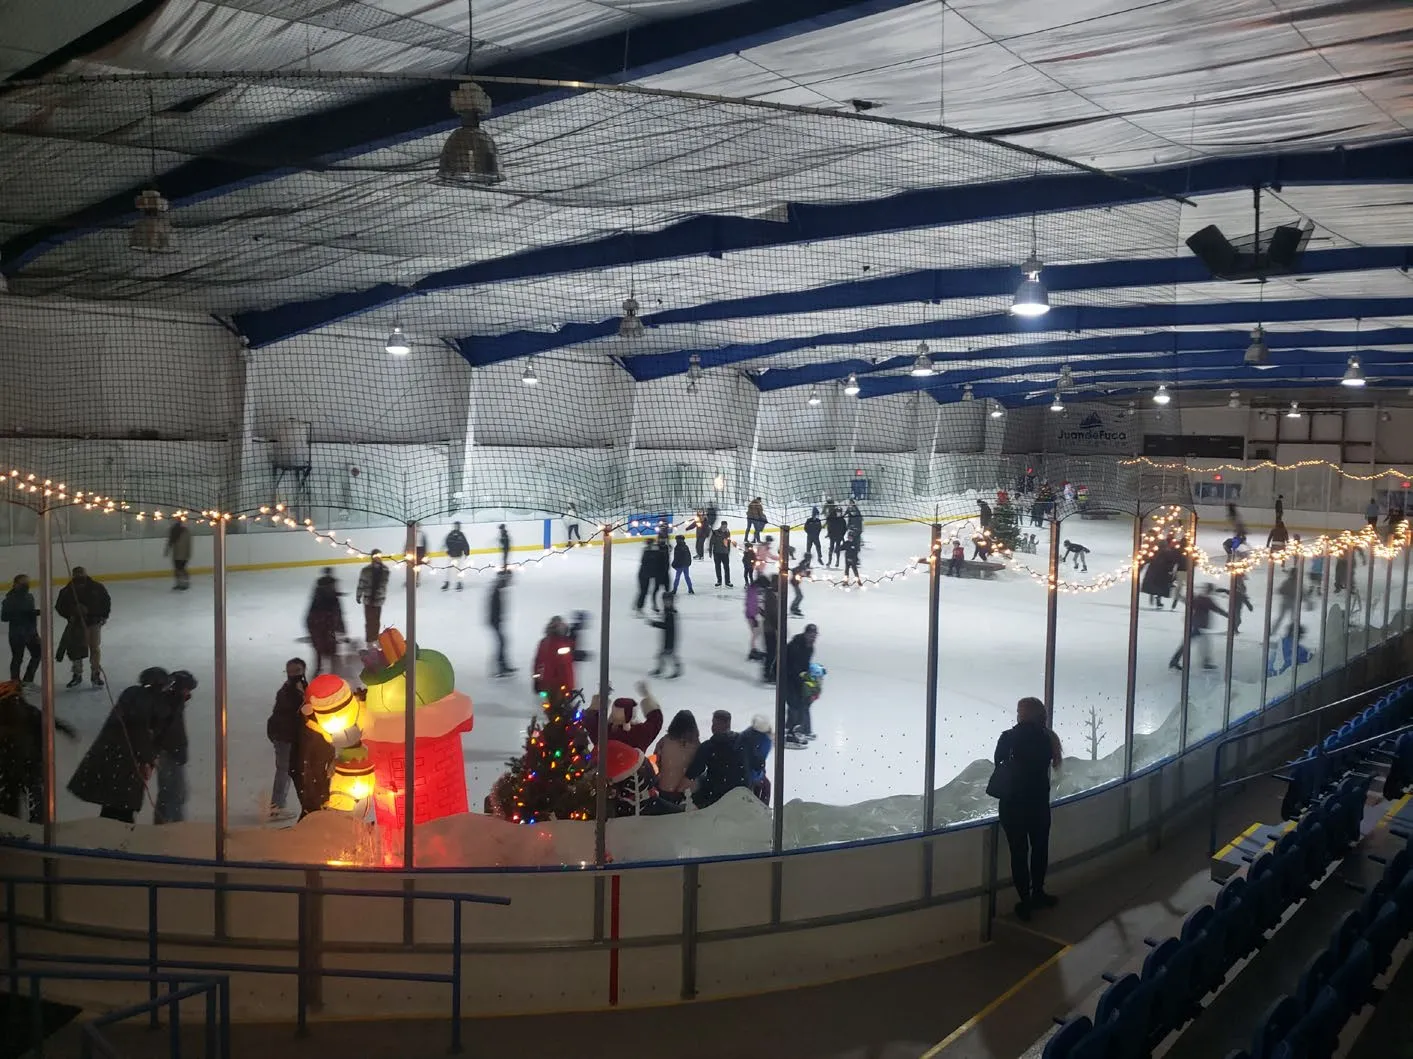
Future Capital Needs
- 2023 Budget includes:
- Feasibility/costing studies
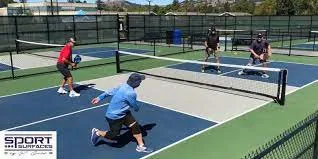
- Outdoor pickleball facility
- Twinning the JDF Arena
- Feasibility/costing studies
Page 56–76
2023 Capital Projects
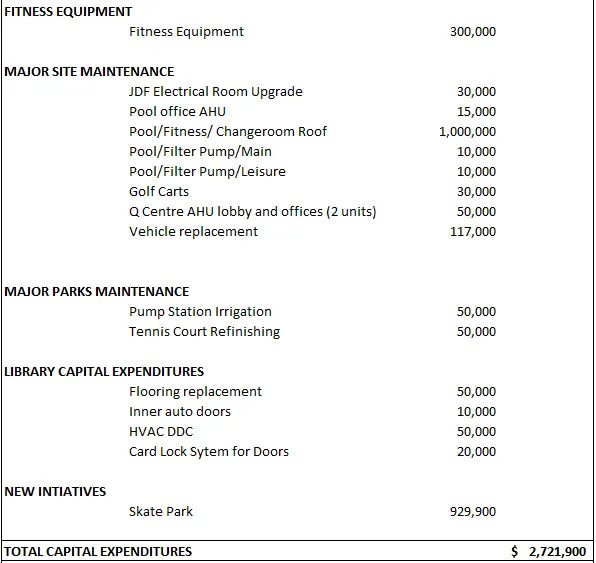
FITNESS EQUIPMENT
| Item | Amount |
|---|---|
| Fitness Equipment | 300,000 |
MAJOR SITE MAINTENANCE
| Item | Amount |
|---|---|
| JDF Electrical Room Upgrade | 30,000 |
| Pool office AHU | 15,000 |
| Pool/Fitness/ Changeroom Roof | 1,000,000 |
| Pool/Filter Pump/Main | 10,000 |
| Pool/Filter Pump/Leisure | 10,000 |
| Golf Carts | 30,000 |
| Q Centre AHU lobby and offices (2 units) | 50,000 |
| Vehicle replacement | 117,000 |
MAJOR PARKS MAINTENANCE
| Item | Amount |
|---|---|
| Pump Station Irrigation | 50,000 |
| Tennis Court Refinishing | 50,000 |
LIBRARY CAPITAL EXPENDITURES
| Item | Amount |
|---|---|
| Flooring replacement | 50,000 |
| Inner auto doors | 10,000 |
| HVAC DDC | 50,000 |
| Card Lock Sytem for Doors | 20,000 |
NEW INITIATIVES
| Item | Amount |
|---|---|
| Skate Park | 929,900 |
TOTAL CAPITAL EXPENDITURES: $ 2,721,900
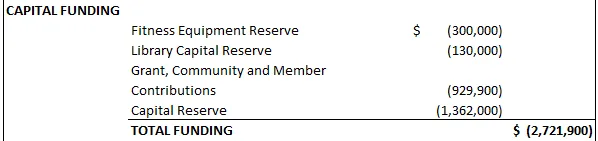
CAPITAL FUNDING
| Source | Amount |
|---|---|
| Fitness Equipment Reserve | $ (300,000) |
| Library Capital Reserve | (130,000) |
| Grant, Community and Member Contributions | (929,900) |
| Capital Reserve | (1,362,000) |
| TOTAL FUNDING | $ (2,721,900) |
Page 56–76
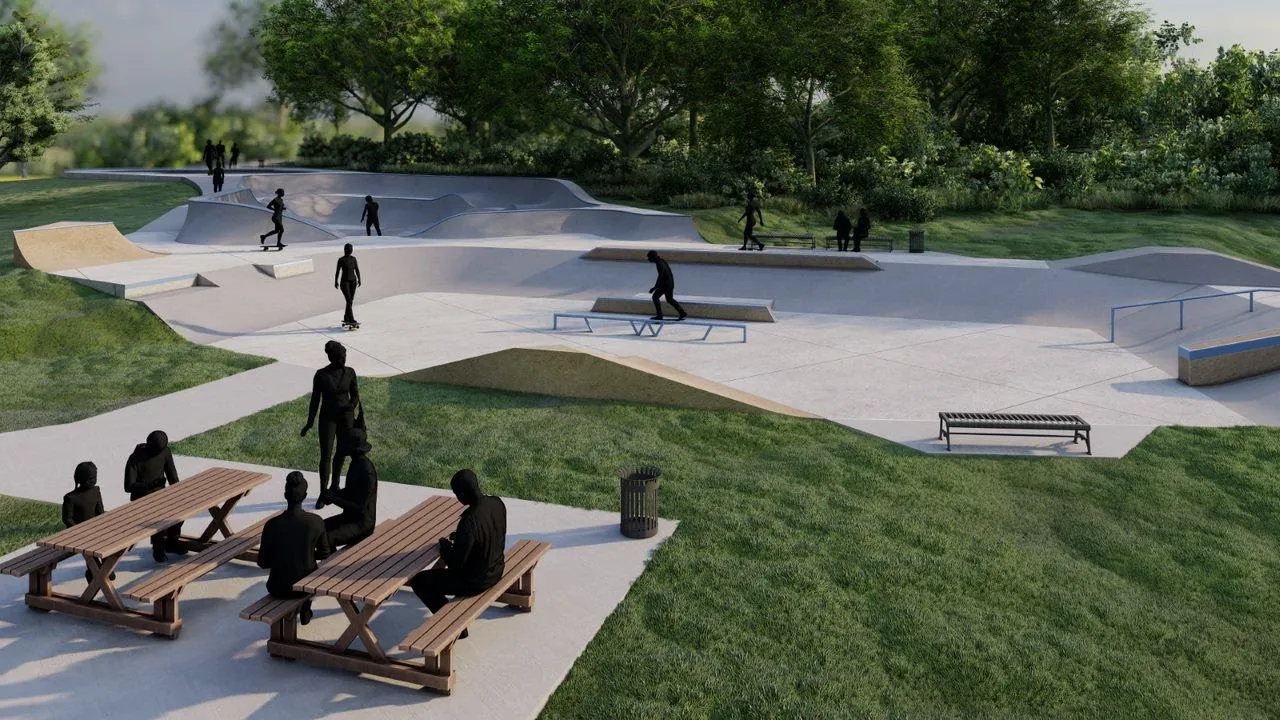
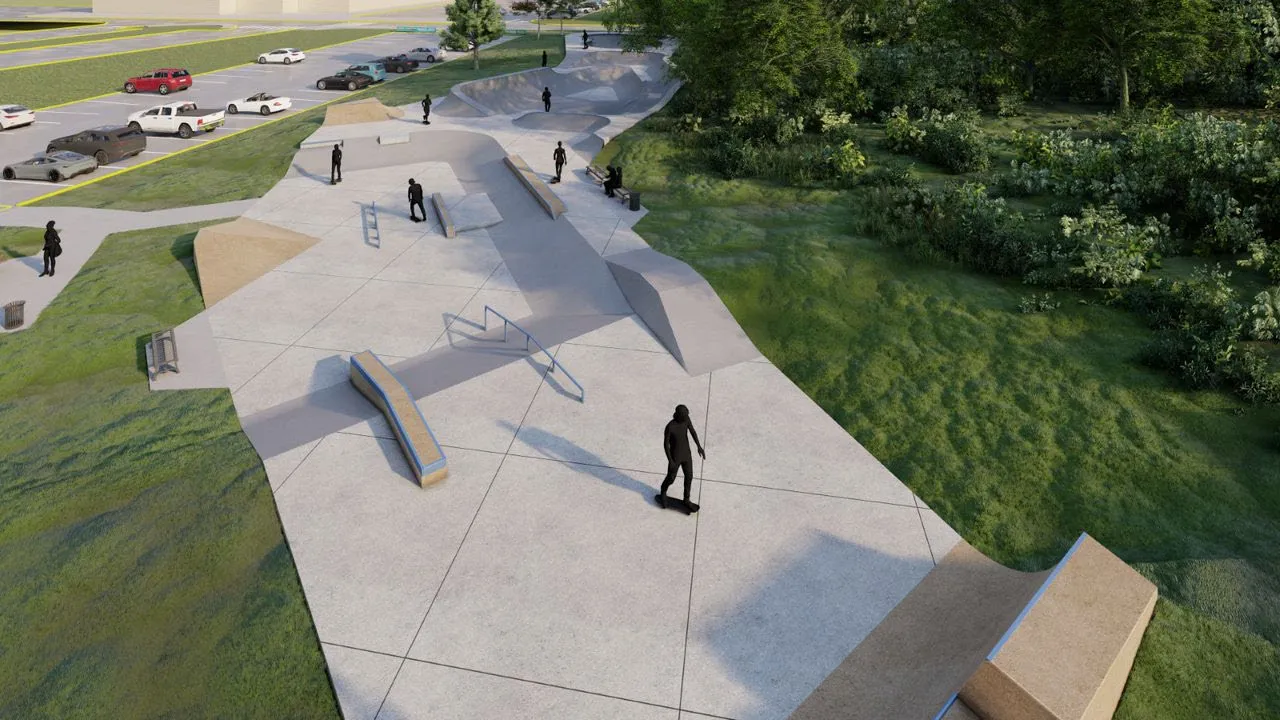
Skatepark Project Update
- Excavation and construction has begun
- Construction expenditure for 2022 is estimated at $350,000 with the remainder in 2023, $929,900.
- Completion March 2023
Page 56–76
Skatepark Project Update – cont.
Page 56–76
Reserve Continuity
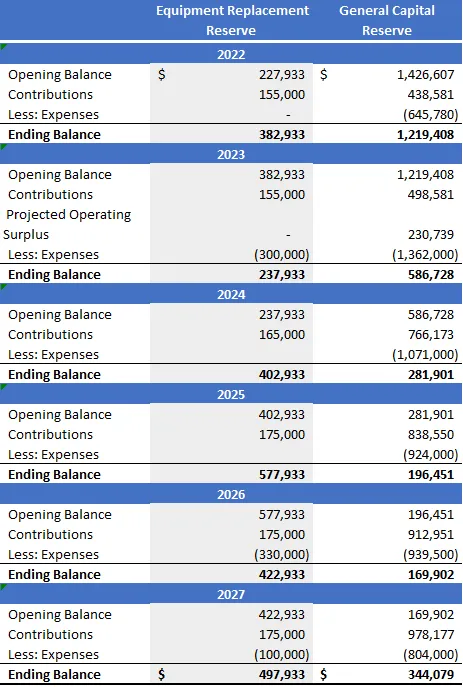
| Year / Description | Equipment Replacement Reserve | General Capital Reserve |
|---|---|---|
| 2022 | ||
| Opening Balance | $ 227,933 | $ 1,426,607 |
| Contributions | 155,000 | 438,581 |
| Less: Expenses | - | (645,780) |
| Ending Balance | 382,933 | 1,219,408 |
| 2023 | ||
| Opening Balance | 382,933 | 1,219,408 |
| Contributions | 155,000 | 498,581 |
| Projected Operating Surplus | - | 230,739 |
| Less: Expenses | (300,000) | (1,362,000) |
| Ending Balance | 237,933 | 586,728 |
| 2024 | ||
| Opening Balance | 237,933 | 586,728 |
| Contributions | 165,000 | 766,173 |
| Less: Expenses | - | (1,071,000) |
| Ending Balance | 402,933 | 281,901 |
| 2025 | ||
| Opening Balance | 402,933 | 281,901 |
| Contributions | 175,000 | 838,550 |
| Less: Expenses | - | (924,000) |
| Ending Balance | 577,933 | 196,451 |
| 2026 | ||
| Opening Balance | 577,933 | 196,451 |
| Contributions | 175,000 | 912,951 |
| Less: Expenses | (330,000) | (939,500) |
| Ending Balance | 422,933 | 169,902 |
| 2027 | ||
| Opening Balance | 422,933 | 169,902 |
| Contributions | 175,000 | 978,177 |
| Less: Expenses | (100,000) | (804,000) |
| Ending Balance | $ 497,933 | $ 344,079 |
Page 56–76
Converted Assessments
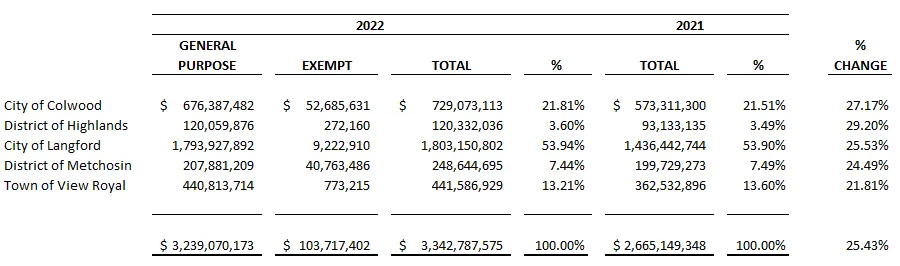
| 2022 | 2021 | |||||
|---|---|---|---|---|---|---|
| GENERAL PURPOSE | EXEMPT | TOTAL | % | TOTAL | % | |
| City of Colwood | $ 676,387,482 | $ 52,685,631 | $ 729,073,113 | 21.81% | $ 573,311,300 | 21.51% |
| District of Highlands | 120,059,876 | 272,160 | 120,332,036 | 3.60% | 93,133,135 | 3.49% |
| City of Langford | 1,793,927,892 | 9,222,910 | 1,803,150,802 | 53.94% | 1,436,442,744 | 53.90% |
| District of Metchosin | 207,881,209 | 40,763,486 | 248,644,695 | 7.44% | 199,729,273 | 7.49% |
| Town of View Royal | 440,813,714 | 773,215 | 441,586,929 | 13.21% | 362,532,896 | 13.60% |
| Total | $ 3,239,070,173 | $ 103,717,402 | $ 3,342,787,575 | 100.00% | $ 2,665,149,348 | 100.00% |
Page 56–76
2023 Requisition
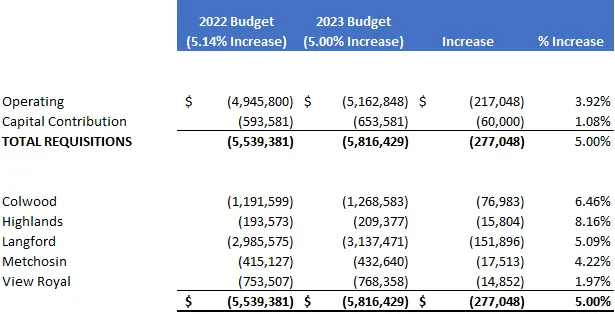
| 2022 Budget (5.14% Increase) | 2023 Budget (5.00% Increase) | Increase | % Increase | |
|---|---|---|---|---|
| Operating | $ (4,945,800) | $ (5,162,848) | $ (217,048) | 3.92% |
| Capital Contribution | (593,581) | (653,581) | (60,000) | 1.08% |
| TOTAL REQUISITIONS | (5,539,381) | (5,816,429) | (277,048) | 5.00% |
| Colwood | (1,191,599) | (1,268,583) | (76,983) | 6.46% |
| Highlands | (193,573) | (209,377) | (15,804) | 8.16% |
| Langford | (2,985,575) | (3,137,471) | (151,896) | 5.09% |
| Metchosin | (415,127) | (432,640) | (17,513) | 4.22% |
| View Royal | (753,507) | (768,358) | (14,852) | 1.97% |
| $ (5,539,381) | $ (5,816,429) | $ (277,048) | 5.00% |
- $277,048 or 5% increase proposed for 2023
- 3.9% or $217,048 for operating
- 1.1% or $60,000 for additional annual capital reserve contribution requested by owners
Page 56–76
2023 Estimated Taxation Impact
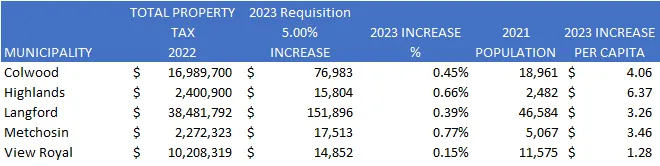
| MUNICIPALITY | TOTAL PROPERTY TAX 2022 | 2023 Requisition 5.00% INCREASE | 2023 INCREASE % | 2021 POPULATION | 2023 INCREASE PER CAPITA |
|---|---|---|---|---|---|
| Colwood | $ 16,989,700 | $ 76,983 | 0.45% | 18,961 | $ 4.06 |
| Highlands | $ 2,400,900 | $ 15,804 | 0.66% | 2,482 | $ 6.37 |
| Langford | $ 38,481,792 | $ 151,896 | 0.39% | 46,584 | $ 3.26 |
| Metchosin | $ 2,272,323 | $ 17,513 | 0.77% | 5,067 | $ 3.46 |
| View Royal | $ 10,208,319 | $ 14,852 | 0.15% | 11,575 | $ 1.28 |
Reference Materials
- 2021 Canadian Census
- 2022-2026 Municipal Financial Plans
Page 56–76
Partnership / Engagement with our ownership
[Text: Partnership / Engagement with our ownership]
Page 56–76
Document Images
(3)

Extracted from: 2023 02 14 Committee of the Whole Agenda - Agenda - Pdf