This site is in beta — data may be incomplete and features are still being added.
Committee of the Whole/Documents/TOWN OF VIEW ROYAL PROPOSED 2023-2027 FINANCIAL PLAN PRESENTATION
Presentation

TOWN OF VIEW ROYAL PROPOSED 2023-2027 FINANCIAL PLAN PRESENTATION

February 14, 2023Pages 141–15414 sections

Slide presentation of the town's proposed five-year financial plan, including taxation impact and capital spending summaries.

3 MINUTES OF PREVIOUS MEETINGS, ADOPTION OF
Initial proposed tax increase: 14.4%Value of a 1% tax increase: $100,000Total capital investments: $36.3 million (5-year total)29% of capital spending funded by Casino revenue

TOWN OF VIEW ROYAL PROPOSED 2023-2027 FINANCIAL PLAN

February 14, 2023

Page 141–154

Budget Workshops – Day 1

Purpose

To provide Council with key highlights in the Proposed 2023-2027 Financial Plan

Page 141–154

Financial Plan Orientation Recap

  • Financial planning legislation
  • Financial sustainability
  • Budget development process
  • Budget package orientation
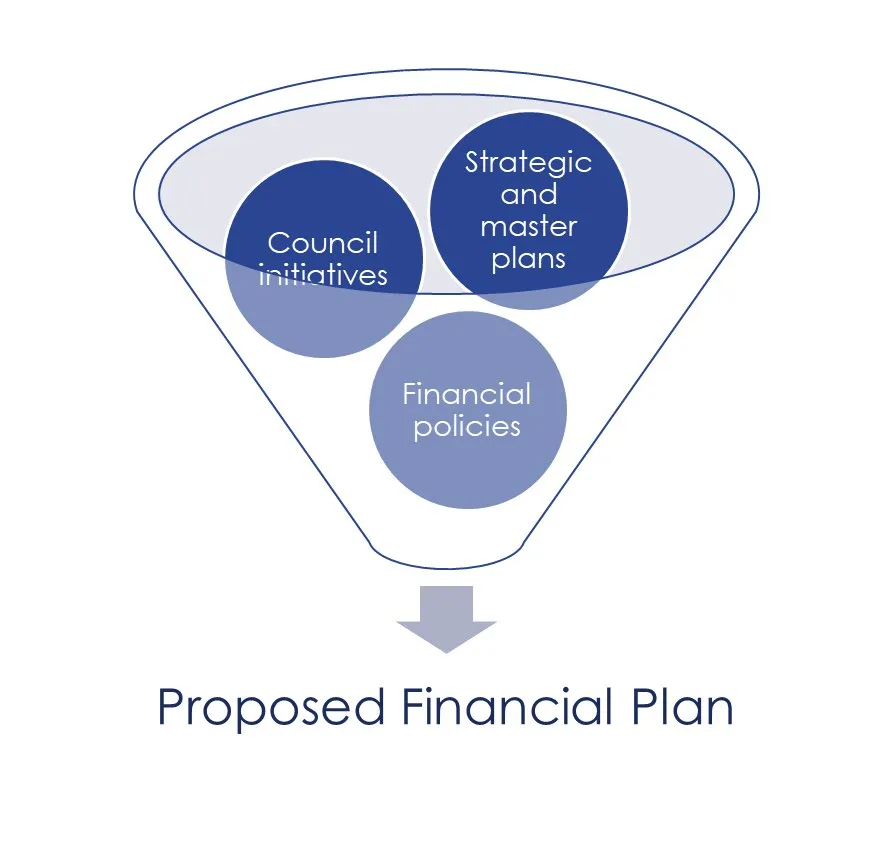
Funnel diagram showing Council initiatives, Strategic and master plans, and Financial policies leading to the Proposed Financial Plan
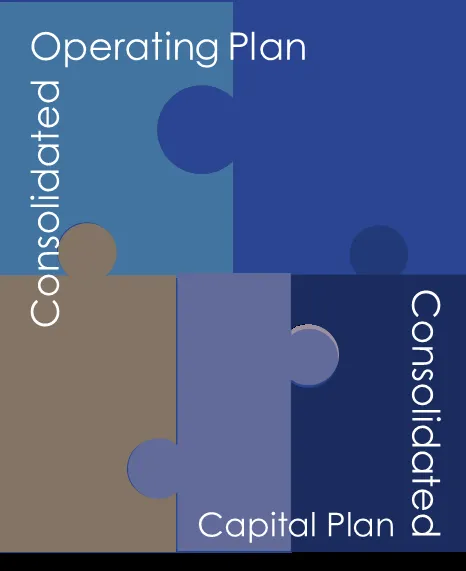
Puzzle diagram showing the relationship between the Consolidated Operating Plan and Consolidated Capital Plan
Graphic icon of a balance scale
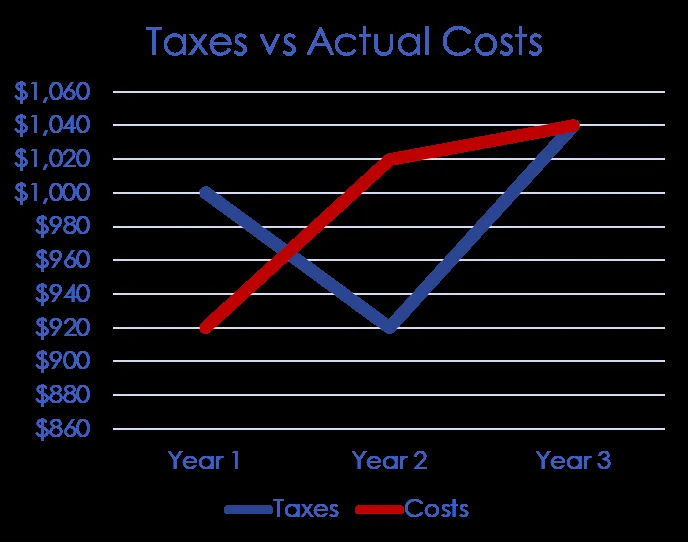
Line chart comparing Taxes vs Actual Costs for Years 1, 2, and 3
Page 141–154

Financial sustainability

Actual and Projected Taxation/User Fees and Operating Expense 2018-2027f

Structural balance is indicated where recurring revenue (taxation and user fees) are used to fund recurring costs (operating expense).

Year Millions
2018 ~$10M (Revenue), ~$12M (Expense)
2019 ~$11M (Revenue), ~$13M (Expense)
2020 ~$12.5M (Revenue), ~$14M (Expense)
2021 ~$13.5M (Revenue), ~$16M (Expense)
2022f ~$14.5M (Revenue), ~$18M (Expense)
2023f ~$16M (Revenue), ~$18M (Expense)
2024f ~$17M (Revenue), ~$19M (Expense)
2025f ~$19M (Revenue), ~$21M (Expense)
2026f ~$20M (Revenue), ~$22M (Expense)
2027f ~$20.5M (Revenue), ~$22.5M (Expense)
Page 141–154

Financial sustainability

How much surplus do we have? How much do we need?

Accumulated Surplus

Year Actual/Projected (Millions)
2018 ~$4M
2019 ~$4.5M
2020 ~$4.8M
2021 ~$5M
2022f ~$5.2M
2023f ~$5.2M
2024f ~$5.2M
2025f ~$5.2M
2026f ~$5.2M
2027f ~$5.2M

High range projects up to ~$7M by 2027f; Low range projects up to ~$3.5M by 2027f.

Page 141–154

Assessments

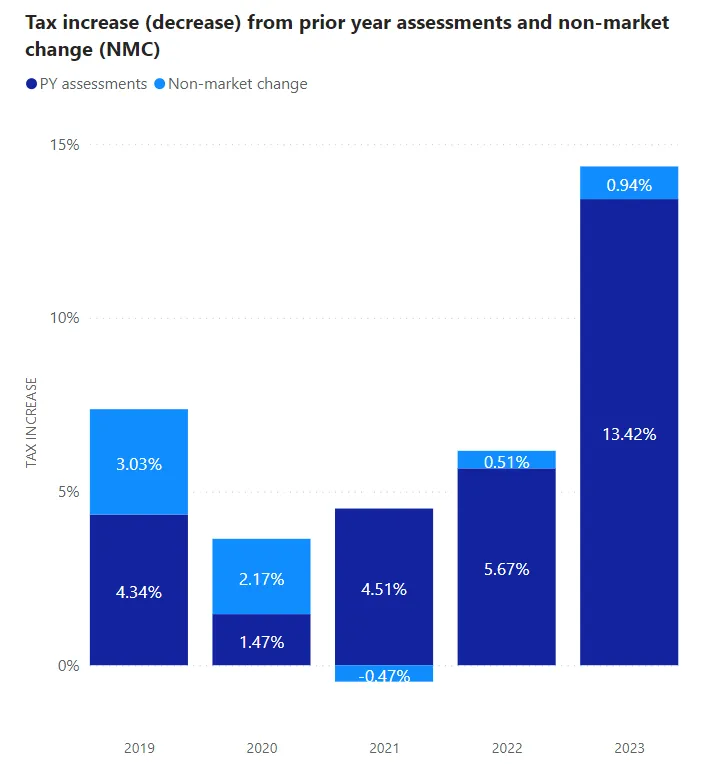
  • Tax increase if budget is approved “as is”: 14.4%
  • 2023 tax revenue increase due to non-market change: 0.94%
  • Value of 1% tax increase in 2023: $100,000
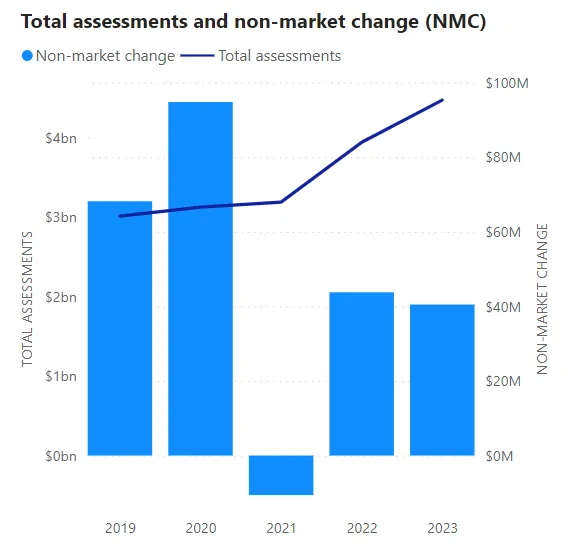
Chart showing Total assessments and non-market change (NMC) from 2019 to 2023
Stacked bar chart showing Tax increase (decrease) from prior year assessments and non-market change (NMC) from 2019 to 2023
Page 141–154

Operating Revenue

  • Operating revenue: $20 M (2023 total) ↑ $3.2 M
  • Non-tax operating revenue: $9 M (2023 total) ↑ $1.8 M
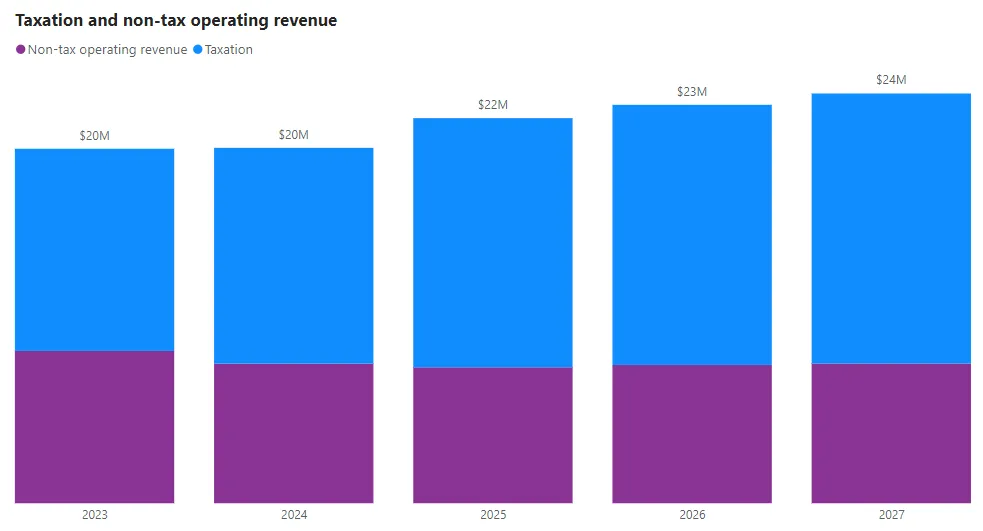
Stacked bar chart showing projected Taxation and non-tax operating revenue from 2023 to 2027

Reference: Page 22 Schedule 1.2 Consolidated Operating Financial Plan

Page 141–154

Operating Revenue

  • Sewer user fees (based on similar consumption): 1%-2% annual increase
  • Garbage user fees:
    • 2023: $25-30
    • 2023-2027: 2-5% annual increase
  • Government grants and transfers: $3 M (2023 total) ↑ $0.6 M
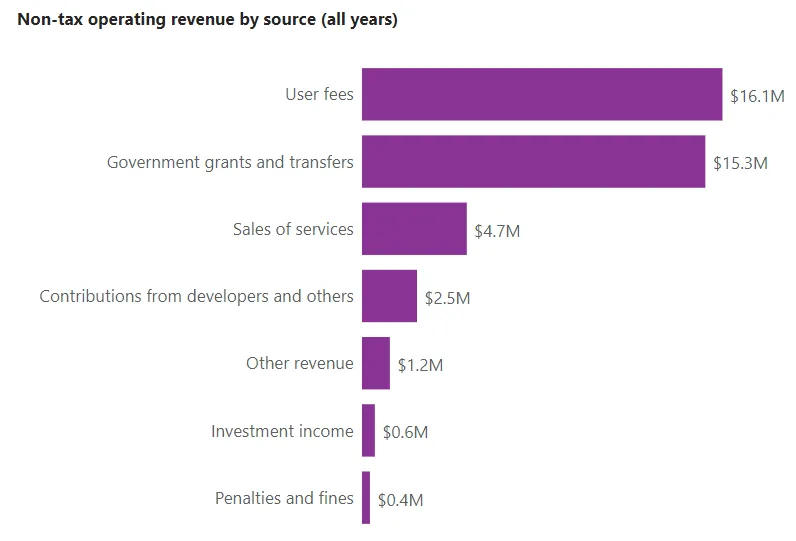
Horizontal bar chart showing Non-tax operating revenue by source for all years

Reference: Page 22 Schedule 1.2 Consolidated Operating Financial Plan

Page 141–154

Operating Expense

  • Operating expenses: $19 M (Average annual)
  • Non-core requests: $5.7 M (5-year total)
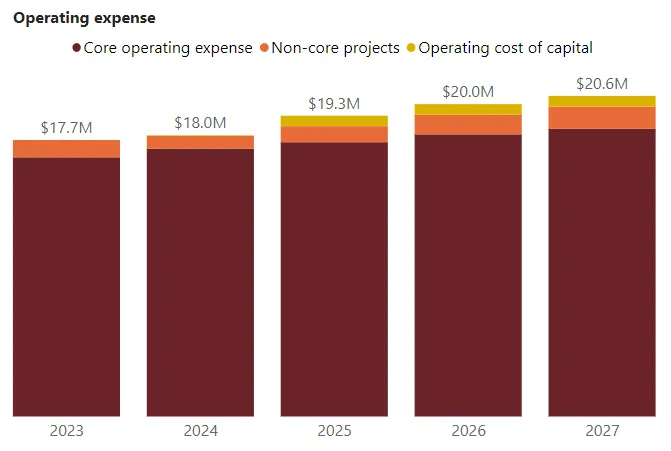
Stacked bar chart showing projected Operating expense components (Core, Non-core, and Operating cost of capital) from 2023 to 2027

Reference: Page 23 Schedule 1.2 Consolidated Operating Financial Plan

Page 141–154

Operating Expense

Protective and Transportation Services: 50%
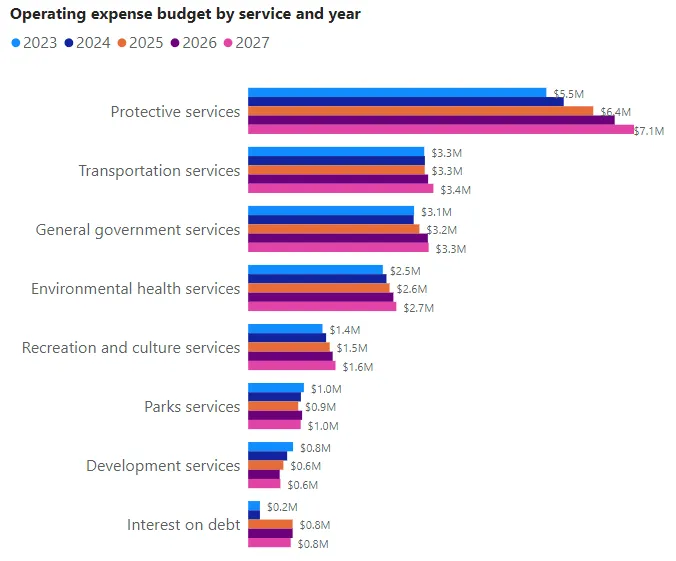
Grouped horizontal bar chart showing the Operating expense budget by service and year (2023-2027)

Reference: Page 23 Schedule 1.2 Consolidated Operating Financial Plan

Page 141–154

Capital Spending

  • Capital investments: $36.3 M (5-year total)
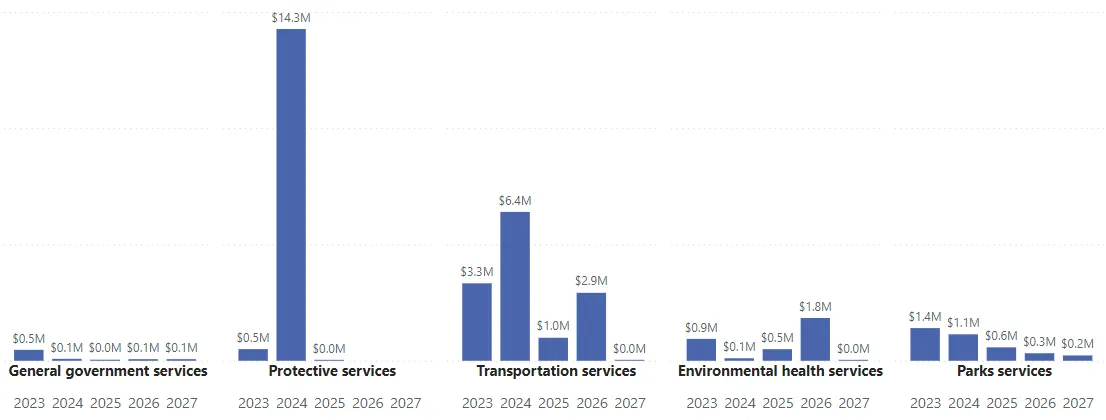
Grouped bar chart showing projected Capital Spending by service area from 2023 to 2027

Reference: Page 24 Schedule 1.3 Consolidated Capital Financial Plan

Page 141–154

Capital Funding

Total capital spending funded by Casino revenue and Community Works Fund: 29%
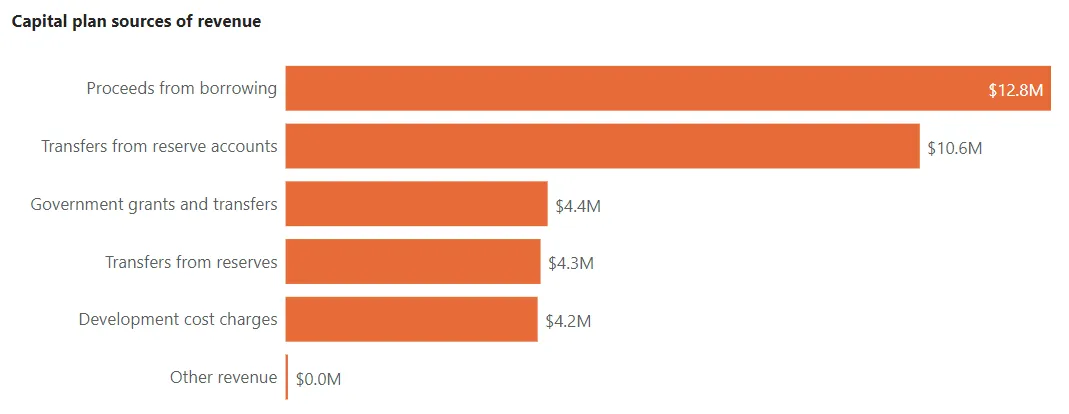
Horizontal bar chart showing Capital plan sources of revenue

Reference: Page 24 Schedule 1.3 Consolidated Capital Financial Plan

Page 141–154

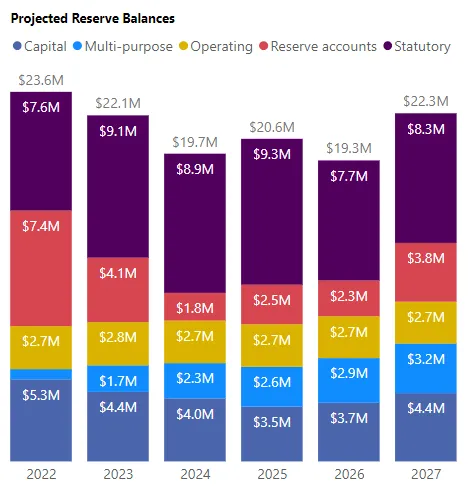
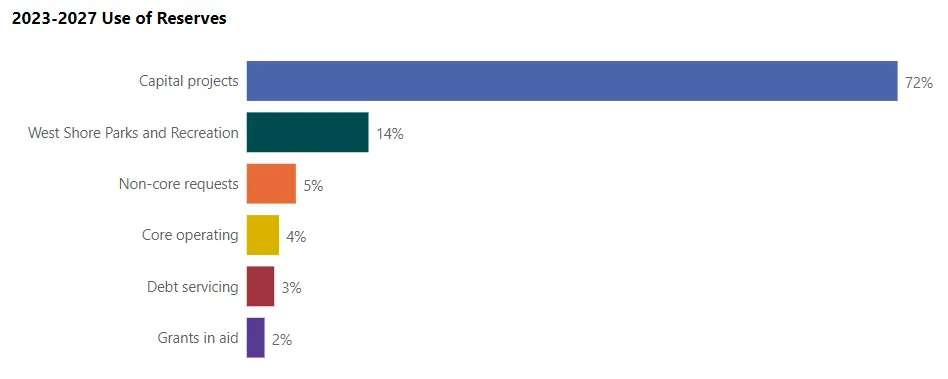
Reserves

  • Funding for operations: $7.2 M
  • Funding for capital: $19.1 M
  • 5-year net change: - $1.4 M
Stacked bar chart showing Projected Reserve Balances from 2022 to 2027
Horizontal bar chart showing the intended Use of Reserves for 2023-2027

Reference: Page 43 Schedule 4 Projected Reserve Balances

Page 141–154

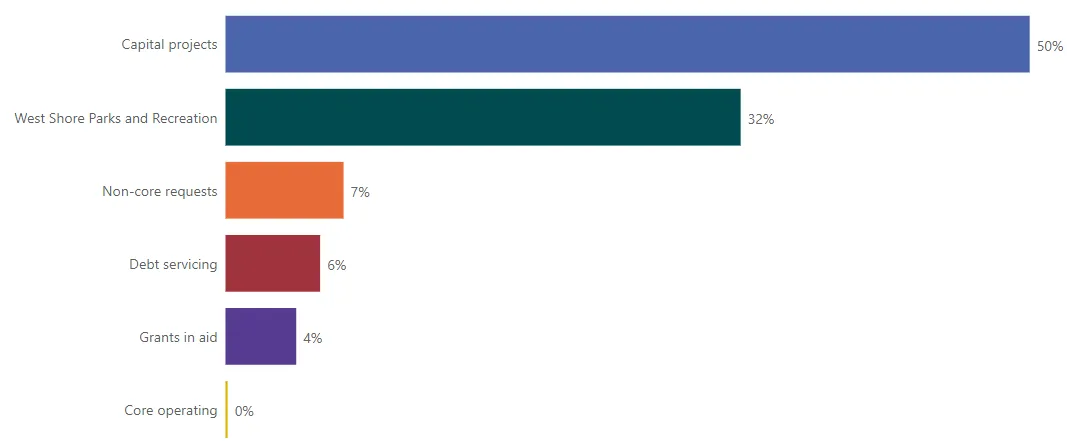
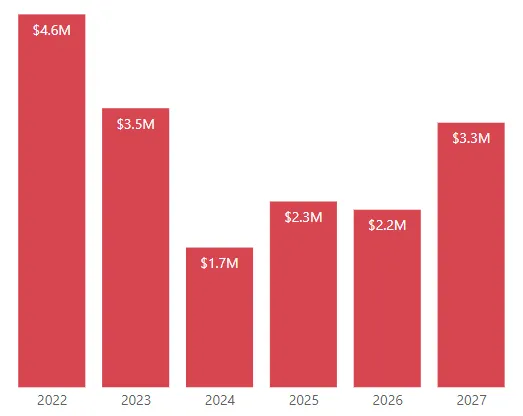
Reserves

Use of Casino reserve

  • 5-year net change: - $1.34 M
Horizontal bar chart showing the intended Use of Casino reserve for 2023-2027
Bar chart showing projected Casino reserve annual balances from 2022 to 2027

Reference: Page 45 Schedule 4 Projected Reserve Balances

Page 141–154

Document Images

(1)
Document image
Extracted from: 2023 02 14 Committee of the Whole Agenda - Agenda - Pdf