9 Erskine Lane Traffic Impact Assessment
A technical report by Watt Consulting Group assessing the traffic implications of a proposed 336-unit multi-family development at 9 Erskine Lane.
4.5 New Site Traffic Volumes
4.5.1 New Site Trip Generation
The proposed site includes 336 multi-family residential units. Vehicular trip generation rates for the proposed development are based on the Institute of Transportation Engineers (ITE) Trip Generation Manual (11th Edition). The trip generation forecast is summarized in Table 6.
Table 6 – Vehicle Trip Generation Rates
| ITE Trip Generation Manual 11th Edition Rates | AM | AM | AM | PM | PM | PM |
|---|---|---|---|---|---|---|
| Land Use | In | Out | 2-Way | In | Out | 2-Way |
| Multifamily Housing (Mid-Rise) (Not Close to Rail Transit) (LU 221) [1] | 0.09 | 0.28 | 0.37 | 0.24 | 0.15 | 0.39 |
| Vehicular Trip Generation | ||||||
| Land Use | In | Out | 2-Way | In | Out | 2-Way |
| Residential (336 units) | 29 | 95 | 124 | 80 | 51 | 131 |
Notes: 1. Trip rates are per dwelling unit
The proposed development is forecast to generate 255 two-way trips in both the weekday morning and afternoon peak hours.
4.5.2 Trip Distribution and Assignment
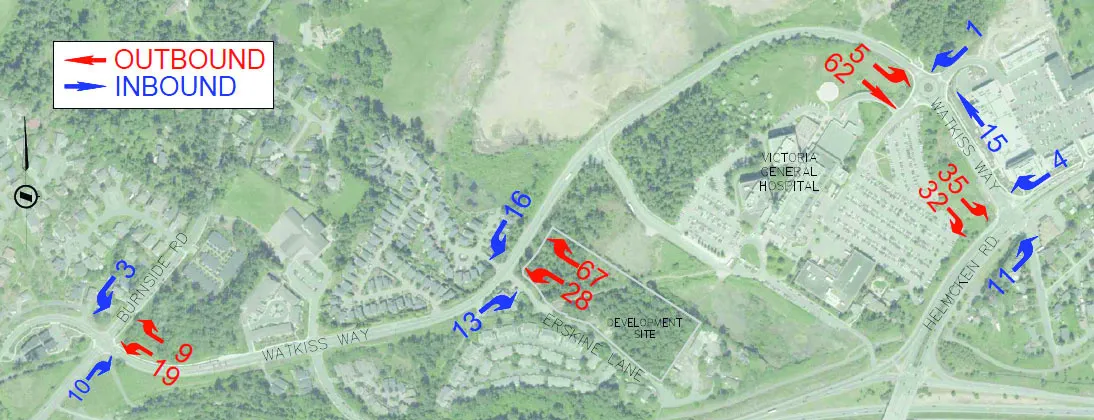
As Erskine Lane dead ends south of the proposed site, all site traffic will use the intersection of Watkiss Way / Erskine Lane. The site trips were assigned based on the existing traffic distributions and consideration of nearby origin / destinations. The distribution of inbound and outbound traffic adopted for the proposed development is outlined in Table 7.
Table 7 – Site Traffic Distribution
| 9 Erskine Lane | Inbound | Inbound | |
|---|---|---|---|
| Total Trips (%) | Total Trips (%) | ||
| Street | Direction | AM | PM |
| Helmcken Road | North | 12 | 12 |
| South | 38 | 38 | |
| Burnside Road | North | 10 | 10 |
| South | 35 | 35 | |
| Eagle Creek Village Access | North | 5 | 5 |
| 9 Erskine Lane | Outbound | Outbound | |
| Street | Direction | AM | PM |
| Helmcken Road | North | 34 | 25 |
| South | 31 | 40 | |
| Burnside Road | North | 10 | 10 |
| South | 20 | 20 | |
| Eagle Creek Village Access | North | 5 | 5 |
The site traffic volumes assigned to the area road network are illustrated in Figure 7 and Figure 8.
Figure 7 - AM Trip Assignment – 9 Erskine Lane
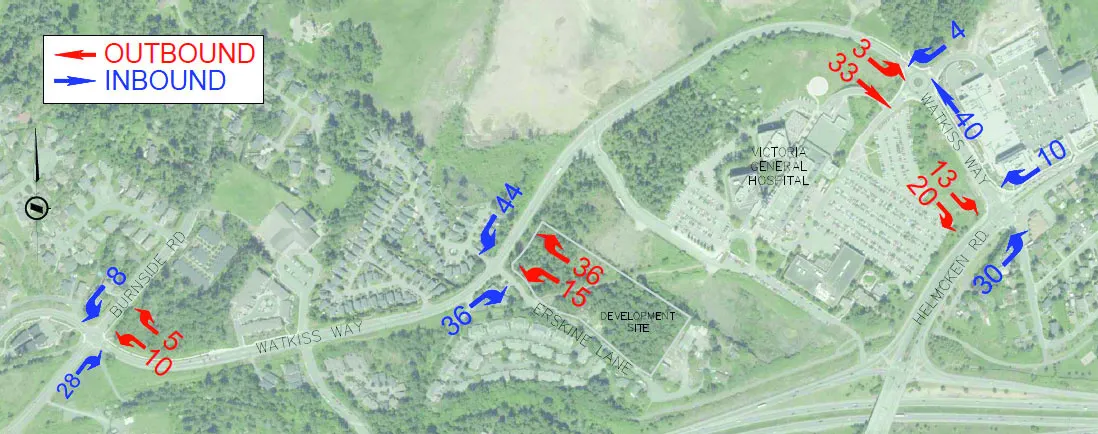
Figure 8 - PM Trip Assignment – 9 Erskine Lane
4.6 2023 Post-Development Traffic Volumes
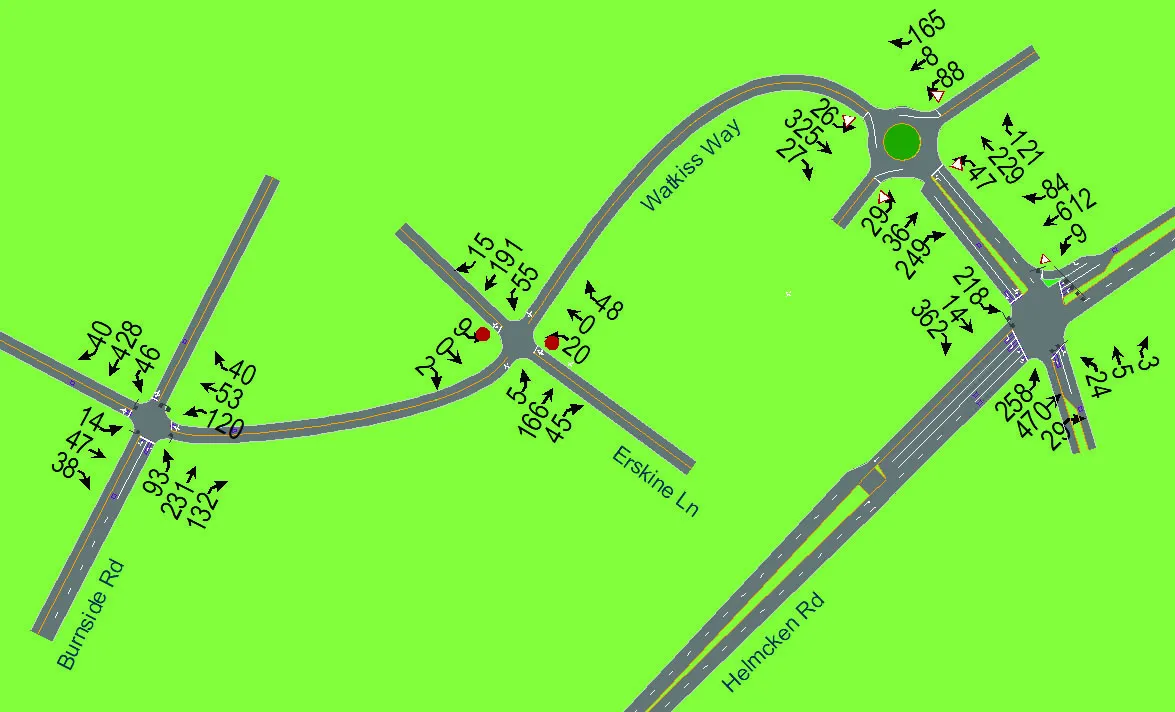
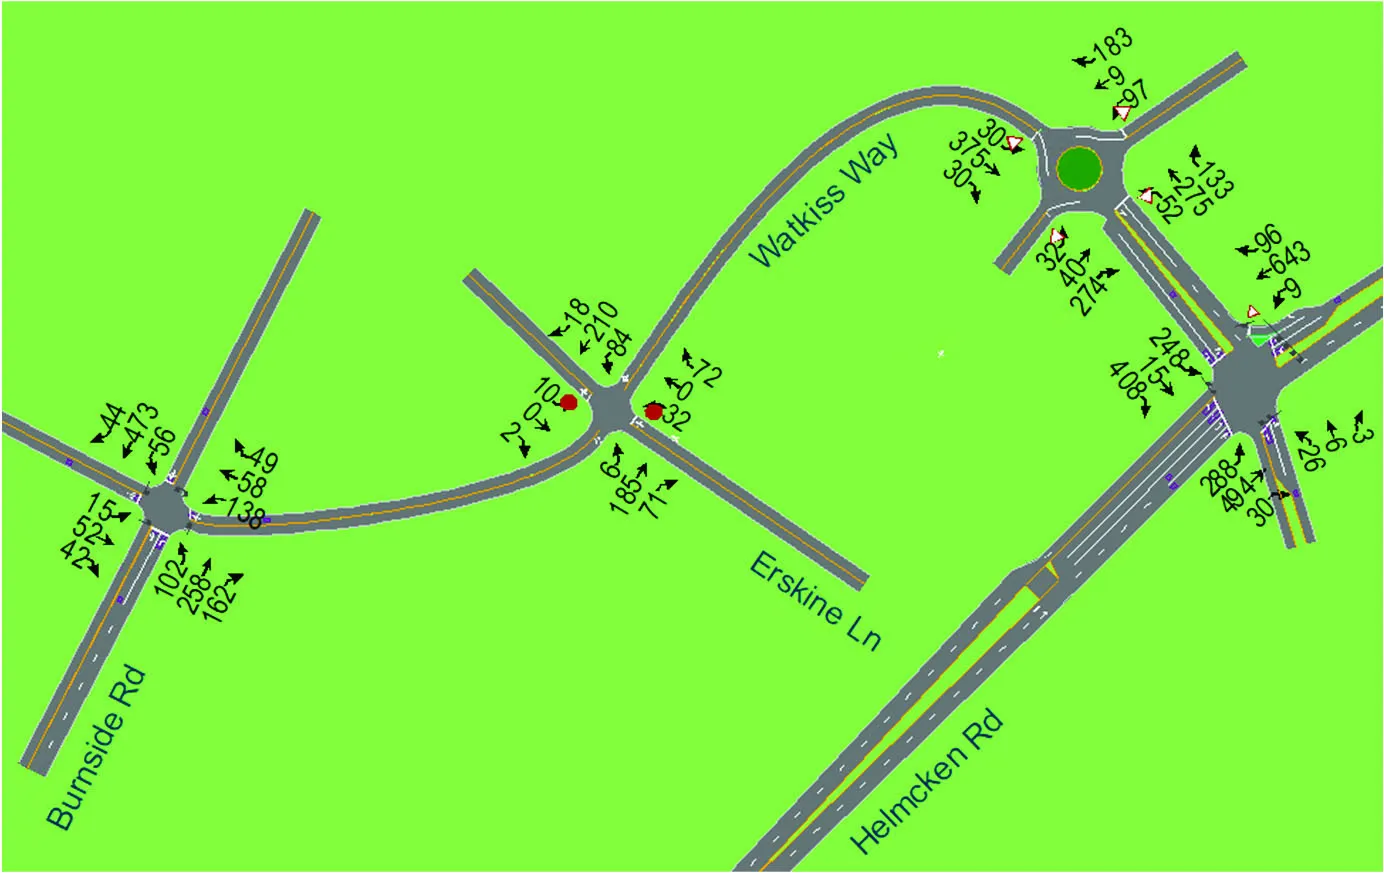
Post-development volumes include the existing 2023 traffic (including the concurrent developments and corridor growth), and the site trips for 9 Erskine Lane. The existing and 9 Erskine Lane traffic volumes are illustrated in Figure 9 and Figure 10.
Figure 9 - Existing and 9 Erskine Lane Traffic Volumes – AM
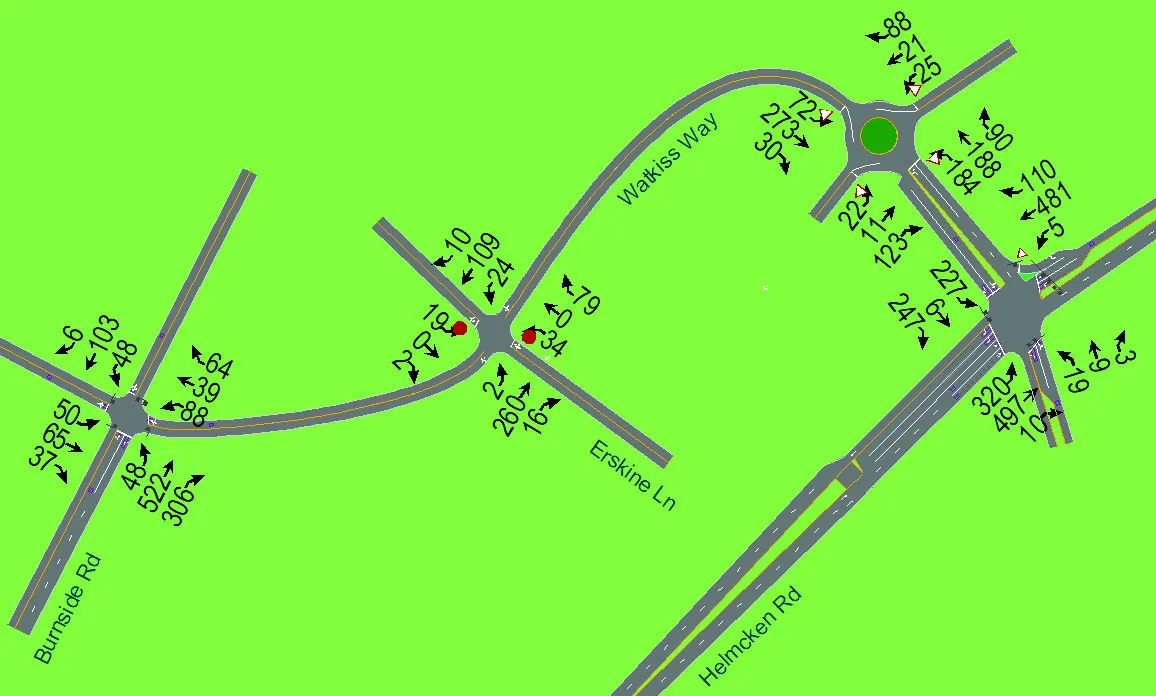
Figure 10 - Existing and 9 Erskine Lane Traffic Volumes – PM
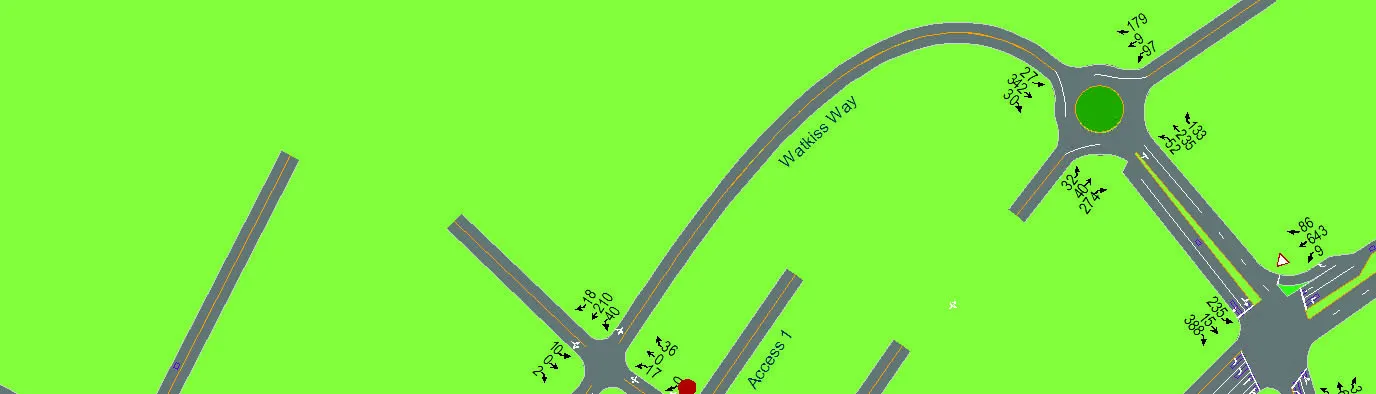
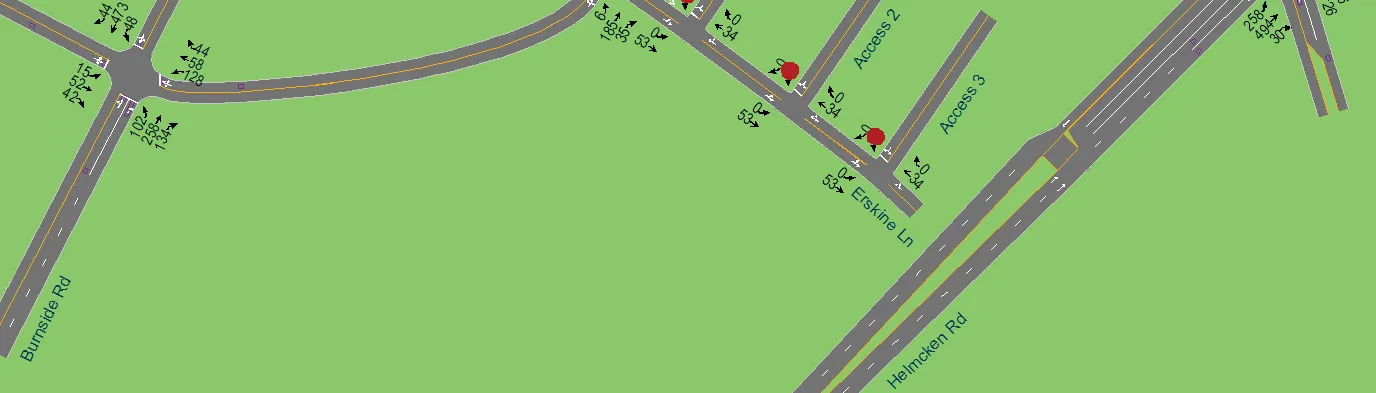
4.7 Background Horizon Year 2033 Traffic Volumes
Background horizon year 2033 traffic volumes are the sum of the existing traffic volumes, concurrent developments, and corridor growth. Background horizon year 2033 traffic volumes are illustrated in Figure 11 and Figure 12.
Figure 11 – Background 2033 Traffic Volumes – AM
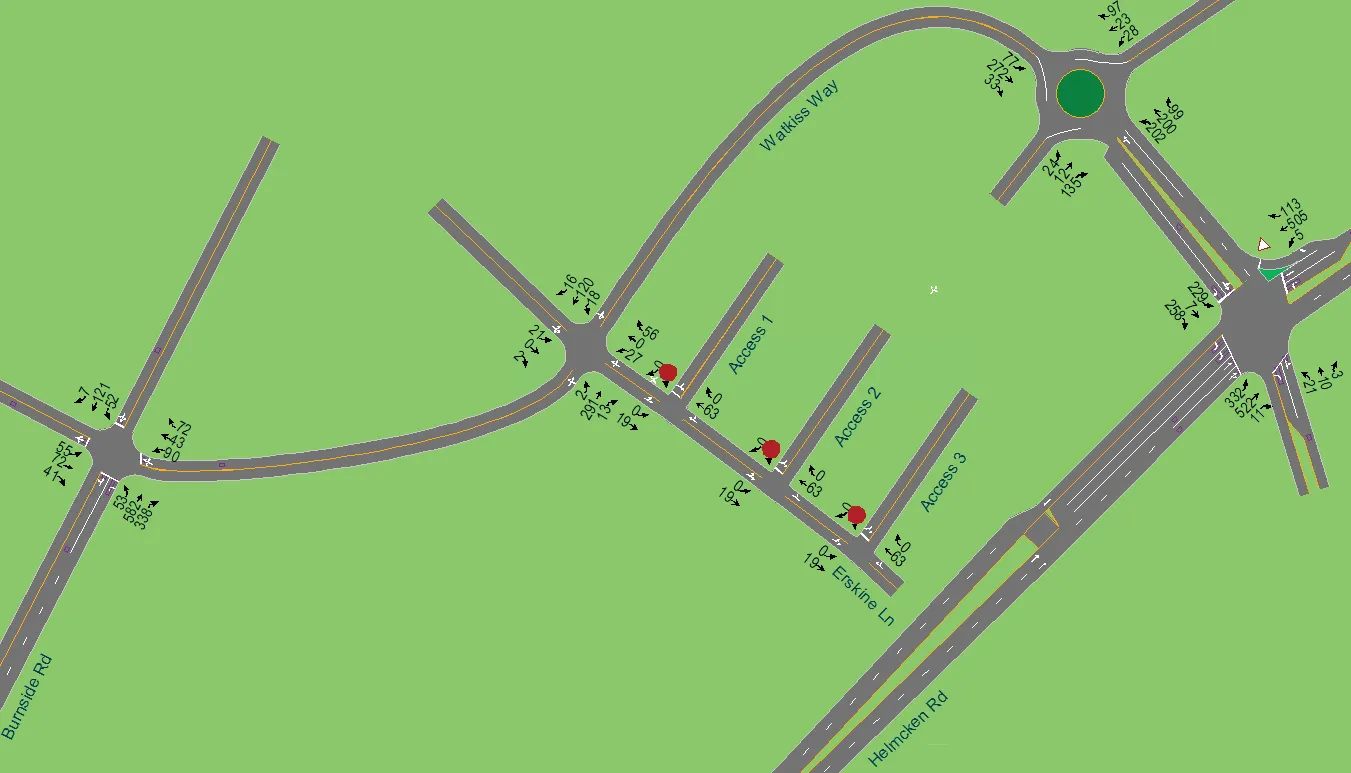
Figure 12 – Background 2033 Traffic Volumes – PM
4.8 Full Build Out Post-Development Horizon Year 2033 Traffic Volumes
In order to determine the long-term impact of the proposed development, the 10-year full build out conditions were analyzed. Horizon year 2033 traffic volumes are the sum of the existing traffic volumes, corridor growth, concurrent developments, and the new site traffic volumes. Horizon year 2033 traffic volumes are illustrated in Figure 13 and Figure 14.
Figure 13 - Horizon Year 2033 Traffic Volumes - AM
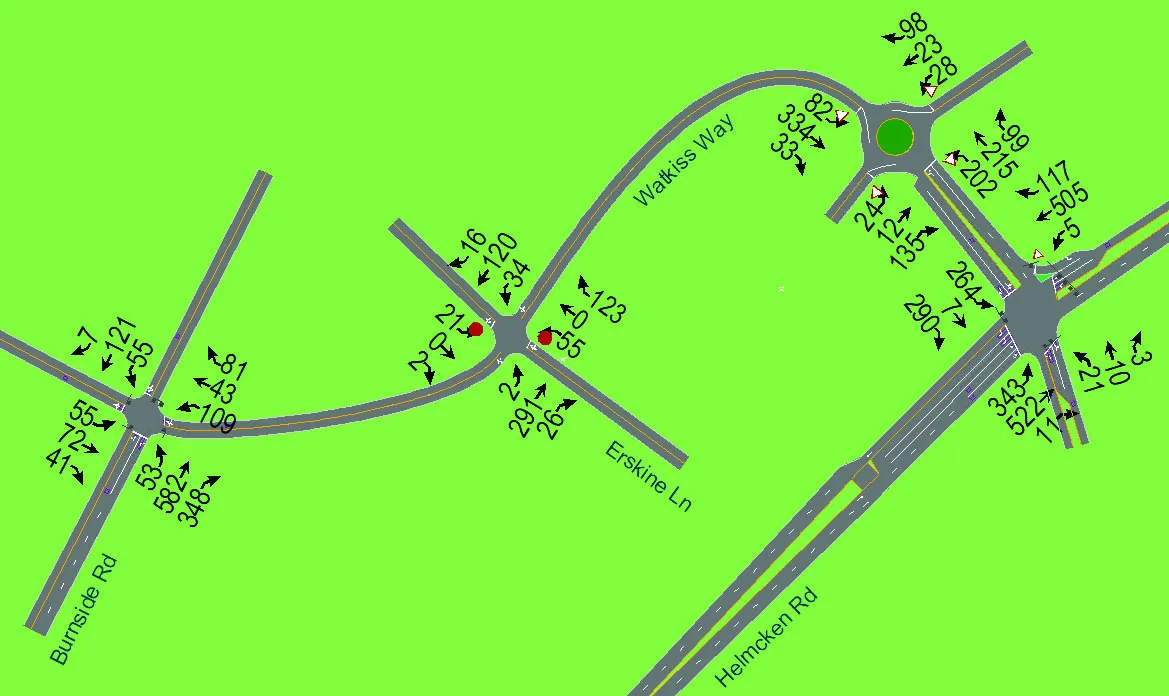
Figure 14 - Horizon Year 2033 Traffic Volumes - PM
5.0 TRANSPORTATION DEMAND MANAGEMENT
Transportation Demand Management (TDM) is the application of strategies and policies to influence the travel choice of an individual, most commonly to reduce single-occupant vehicle travel. TDM measures typically aim to encourage sustainable travel, enhance travel options, and decrease parking demand. The following outlines the TDM measures planned by the developer.
5.1 Electric Bicycles
Electric Bicycles (E-bikes) are an emerging transportation phenomenon that are gaining popularity worldwide. With supportive cycling infrastructure in place, E-bikes have the potential to substitute or completely replace almost all trips taken by combustion engine vehicles which can help to address congestion issues and mitigate parking challenges in urban areas. Two barriers facing prospective E-bike users is the lack of secure parking which is critical for minimizing E-bike theft and cost.
The developer is providing two electrical bicycles to be shared by the complex. Access to electrical bicycles allows residents to experience an e-bicycle without having to outlay the costs which can help to address congestion issues and mitigate parking challenges in urban areas. E-bicycles also support longer commuter trips as well as increase the ability to carry heavier grocery items or other goods.
5.2 Secure Bicycle Parking
Research has reported that bicycle parking supply is a determinant of cycling for current and potential cyclists. A lack of bicycle parking and/or inadequate bicycle parking discourages cycling. Higher quality bicycle parking facilities are associated with more bicycle use. Further, more convenient bicycle parking is also associated with more cycling. Convenience includes easy access to bicycles (e.g., short distances between bicycle parking and actual trip origins or destinations). Secure bicycle parking could especially benefit the residents of this development, with direct access to the Galloping Goose trail.
5.3 Carpooling
An informal rideshare program could be implemented on site that will allow residents to identify if they require a ride or if they can provide a ride. This will be particularly useful for those residents who work in proximity to each other and have similar shifts. An informal program could be implemented internally, with a sign-up sheet in the lobby, or residents can be encouraged to sign up for carpool.ca.
5.4 Carshare
Carsharing is a form of car rental service for the sharing of vehicles for varying lengths of time. Carshares are usually co-operative and require users to register as a member to use vehicles and pay associated fees. An external carshare program could be considered for the site for those residents who may occasionally need access to a vehicle but may not be able to pay the costs associated with vehicle ownership. External carshare programs such as Modo, would not be reserved exclusively for residents at the site, but shared with other Modo members in the area. Although, Modo is not currently operating in View Royal, the developer could facilitate a conversation with Modo Carshare Corporation (the current managing corporation of the carshare program in Victoria) and the Town of View Royal to encourage the program to be expanded to the area. Given the significant population growth in the area (e.g., 5 Erskine Lane, 7 Erskine Lane, 10 Erskine), there may be a growing user base that would benefit from carsharing.
Research has shown that carsharing programs have a significant impact on reducing vehicle ownership, thereby reducing site trips, and lowering parking demand. Currently, there are no Modo vehicles near the site, but the developer is planning to provide two carshare vehicles. At this time, it has not been confirmed if these are going to be shared vehicles for the development or part of Modo.
5.5 TDM Impact on Traffic
This study is based on standard ITE Trip Generation rates and does not account for the potential reduction in vehicle trips due to the planned TDM. The planned TDM along with the proximity / easy access to the Galloping Goose, multiple transit routes heading in all directions, and the Eagle Creek commercial amenities is expected to reduce vehicle trips by at least 10% in the trips generated by this development. This equates to a reduction of 16 vehicles during the peak hours and 55 vehicles per day. Traffic volumes for the study were not adjusted to reflect this, therefore the results of the traffic analysis should be considered minorly conservative.
6.0 TRAFFIC OPERATIONS ANALYSIS
6.1 Methodology
Analysis of the traffic conditions at the intersections within the study area were undertaken using Synchro 11 software (for signalized and stop-controlled intersections). The delays and type of traffic control are used to determine the LOS. The LOS is broken down into six letter grades with LOS A being excellent operations and LOS F being unstable / failure operations. LOS C is generally considered to be an acceptable LOS by most municipalities. LOS D is generally considered to be on the threshold between acceptable and unacceptable operations. A description of LOS and Synchro is provided in Appendix B. The Synchro reports are provided in Appendix C.
6.2 Input and Calibration Parameters
Heavy Vehicle Assumptions Heavy and medium truck percentages incorporated into the analysis were based on intersection turning movement counts. Where not available, a default value of 2 percent heavy vehicles was assumed.
Peak Hour Factor Peak hour factors for each intersection were calculated from the existing traffic count information. Where these values were unavailable, a default peak hour factor of 0.92 was adopted for all movements.
SimTraffic Used for Performance Delay/Vehicle HCM 6th Edition does not support calculations for combined through/left turn movements, which includes two of the intersections in this study that have that laning. In order for all results to use a consistent methodology SimTraffic results were used to determine performance delay at the study intersections.
6.3 Existing Traffic Operations - 2023
Existing conditions were analyzed based on the collected volumes and existing roadway network. A summary of the traffic analysis results for the current condition of the intersections in the study area is provided in Table 8.
Table 8 – Existing Traffic Operations - 2023
| Key Movement | AM | AM | AM | AM | PM | PM | PM | PM |
|---|---|---|---|---|---|---|---|---|
| LOS | Delay (s) | 95th % Queue (m) | v/c | LOS | Delay (s) | 95th % Queue (m) | v/c | |
| Watkiss Way / Erskine Lane / Stoneridge Drive (stop-controlled) | ||||||||
| EB | A | 3.6 | 2 | 0.00 | A | 3.5 | 5 | 0.00 |
| WB | A | 3.5 | 6 | 0.01 | A | 2.6 | 5 | 0.01 |
| NB | A | 5.8 | 11 | 0.03 | A | 6.0 | 12 | 0.03 |
| SB | A | 5.6 | 10 | 0.04 | A | 5.6 | 7 | 0.02 |
| Watkiss Way / Burnside Road W | ||||||||
| EB | B | 13.2 | 27 | 0.41 | B | 10.2 | 19 | 0.22 |
| WB | B | 13.4 | 26 | 0.44 | B | 12.6 | 33 | 0.52 |
| NBTL | A | 10.0 | 64 | 0.54 | B | 17.0 | 50 | 0.40 |
| NBR | A | 3.9 | 30 | 0.29 | A | 2.2 | 16 | 0.11 |
| SB | B | 18.8 | 32 | 0.18 | B | 12.1 | 54 | 0.51 |
| Watkiss Way / Hospital Access / Mall Access | ||||||||
| EB | A | 5.3 | 23 | 0.26 | A | 4.9 | 22 | 0.29 |
| WBTL | A | 6.2 | 36 | 0.30 | A | 5.2 | 26 | 0.21 |
| WBR | A | 3.1 | 2 | 0.30 | A | 2.9 | 2 | 0.21 |
| NB | A | 3.2 | 14 | 0.03 | A | 4.3 | 25 | 0.08 |
| SB | A | 3.8 | 10 | 0.05 | A | 3.8 | 19 | 0.10 |
| Watkiss Way / Helmcken Road / Chancellor Avenue | ||||||||
| EBLT | C | 26.9 | 51 | 0.56 | C | 26.1 | 70 | 0.60 |
| EBR | B | 11.8 | 42 | 0.38 | B | 17.2 | 66 | 0.58 |
| WBL | C | 26.4 | 7 | 0.07 | C | 32.8 | 9 | 0.09 |
| WBTR | C | 26.1 | 4 | 0.02 | B | 12.6 | 2 | 0.02 |
| NBL | F | 95.1 | 97 | 0.64 | D | 46.0 | 46 | 0.57 |
| NBTR | B | 12.4 | 108 | 0.27 | B | 13.1 | 67 | 0.26 |
| SBL | D | 42.1 | 11 | 0.03 | E | 63.1 | 14 | 0.06 |
| SBTR | C | 23.8 | 102 | 0.76 | C | 32.3 | 109 | 0.85 |
Note: ## - Exceeds storage/acceptable limits
The intersections of Watkiss Way / Erskine Lane / Stoneridge Drive, Watkiss Way / Burnside Road W, and Watkiss Way / Hospital Access / Mall Access in both the AM and PM peak hour currently perform at an acceptable Level of Service (LOS), operating at LOS B or better with delays of 19 seconds or less. The 95th percentile queues are acceptable on all movements and the volume to capacity ratio (v/c) ratios for all approaches is 0.54 or less for all movements.
The intersection of Watkiss Way / Helmcken Road / Chancellor Avenue generally functions with an acceptable LOS, except for the northbound left movement in the AM peak hour which operates at a LOS F with a delay of 95 seconds, and the southbound left movement in the PM peak hour, which operates at a LOS E with a delay of 63 seconds. The northbound left movement is a minor movement for the intersection representing approximately 1% of the intersection’s total volume; high delay values on this one movement is not an indication of general poor intersection performance. The 95th percentile queues are acceptable on all movements and the v/c ratios for all approaches is 0.76 or less for all movements.
6.4 2023 Traffic Operations with 9 Erskine Lane Full Build Out
6.4.1 2023 Traffic Operations
A summary of the traffic analysis results for the intersections and site accesses in the study area after 9 Erskine Lane is fully built out are provided in Table 9 and Table 10.
Table 9 – 2023 Post Development Peak Hour Results
| Key Movement | AM | AM | AM | AM | PM | PM | PM | PM |
|---|---|---|---|---|---|---|---|---|
| LOS | Delay (s) | 95th % Queue (m) | v/c | LOS | Delay (s) | 95th % Queue (m) | v/c | |
| Watkiss Way / Erskine Lane / Stoneridge Drive (stop-controlled) | ||||||||
| EB | A | 3.9 | 1 | 0.00 | A | 3.3 | 4 | 0.00 |
| WB | A | 3.7 | 9 | 0.02 | A | 4.0 | 13 | 0.05 |
| NB | A | 6.9 | 16 | 0.20 | A | 6.4 | 13 | 0.12 |
| SB | A | 5.5 | 10 | 0.06 | A | 6.1 | 8 | 0.22 |
| Watkiss Way / Burnside Road W | ||||||||
| EB | B | 12.1 | 27 | 0.40 | B | 10.4 | 21 | 0.22 |
| WB | B | 13.4 | 30 | 0.50 | B | 11.8 | 32 | 0.57 |
| NBTL | A | 9.6 | 55 | 0.54 | B | 17.7 | 50 | 0.45 |
| NBR | A | 3.9 | 28 | 0.30 | A | 2.7 | 19 | 0.16 |
| SB | C | 20.3 | 31 | 0.18 | B | 12.7 | 65 | 0.59 |
| Watkiss Way / Hospital Access / Mall Access | ||||||||
| EB | A | 5.7 | 27 | 0.32 | A | 5.7 | 32 | 0.33 |
| WBTL | A | 5.9 | 36 | 0.31 | A | 5.8 | 31 | 0.25 |
| WBR | A | 3.1 | 0 | 0.31 | A | 3.0 | 1 | 0.25 |
| NB | A | 3.2 | 13 | 0.03 | A | 4.1 | 26 | 0.08 |
| SB | A | 4.4 | 13 | 0.05 | A | 4.3 | 23 | 0.10 |
| Watkiss Way / Helmcken Road / Chancellor Avenue | ||||||||
| EBLT | C | 24.6 | 57 | 0.60 | C | 27.7 | 74 | 0.62 |
| EBR | B | 12.4 | 50 | 0.39 | B | 18.6 | 67 | 0.60 |
| WBL | C | 27.6 | 8 | 0.07 | C | 30.1 | 10 | 0.09 |
| WBTR | C | 22.4 | 4 | 0.02 | C | 20.5 | 2 | 0.02 |
| NBL | F | 132.6 | 106 | 0.70 | E | 57.4 | 58 | 0.64 |
| NBTR | B | 16.2 | 128 | 0.28 | B | 12.9 | 72 | 0.27 |
| SBL | E | 55.4 | 8 | 0.03 | E | 68.8 | 11 | 0.07 |
| SBTR | C | 24.3 | 99 | 0.77 | C | 35.0 | 109 | 0.86 |
Note: ## - Exceeds storage/acceptable limits
Table 10 – 2023 Post Development Peak Hour Results – Site Accesses
| Key Movement | AM | AM | AM | AM | PM | PM | PM | PM |
|---|---|---|---|---|---|---|---|---|
| LOS | Delay (s) | 95th % Queue (m) | v/c | LOS | Delay (s) | 95th % Queue (m) | v/c | |
| Erskine Lane / Access 1 | ||||||||
| WBLR | A | 4.8 | 14 | 0.05 | A | 2.1 | 14 | 0.03 |
| NBTR | A | 1.5 | 0 | 0.03 | A | 0.6 | 0 | 0.02 |
| SBTL | A | 1.5 | 4 | 0.01 | A | 0.8 | 3 | 0.03 |
| Erskine Lane / Access 2 | ||||||||
| WBLR | A | 4.7 | 12 | 0.02 | A | 2.2 | 10 | 0.01 |
| NBTR | A | 1.9 | 0 | 0.01 | A | 0.2 | 0 | 0.01 |
| SBTL | A | 2.4 | 1 | 0.01 | A | 1.4 | 1 | 0.01 |
| Erskine Lane / Access 3 | ||||||||
| WBLR | A | 4.8 | 12 | 0.02 | A | 2.1 | 10 | 0.01 |
| NBTR | A | 0 | 0 | 0.00 | A | 0 | 0 | 0.00 |
| SBTL | A | 2.2 | 0 | 0.00 | A | 1.3 | 0 | 0.01 |
The addition of site traffic post development has small impacts on the network in both the AM and PM peak hours. The intersections of Watkiss Way / Erskine Lane / Stoneridge Drive, sees almost no change with the addition of site traffic, remaining at LOS A for all movements.
Watkiss Way / Burnside Road W, and Watkiss Way / Hospital Access / Mall Access in both the AM and PM peak hour sees a maximum change in delay of 2 seconds or less and maintains LOS C or better on all movements.
The poorly performing movements at Watkiss Way / Helmcken Road / Chancellor Avenue continue to operate poorly in both the AM and PM peak hours. The northbound left movement drops form LOS D to LOS E in the PM peak hour with a delay of 58 seconds, and the southbound left movement drops from LOS d to LOS Ein the AM peak with a delay of 69 seconds.
The 95th percentile queues remain acceptable on all approaches, The v/c ratios for all approaches are 0.77 or less for all movements.
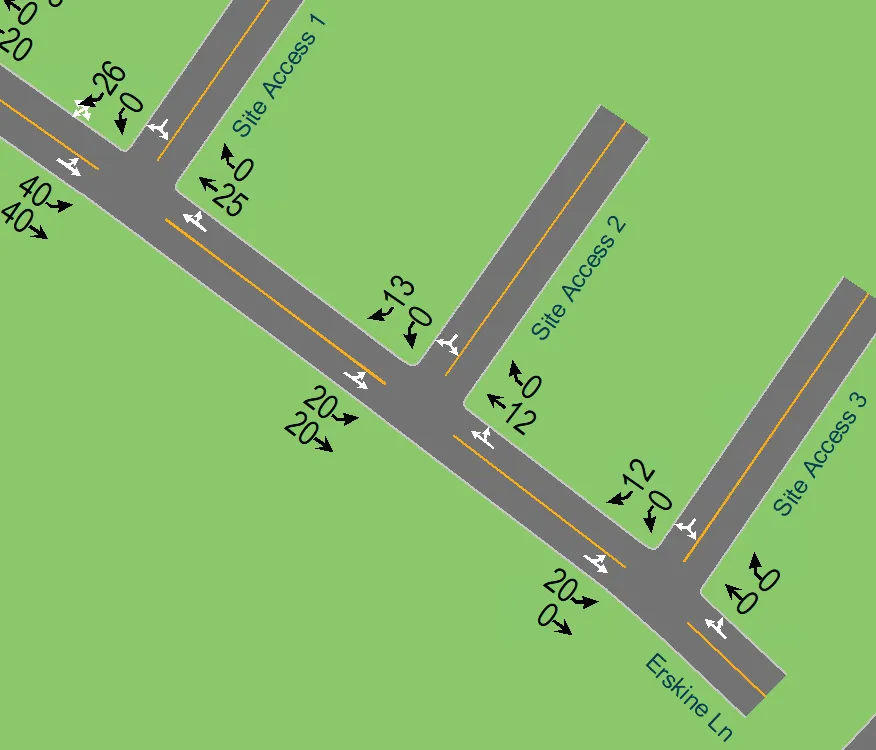
All site accesses operate at LOS A with delays of 5 seconds or less and no queue issues. The v/c ratio for all movements is 0.05 or less. Figure 15 and Figure 16 show the traffic volumes for the AM and PM peak hours in 2023.
Figure 15 – 2023 AM Site Accesses
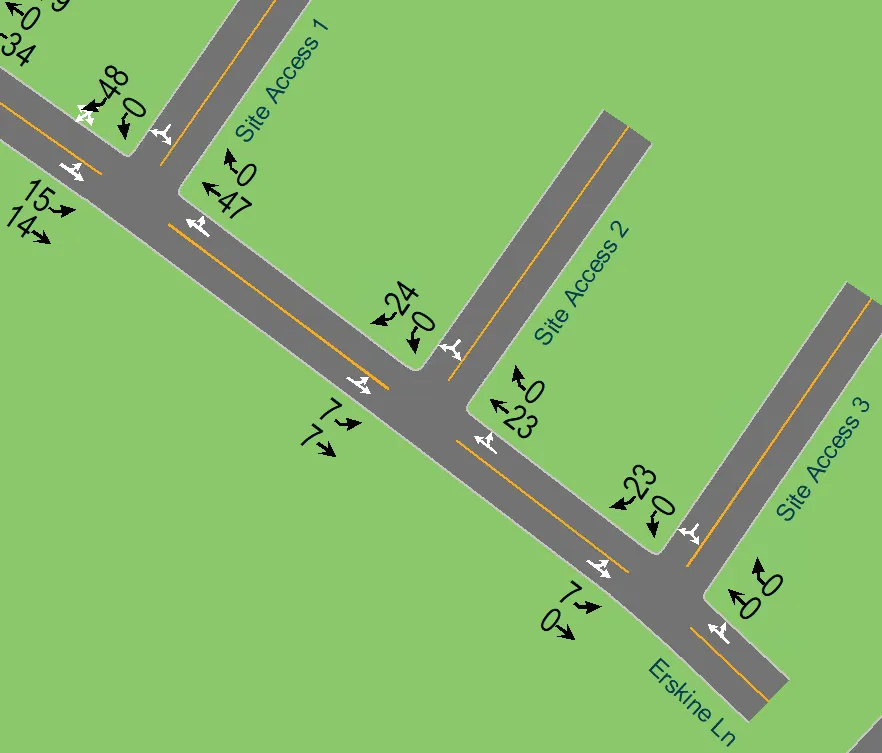
Figure 16 – 2023 PM Site Accesses
6.4.2 Watkiss Way / Erskine Lane / Stoneridge Drive Traffic Operations Change
Even though the Watkiss Way / Erskine Lane / Stoneridge Drive intersection operates at LOS A, WATT was asked to review performance implications for changes in traffic control. A summary of the traffic analysis results with traffic operation changes to either a roundabout or a traffic signal (assumes no dedicated turn lanes) is provided in Table 11.
Table 11 – Traffic Signal vs. Roundabout - 2023
| Key Movement | AM | AM | AM | AM | PM | PM | PM | PM |
|---|---|---|---|---|---|---|---|---|
| LOS | Delay (s) | 95th % Queue (m) | v/c | LOS | Delay (s) | 95th % Queue (m) | v/c | |
| Watkiss Way / Erskine Lane / Stoneridge Drive - Roundabout | ||||||||
| EB | A | 3.9 | 7 | 0.23 | A | 3.7 | 9 | 0.18 |
| WB | A | 3.5 | 4 | 0.12 | A | 3.8 | 6 | 0.21 |
| NB | A | 2.9 | 11 | 0.13 | A | 2.6 | 7 | 0.07 |
| SB | A | 2.7 | 4 | 0.02 | A | 2.7 | 4 | 0.01 |
| Watkiss Way / Erskine Lane / Stoneridge Drive – Traffic Signal | ||||||||
| EB | B | 14.5 | 44 | 0.58 | B | 16.4 | 31 | 0.44 |
| WB | B | 16.4 | 28 | 0.32 | B | 15.0 | 40 | 0.59 |
| NB | A | 6.2 | 18 | 0.14 | A | 7.1 | 13 | 0.09 |
| SB | A | 5.9 | 8 | 0.03 | A | 4.1 | 5 | 0.01 |
| Difference: Traffic Signal - Roundabout | ||||||||
| EB | B>A | +10.6 | +37 | +0.35 | B-->A | +12.7 | +22 | +0.26 |
| WB | B>A | +12.9 | +24 | +0.2 | B-->A | +11.2 | +34 | +0.38 |
| NB | A=A | +3.3 | +7 | +0.01 | A=A | +4.5 | +6 | +0.02 |
| SB | A=A | +3.2 | +4 | +0.01 | A=A | +1.4 | +1 | 0 |
Results show that the two devices perform with similar levels of LOS and delay, with the signal having a slightly higher delay value for the Watkiss Way movements. Queues remain comparable, with the signal having a slightly longer queues.
The intersection performs with little delay or queueing issue regardless of the control type as the results indicate, this is true of stop-controlled, signalized, or roundabout options.
6.5 Horizon Year Traffic Operations - 2033
6.5.1 Background Traffic Operations 2033
A summary of the background 2033 traffic analysis results for the intersections in the study area is provided in Table 12.
Table 12 – Background Traffic Operations - 2033
| Key Movement | AM | AM | AM | AM | PM | PM | PM | PM |
|---|---|---|---|---|---|---|---|---|
| LOS | Delay (s) | 95th % Queue (m) | v/c | LOS | Delay (s) | 95th % Queue (m) | v/c | |
| Watkiss Way / Erskine Lane / Stoneridge Drive (stop-controlled) | ||||||||
| EB | A | 3.1 | 3 | 0.00 | A | 2.8 | 3 | 0.01 |
| WB | A | 3.6 | 8 | 0.02 | A | 3.6 | 10 | 0.03 |
| NB | A | 6.4 | 17 | 0.16 | A | 5.7 | 15 | 0.01 |
| SB | A | 5.7 | 10 | 0.06 | A | 5.8 | 9 | 0.03 |
| Watkiss Way / Burnside Road W | ||||||||
| EB | B | 13.1 | 28 | 0.46 | B | 12.2 | 23 | 0.25 |
| WB | B | 15.3 | 30 | 0.56 | B | 14.2 | 36 | 0.61 |
| NBTL | B | 12.4 | 72 | 0.68 | C | 21.5 | 61 | 0.49 |
| NBR | A | 4.5 | 40 | 0.36 | A | 2.8 | 19 | 0.16 |
| SB | C | 31.9 | 40 | 0.24 | B | 14.2 | 75 | 0.63 |
| Watkiss Way / Hospital Access / Mall Access | ||||||||
| EB | A | 5.6 | 27 | 0.33 | A | 6.9 | 36 | 0.35 |
| WBTL | A | 6.3 | 38 | 0.34 | A | 6.3 | 34 | 0.26 |
| WBR | A | 3.0 | 3 | 0.34 | A | 3.0 | 4 | 0.26 |
| NB | A | 2.9 | 17 | 0.04 | A | 5.0 | 31 | 0.09 |
| SB | A | 4.3 | 14 | 0.06 | A | 5.2 | 26 | 0.12 |
| Watkiss Way / Helmcken Road / Chancellor Avenue | ||||||||
| EBLT | C | 25.5 | 62 | 0.61 | C | 28.8 | 85 | 0.64 |
| EBR | B | 14.9 | 54 | 0.41 | C | 21.8 | 73 | 0.64 |
| WBL | C | 25.6 | 8 | 0.07 | D | 38.9 | 11 | 0.10 |
| WBTR | C | 21.1 | 2 | 0.02 | C | 28.2 | 2 | 0.02 |
| NBL | F | 158.2 | 106 | 0.74 | F | 83.3 | 78 | 0.68 |
| NBTR | B | 18.7 | 129 | 0.29 | B | 16.8 | 90 | 0.28 |
| SBL | D | 54.2 | 11 | 0.03 | F | 88.7 | 16 | 0.07 |
| SBTR | C | 28.4 | 109 | 0.79 | D | 46.6 | 100 | 0.89 |
Note: ## - Exceeds storage/acceptable limits
The intersection of Watkiss Way / Erskine Lane / Stoneridge Drive operates at LOS A under stop-control with nod delay or queueing issues.
The Watkiss Way / Burnside Road W, and Watkiss Way / Hospital Access / Mall Access intersections in both the AM and PM peak hour area currently perform at an acceptable Level of Service (LOS), operating at LOS C or better with delays of 32 seconds or less. The 95th percentile queues are acceptable on all movements and the Volume to Capacity ratio (v/c) ratios for all approaches is 0.68 or less for all movements.
The intersection of Watkiss Way / Helmcken Road / Chancellor Avenue generally functions with an acceptable LOS, except for the northbound left movement, which operates at a LOS F with a delay of 158 seconds in the AM peak hour and at LOS F with a delay of 83 seconds in the PM peak hour, and the southbound left movement in the PM peak hour, which operates at a LOS F with a delay of 89 seconds. The 95th percentile queues are acceptable on all movements and the Volume to Capacity ratio (v/c) ratios for all approaches is 0.89 or less for all movements.
6.5.2 Full Build Out Traffic Operations 2033
A summary of the 2033 traffic analysis results for the intersections and site accesses in the study area after full build out, corridor growth, and site traffic is provided in Table 13 and Table 14.
Table 13 - 2033 Post Development Full Build Out
| Key Movement | AM | AM | AM | AM | PM | PM | PM | PM |
|---|---|---|---|---|---|---|---|---|
| LOS | Delay (s) | 95th % Queue (m) | v/c | LOS | Delay (s) | 95th % Queue (m) | v/c | |
| Watkiss Way / Erskine Lane / Stoneridge Drive (stop-controlled) | ||||||||
| EB | A | 3.4 | 2 | 0.00 | A | 3.5 | 6 | 0.01 |
| WB | A | 4.1 | 12 | 0.03 | A | 4.1 | 16 | 0.07 |
| NB | A | 8.4 | 20 | 0.34 | A | 9.2 | 17 | 0.21 |
| SB | A | 6.9 | 10 | 0.09 | A | 7.9 | 9 | 0.04 |
| Watkiss Way / Burnside Road W | ||||||||
| EB | B | 14.0 | 29 | 0.43 | B | 12.2 | 23 | 0.24 |
| WB | B | 16.5 | 40 | 0.60 | B | 13.6 | 33 | 0.64 |
| NBTL | B | 13.2 | 77 | 0.70 | C | 23.0 | 70 | 0.49 |
| NBR | A | 4.6 | 39 | 0.37 | A | 2.7 | 26 | 0.19 |
| SB | C | 32.3 | 46 | 0.26 | B | 18.6 | 90 | 0.65 |
| Watkiss Way / Hospital Access / Mall Access | ||||||||
| EB | A | 6.0 | 31 | 0.39 | A | 6.7 | 34 | 0.38 |
| WBTL | A | 6.3 | 39 | 0.35 | A | 6.5 | 37 | 0.29 |
| WBR | A | 3.2 | 14 | 0.35 | A | 3.1 | 5 | 0.29 |
| NB | A | 3.6 | 18 | 0.04 | A | 5.6 | 31 | 0.09 |
| SB | A | 4.3 | 14 | 0.06 | A | 4.4 | 21 | 0.12 |
| Watkiss Way / Helmcken Road / Chancellor Avenue | ||||||||
| EBLT | C | 28.7 | 65 | 0.65 | C | 29.9 | 87 | 0.66 |
| EBR | B | 14.3 | 58 | 0.43 | C | 22.2 | 75 | 0.66 |
| WBL | C | 27.9 | 8 | 0.08 | D | 39.5 | 9 | 0.10 |
| WBTR | C | 20.9 | 4 | 0.02 | B | 20.0 | 3 | 0.02 |
| NBL | F | 168.0 | 106 | 0.81 | F | 165.5 | 103 | 0.76 |
| NBTR | B | 18.9 | 128 | 0.30 | B | 19.8 | 124 | 0.28 |
| SBL | E | 66.2 | 6 | 0.04 | F | 86.2 | 10 | 0.07 |
| SBTR | C | 27.0 | 105 | 0.80 | D | 47.4 | 98 | 0.89 |
Note: ## - Exceeds storage/acceptable limits
Table 14 – Full Build Out 2033 Traffic Operations – Site Accesses
| Key Movement | AM | AM | AM | AM | PM | PM | PM | PM |
|---|---|---|---|---|---|---|---|---|
| LOS | Delay (s) | 95th % Queue (m) | v/c | LOS | Delay (s) | 95th % Queue (m) | v/c | |
| Erskine Lane / Access 1 | ||||||||
| WBLR | A | 5.5 | 15 | 0.06 | A | 4.9 | 15 | 0.05 |
| NBTR | A | 1.4 | 0 | 0.07 | A | 1.3 | 0 | 0.04 |
| SBTL | A | 1.5 | 7 | 0.01 | A | 1.6 | 7 | 0.03 |
| Erskine Lane / Access 2 | ||||||||
| WBLR | A | 5.0 | 10 | 0.03 | A | 4.6 | 10 | 0.01 |
| NBTR | A | 0.9 | 0 | 0.05 | A | 1.1 | 0 | 0.03 |
| SBTL | A | 2.9 | 0 | 0.01 | A | 2.6 | 0 | 0.01 |
| Erskine Lane / Access 3 | ||||||||
| WBLR | A | 4.7 | 10 | 0.03 | A | 4.5 | 10 | 0.01 |
| NBTR | A | 0.8 | 1 | 0.04 | A | 0.9 | 1 | 0.02 |
| SBTL | A | 2.5 | 1 | 0.01 | A | 2.6 | 1 | 0.01 |
In the 2033 horizon year the impacts on the network in both the AM and PM peak hours are moderate. The intersections of Watkiss Way / Erskine Lane / Stoneridge Drive, Watkiss Way / Burnside Road W, and Watkiss Way / Hospital Access / Mall Access in both the AM and PM peak hour sees a maximum change in delay of 5 seconds or less and maintains LOS C or better on all movements. The 95th percentile queues change by 15 metres or less on all movements (i.e., approximately two car lengths) and remain acceptable.
The previously failed movements at Watkiss Way / Helmcken Road / Chancellor Avenue continue to fail in both the AM and PM peak hours with the northbound left movement experiencing an additional 10 seconds of delay in the AM peak hour and 83 seconds of additional delay in the PM peak hour, and the southbound left movement experiencing the same delay in the PM peak hour. The southbound left movement now also fails in the AM peak hour reaching LOS E with a delay of 66 seconds.
The 95th percentile queues remain acceptable on all approaches with an increase of 34 metres or less (i.e., five car lengths) from background conditions. The v/c ratios for all approaches are 0.89 or less for all movements.
All site accesses continue to operate well at LOS A with delays of 6 seconds or less, less than 1 second increase from 2023, and 95th percentile queues of 15 metres of less (i.e., approximately 2 car lengths), less than 1 metre increase from 2023. The v/c ratio for all movements is 0.07 or less. Figure 17 and Figure 18 show the traffic volumes for the site accesses in the AM and PM peak hours in 2033.
Figure 17 – 2033 Site Accesses AM
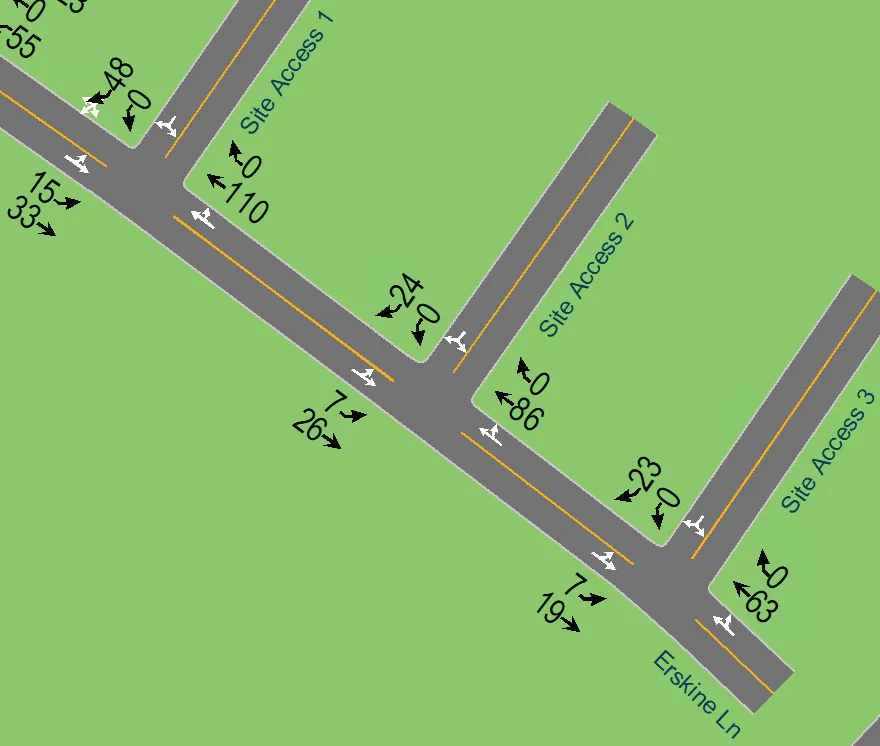
Figure 18 – 2033 Site Access PM
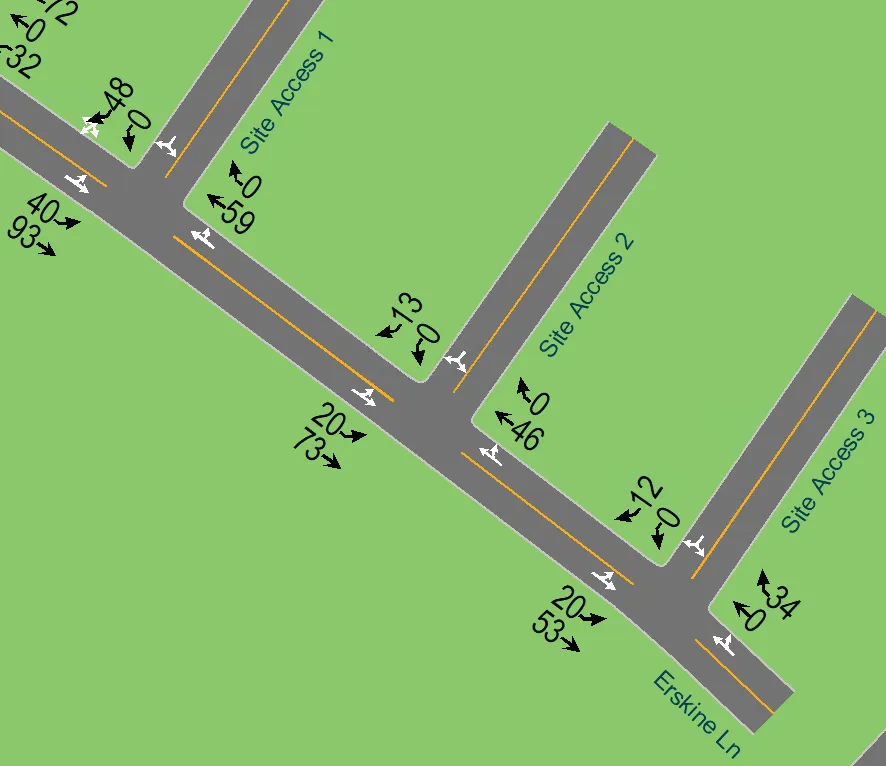
6.5.3 Watkiss Way / Erskine Lane / Stoneridge Drive Traffic Operations Change
Traffic control changes for the future scenario were modeled as they were in the 2023 scenario. A summary of the traffic analysis results in 2033 for the Watkiss Way / Erskine Lane / Stoneridge Drive intersection with traffic operation changes to either a roundabout or a traffic signal (assumes no dedicated turn lanes) is provided in Table 15.
Table 15 – Traffic Signal vs. Roundabout - 2033
| Key Movement | AM | AM | AM | AM | PM | PM | PM | PM |
|---|---|---|---|---|---|---|---|---|
| LOS | Delay (s) | 95th % Queue (m) | v/c | LOS | Delay (s) | 95th % Queue (m) | v/c | |
| Watkiss Way / Erskine Lane / Stoneridge Drive - Roundabout | ||||||||
| EB | A | 4.1 | 11 | 0.26 | A | 4.0 | 14 | 0.22 |
| WB | A | 3.6 | 7 | 0.14 | A | 4.0 | 7 | 0.25 |
| NB | A | 3.2 | 13 | 0.20 | A | 2.8 | 10 | 0.10 |
| SB | A | 2.8 | 6 | 0.02 | A | 2.7 | 4 | 0.01 |
| Watkiss Way / Erskine Lane / Stoneridge Drive – Traffic Signal | ||||||||
| EB | B | 14.1 | 45 | 0.62 | B | 11.5 | 37 | 0.47 |
| WB | B | 18.5 | 29 | 0.36 | B | 15.1 | 43 | 0.66 |
| NB | A | 6.7 | 23 | 0.23 | A | 9.1 | 16 | 0.14 |
| SB | A | 7.1 | 9 | 0.03 | A | 6.0 | 6 | 0.02 |
| Difference: Traffic Signal - Roundabout | ||||||||
| EB | B>A | +10 | +34 | +0.36 | B>A | +7.5 | +23 | +0.25 |
| WB | B>A | +14.9 | +22 | +0.22 | B>A | +11.1 | +36 | +0.41 |
| NB | A=A | +3.5 | +10 | +0.03 | A=A | +6.3 | +6 | +0.04 |
| SB | A=A | +4.3 | +3 | +0.01 | A=A | +3.3 | +2 | +0.01 |
Note: ## - Exceeds storage/acceptable limits
Comparing a change in traffic operation for the intersection of Watkiss Way / Erskine Lane / Stoneridge Drive in 2033 shows that both a traffic signal and a roundabout continue to work as a solution to improve traffic operations. A traffic signal still operates at LOS B or better with a delay of 19 seconds or less, and a roundabout continues to operate at LOS A with a delay of 4 seconds or less.
A traffic signal has a larger delay of 15 seconds or less over a roundabout in the AM and PM peak hours in 2033. The 95th percentile queues increase by 36 metres or less (i.e., approximately 5 car lengths) and the v/c ratio increases by 0.41 or less on any movement. These results demonstrate that either option will serve traffic acceptably, and the inclusion of left turn lanes on Watkiss Way would improve the signal performance results.
As with the 2023 results the intersection performs well under all traffic control types, including under stop-control.
7.0 LEFT TURN LANES
A left-turn lane warrant analysis was conducted at Watkiss Way/Erskine Lane using the MoTI tables for unsignalized intersections. Results can be seen in Table 16.
The results show that no left turn lane is warranted in either 2023 or 2033. The “Yes” results in the 2033 Westbound – PM is very marginal, barely meeting the requirements.
Despite these results WATT recommends that the turn lanes be installed on Watkiss Way; they provide improved safety as it separates left turn and through traffic and provides the opportunity for dedicated left turn phasing in a signalized future (if warranted).
Table 16 – MOTI Left Turn Warrant Analysis for Unsignalized Intersections
| Movement and Time | Approaching Vehicle Volume | Opposing Vehicle Volume | No. of Left Turns | % of Left Turns | Warranted? |
|---|---|---|---|---|---|
| 2023 | |||||
| Eastbound - AM | 278 | 143 | 2 | 1% | No |
| Westbound - AM | 143 | 278 | 24 | 17% | No |
| Eastbound - PM | 216 | 261 | 5 | 2% | No |
| Westbound - PM | 261 | 216 | 55 | 21% | No |
| 2023 | |||||
| Eastbound - AM | 319 | 170 | 2 | 1% | No |
| Westbound - AM | 170 | 319 | 34 | 20% | No |
| Eastbound - PM | 262 | 312 | 6 | 2% | No |
| Westbound - PM | 312 | 262 | 84 | 27% | Yes |
8.0 CONCLUSIONS
The development will not significantly impact the traffic operations at the three Town intersections. All movements will operate at LOS C or better in the long-term in both the background and post development conditions.
At the Watkiss Way / Helmcken Road intersection, the addition of the development does impact the levels of service; however, the effect is minimal as most of the failing movements were failing in background. The biggest effect in both the 2023 and 2033 analysis is to the northbound left movement (least critical movement) in the PM peak hour and the southbound left movement in the AM peak hour. MOTI and the Town of View Royal should look at improving traffic signal timing to mitigate this issue.
The proposed TDM program (two car share vehicles, two shared e-bikes, and secure bicycle parking) along with the proximity to the Galloping Goose, transit, and amenities at Eagle Creek Village will help encourage residents to shift their trips to other modes of transportation and reduce vehicular traffic.
The proposed site access meet TAC guidelines for corner clearance and sightlines.
A sidewalk should be provided along the Erskine Lane development frontage to provide a better connection to the Hospital trail, and Galloping Goose Trail. Additional bicycle improvements are under negotiation with the Town at this time, however a high-quality AAA connection to the Galloping Goose Trail (i.e. a multi-use path or equivalent) should be strongly considered.
Traffic calming is not required on Erskine Lane due to the short length of the street and the lack of connectivity to other streets. Traffic calming on Erskine Lane would not reduce traffic (as all traffic would be due to land uses on the street) and there is limited ability to speed due to the length.
9.0 RECOMMENDATIONS
Watt makes the following recommendations to the developer of this site:
- The developer will provide a sidewalk along the Erskine Lane and Watkiss Way development frontages.
- The developer provides a high-standard cycling connection to the Galloping Goose Trail along the Erskine Lane frontage.
- The developer to explore implementation of TDM strategies [car share vehicles (2) and electric bicycle share (2)] to reduce vehicle traffic and encourage active modes.
- The developer to contribute towards the traffic control scheme of the Erskine Lane / Watkiss Way intersection. Including left turn lanes.