Presentation
WSPRS 2026 – 2030 FINANCIAL PLAN Presentation
January 13, 2026Pages 45–6419 sections
Slide presentation deck outlining 2025 highlights, 2026 budget considerations, and requisition impacts.
Outdoor Pickleball Courts Grand Opening: June 13th, 2025274,913 total visits in 2025View Royal assessed value growth: 1.73%
2026 – 2030 FINANCIAL PLAN
Town of View Royal January 13, 2026
Page 45–64
Today’s presentation includes:
- 2025 Highlights
- 2025 financial projections and major variances
- 2026 budget considerations
- 2026 major expense increases
- 5-Year financial plan 2026-2030
- Summary of the 2026 capital projects
- 5-Year Capital Plan
- 5-Year Reserve Continuity
- Requisition impact to each municipality
Page 45–64
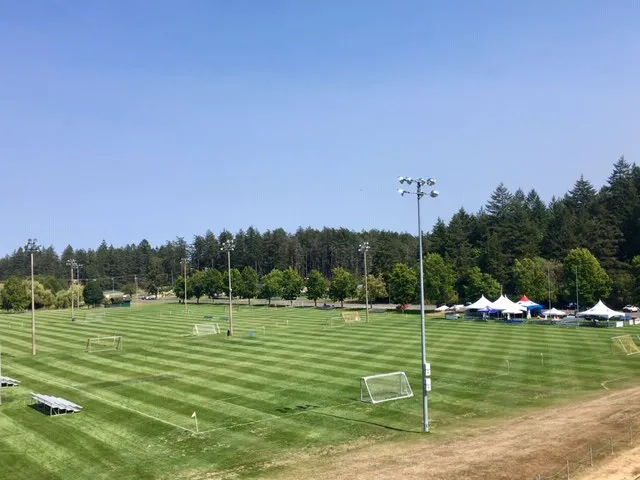
2025 HIGHLIGHTS
- Field Rentals
- 2025 – 5,831 hours
- 2024 – 5,613 hours
- 3.9% increase or +218 hours
- Court Rentals
- 2025 – 3,317 hours
- PB – 3,175, Tennis - 152
- 2024 – 837 hours
- Beach Volleyball – 735, Tennis - 102
- 396% increase or +2,480 hours
- 2025 – 3,317 hours
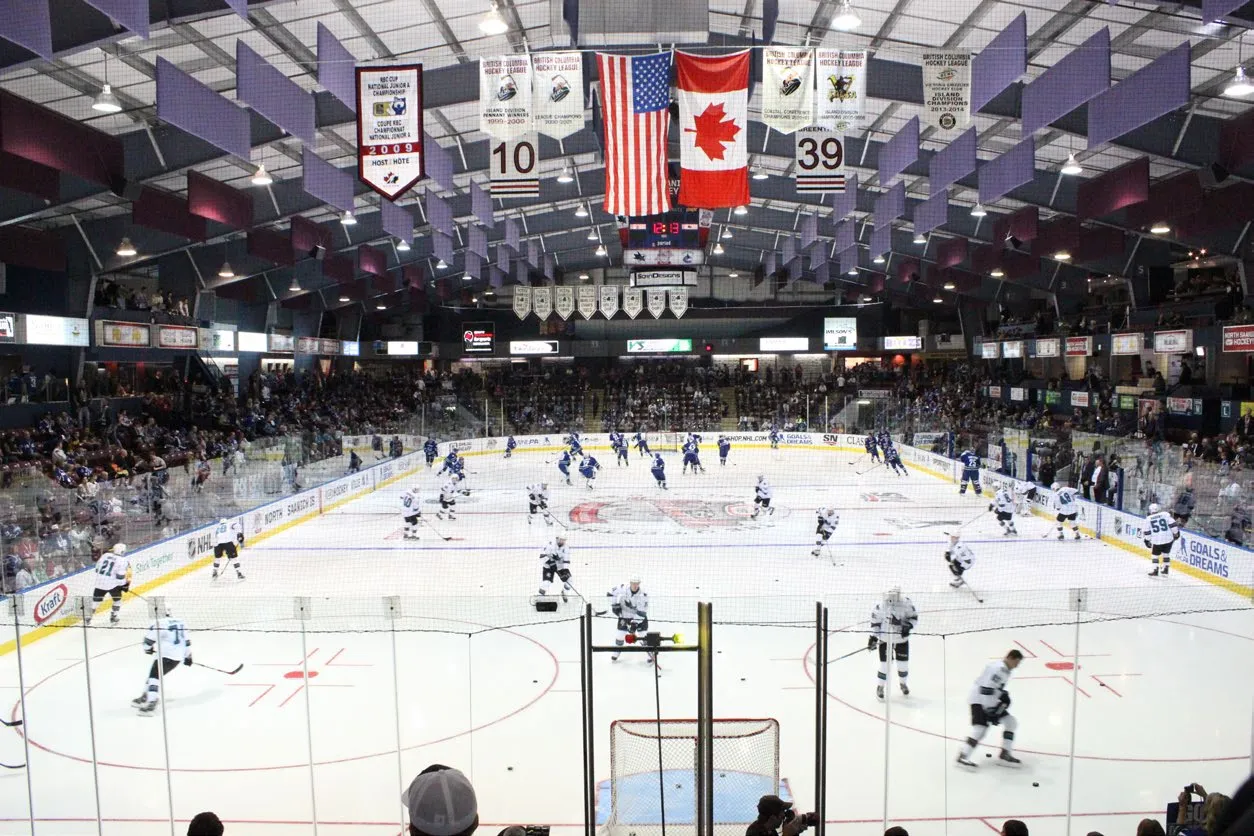
- Arena Rentals
- 2025 – 4,097 hours
- 2024 – 3,924 hours
- 4.4% increase or +173 hours
2025 HIGHLIGHTS
| 2025 | 2024 | Variance | |
|---|---|---|---|
| Single Visits | 78,214 | 72,422 | +5,792 |
| Pass Uses | 196,699 | 185,565 | +11,134 |
| Total | 274,913 | 257,987 | +16,926 |
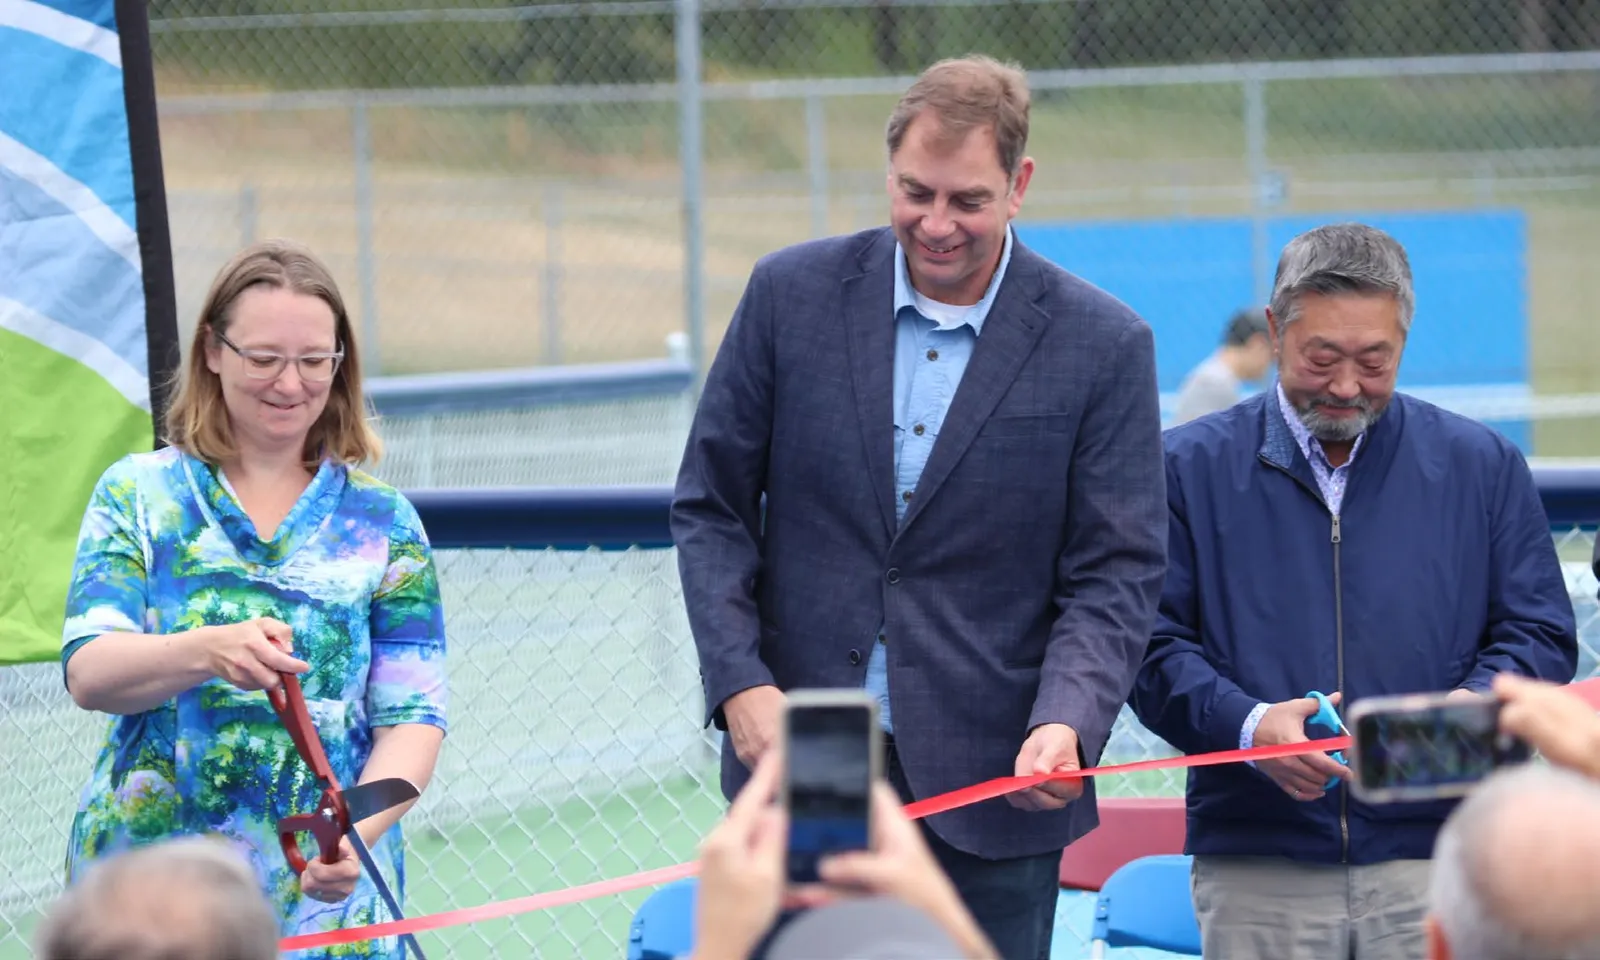
2025 Best Place For Fitness
Outdoor Pickleball Courts
- Grand Opening June 13th, 2025
- 3,175 hours booked
- Many more hours of drop-in use
- $25,830 Revenue
- Previous Beach Volleyball Courts
- 700 hours booked
- $15-$18,000 Revenue

Page 45–64
2025 Projection
| Revenues | 2025 Projection ($) | 2025 Budget ($) | Variance ($) |
|---|---|---|---|
| Requisitions | 6,285,001 | 6,285,001 | 0 |
| Service Provision | 9,662,931 | 8,787,022 | 875,909 |
| Total Revenue | 15,947,932 | 15,072,023 | 875,909 |
| Expenses | 2025 Projection ($) | 2025 Budget ($) | Variance ($) |
|---|---|---|---|
| Salaries/Wages | 9,742,891 | 9,828,372 | -85,481 |
| Administration | 2,180,931 | 2,194,245 | -13,314 |
| Maintenance | 1,865,658 | 1,411,832 | 453,826 |
| Parks | 344,977 | 381,356 | -36,379 |
| Programs | 1,496,742 | 1,256,218 | 240,524 |
| Total Expense | 15,631,199 | 15,072,023 | 559,176 |
| Net Operating | 316,733 | 0 | 316,733 |
Page 45–64
2025 Projection Major Variances
| Revenues | Amount ($) | Comments |
|---|---|---|
| Licensed Care | 354,720 | Grant revenue & better program performance |
| Programs | 208,760 | Better program performance |
| Food & Beverage | 146,610 | Higher concession revenue |
| Facility Bookings | 83,760 | Artificial turf & Pickleball court rental |
| JDF & Q Centre Arenas | 82,920 | Grizzlies’ 3rd round & general fall rentals |
| Expenses | Amount ($) | Comments |
|---|---|---|
| Maintenance Salaries | (228,675) | Vacant Roles |
| Maintenance Service Contracts | 402,930 | Emergency repairs & delays due to staff shortages |
| Programs | 206,930 | Higher costs due to growth in revenue |
| Licensed Care | 122,315 | Higher costs due to growth in revenue |
| Food & Beverage | 50,120 | Higher costs due to growth in revenue |
| JDF & Q Centre Arenas | 48,505 | Higher costs due to growth in revenue |
Page 45–64
2026 Budget Considerations
- Current approved 5-year financial plan includes a 3.9% lift for 2026.
- WSPRS’ Collective Agreement ended in 2025. A 1% wage increase has a value of $98,284 or a 1.56% requisition increase.
- The addition of a cleaner position, resulting from increased foot traffic throughout the facility.
- 2nd phase of the surveillance equipment upgrade and expansion.
- Asset management requirements, including the $60,000 annual lift to capital asset reserve contributions as established in 2021.
- Building Safer Communities grant funding ends 2025.
- Youth Engagement program $104,252 or 1.66% requisition increase.
- Annual utility rate increases of 5-10%.
Page 45–64
2026 Major Expense Increases
- July 2025 1% collectively bargained wage increase: $46,970
- Affects wages in 2026 from January through June.
- Utility rate increases: $17,700
- Increased transfers to capital reserves: $60,000
- New cleaner position: $76,448
- Additional scope to the upcoming strategic plan process to align with the West Shore Parks and Recreation Facility Master Plan: $30,000
- Continuation of the successful Youth Engagement program without grant funding: $104,252
- Wage contingency established in preparation for collective agreement negotiations.
Page 45–64
2026 Financial Variances
- Total expenses increased by $1,052,412 or 7.0%
- Includes the $104,252 Youth Engagement program.
- Fees, program offerings and performance expectations were increased by $703,045 or 8.1%.
- Average fee increases as follows:
- Admission 4.2%
- Indoor facilities 3.78%
- Arenas 4.14%
- Outdoor Facilities 5.17%
- Golf 4.72%
- A requisition increase of $349,367 or 5.56% to compensate the difference.
- 3.9% for operations and 1.66% for the Youth Engagement Program.
- The 2025 increase was 3.9% or $235,916.
Page 45–64
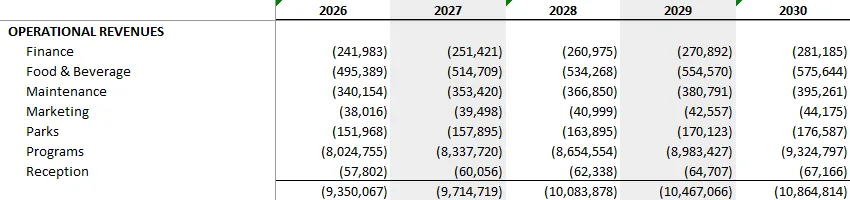
5-Year Financial Plan 2026-2030
| OPERATIONAL REVENUES | 2026 | 2027 | 2028 | 2029 | 2030 |
|---|---|---|---|---|---|
| Finance | (241,983) | (251,421) | (260,975) | (270,892) | (281,185) |
| Food & Beverage | (495,389) | (514,709) | (534,268) | (554,570) | (575,644) |
| Maintenance | (340,154) | (353,420) | (366,850) | (380,791) | (395,261) |
| Marketing | (38,016) | (39,498) | (40,999) | (42,557) | (44,175) |
| Parks | (151,968) | (157,895) | (163,895) | (170,123) | (176,587) |
| Programs | (8,024,755) | (8,337,720) | (8,654,554) | (8,983,427) | (9,324,797) |
| Reception | (57,802) | (60,056) | (62,338) | (64,707) | (67,166) |
| Total | (9,350,067) | (9,714,719) | (10,083,878) | (10,467,066) | (10,864,814) |
- Includes an average fee increase of 4% on programs, rentals and admissions
- 3.9% increase year over year in future years
Page 45–64
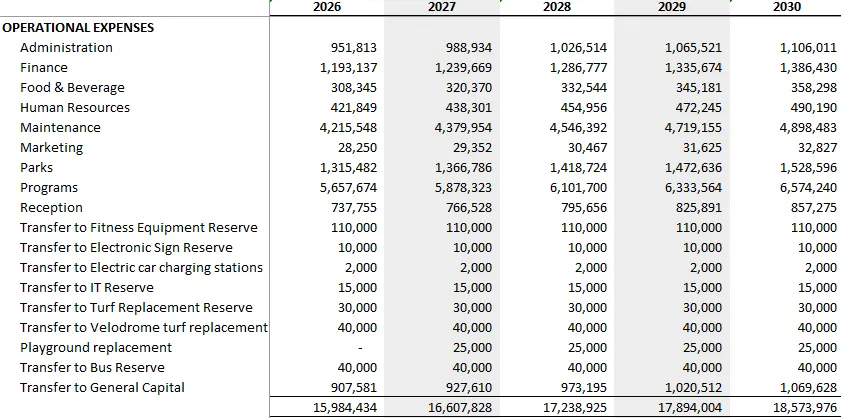
5-Year Financial Plan 2026-2030
| OPERATIONAL EXPENSES | 2026 | 2027 | 2028 | 2029 | 2030 |
|---|---|---|---|---|---|
| Administration | 951,813 | 988,934 | 1,026,514 | 1,065,521 | 1,106,011 |
| Finance | 1,193,137 | 1,239,669 | 1,286,777 | 1,335,674 | 1,386,430 |
| Food & Beverage | 308,345 | 320,370 | 332,544 | 345,181 | 358,298 |
| Human Resources | 421,849 | 438,301 | 454,956 | 472,245 | 490,190 |
| Maintenance | 4,215,548 | 4,379,954 | 4,546,392 | 4,719,155 | 4,898,483 |
| Marketing | 28,250 | 29,352 | 30,467 | 31,625 | 32,827 |
| Parks | 1,315,482 | 1,366,786 | 1,418,724 | 1,472,636 | 1,528,596 |
| Programs | 5,657,674 | 5,878,323 | 6,101,700 | 6,333,564 | 6,574,240 |
| Reception | 737,755 | 766,528 | 795,656 | 825,891 | 857,275 |
| Transfer to Fitness Equipment Reserve | 110,000 | 110,000 | 110,000 | 110,000 | 110,000 |
| Transfer to Electronic Sign Reserve | 10,000 | 10,000 | 10,000 | 10,000 | 10,000 |
| Transfer to Electric car charging stations | 2,000 | 2,000 | 2,000 | 2,000 | 2,000 |
| Transfer to IT Reserve | 15,000 | 15,000 | 15,000 | 15,000 | 15,000 |
| Transfer to Turf Replacement Reserve | 30,000 | 30,000 | 30,000 | 30,000 | 30,000 |
| Transfer to Velodrome turf replacement | 40,000 | 40,000 | 40,000 | 40,000 | 40,000 |
| Playground replacement | - | 25,000 | 25,000 | 25,000 | 25,000 |
| Transfer to Bus Reserve | 40,000 | 40,000 | 40,000 | 40,000 | 40,000 |
| Transfer to General Capital | 907,581 | 927,610 | 973,195 | 1,020,512 | 1,069,628 |
| Total | 15,984,434 | 16,607,828 | 17,238,925 | 17,894,004 | 18,573,976 |
- 3.9% increase year over year in future years
- Maintains the annual increase contributions to the capital replacement reserve
Page 45–64
2026 Capital Projects
Note: approved projects not completed in 2025 are noted as carried forward for 2026.
| MAJOR SITE MAINTENANCE | Amount ($) |
|---|---|
| Pool Boilders (carry forward from 2025) | 340,000 |
| 12 Storage containers | 257,520 |
| Pool Hot Tub Liner | 250,000 |
| Surveillance Equipment Phase 2 | 140,000 |
| JDF Arena MCP Panel (carry forward from 2025) | 100,000 |
| Seniors Generator | 90,000 |
| JDF Emergency Generator | 80,000 |
| Pool Changeroom AHU | 75,000 |
| Site - HV Electrical Maint | 75,000 |
| Mens & Womens Changeroom Tile | 60,000 |
| Pool Hot Water System | 50,000 |
| Pool Doors | 50,000 |
| ISF Doors | 50,000 |
| System Server Hosts | 25,000 |
| Seniors Fire Panel | 20,000 |
| Clubhouse Hot Water Tank | 20,000 |
| Pool Waterslide | 12,000 |
| ISC Ceiling Netting | 10,000 |
| Q Centre Water Tanks (carry forward from 2025) | 7,500 |
| Lobby Fountain | 5,000 |
| Concourse Fountain - Q center | 5,000 |
| Subtotal | 1,722,020 |
| MAJOR PARKS MAINTENANCE | Amount ($) |
|---|---|
| Field Lights | 100,000 |
| Roadway Repair | 45,000 |
| Water closet man holes | 20,000 |
| Playground, Upper, Chips | 12,000 |
| Concession Fountain - lower fields | 10,000 |
| JDF Lacrosse Box (Board Replacement) | 4,000 |
| Subtotal | 191,000 |
| FLEET | Amount ($) |
|---|---|
| TORO Walk Behind Aerator | 35,000 |
| Floor Machine (Lower Rink) | 30,000 |
| Ice Edger (carry forward from 2025) | 8,000 |
| Pressure Washer | 5,000 |
| Subtotal | 78,000 |
| LIBRARY CAPITAL EXPENDITURES | Amount ($) |
|---|---|
| Bathroom Trap fix | 50,000 |
| Bathroom Fixtures and Walls | 30,000 |
| Kids Area Lighting/Bench Millwork/Drywall | 20,000 |
| Subtotal | 100,000 |
TOTAL CAPITAL EXPENDITURES: $2,091,020
CAPITAL FUNDING
| Funding Source | Amount ($) |
|---|---|
| Capital Reserve | (1,966,020) |
| Library Capital Reserve | (100,000) |
| IT Infrastructure Reserve | (25,000) |
| TOTAL FUNDING | (2,091,020) |
Page 45–64
5-Year Capital Plan
| 2026 | 2027 | 2028 | 2029 | 2030 | |
|---|---|---|---|---|---|
| Major site maintenance | $1,722,020 | $1,035,000 | $1,162,000 | $805,000 | $465,000 |
| Major parks maintenance | 191,000 | 125,000 | 184,000 | 183,000 | 834,000 |
| Fleet | 78,000 | 209,000 | 466,000 | 281,000 | 105,000 |
| Total WSPR | 1,991,020 | 1,369,000 | 1,812,000 | 1,269,000 | 1,404,000 |
| Library | 100,000 | 20,000 | 40,000 | 0 | 40,000 |
| Total incl. Library | 2,091,020 | 1,389,000 | 1,852,000 | 1,269,000 | 1,444,000 |
| Equipment Fund | 25,000 | 120,000 | 400,000 | 50,000 | 300,000 |
| General Capital Fund | 1,966,020 | 1,249,000 | 1,412,000 | 1,219,000 | 1,104,000 |
| Library Fund | 100,000 | 20,000 | 40,000 | 0 | 40,000 |
Page 45–64
Reserve Continuity
| Equipment Replacement Reserve | General Capital Reserve | |
|---|---|---|
| 2025 | ||
| Opening Balance | $ 355,731 | $ 2,550,340 |
| Contributions | 247,000 | 847,581 |
| Less: Expenses | (50,000) | (1,472,832) |
| Ending Balance | 552,731 | 1,925,089 |
| 2026 | ||
| Opening Balance | 552,731 | 1,925,089 |
| Contributions | 247,000 | 907,581 |
| Projected Unspent Expenses | 316,733 | |
| Less: Expenses | (25,000) | (1,966,020) |
| Ending Balance | 774,731 | 1,183,383 |
| 2027 | ||
| Opening Balance | 774,731 | 1,183,383 |
| Contributions | 272,000 | 927,610 |
| Less: Expenses | (120,000) | (1,249,000) |
| Ending Balance | 926,731 | 861,993 |
| 2028 | ||
| Opening Balance | 926,731 | 861,993 |
| Contributions | 272,000 | 973,195 |
| Less: Expenses | (400,000) | (1,412,000) |
| Ending Balance | 798,731 | 423,188 |
| 2029 | ||
| Opening Balance | 798,731 | 423,188 |
| Contributions | 272,000 | 1,020,512 |
| Less: Expenses | (50,000) | (1,219,000) |
| Ending Balance | 1,020,731 | 224,700 |
| 2030 | ||
| Opening Balance | 1,020,731 | 224,700 |
| Contributions | 272,000 | 1,069,628 |
| Less: Expenses | (300,000) | (1,104,000) |
| Ending Balance | $ 992,731 | $ 190,328 |
Page 45–64
Converted Assessments
| MUNICIPALITY | 2025 GENERAL PURPOSE | 2025 EXEMPT | 2025 TOTAL | 2025 % | 2024 TOTAL | 2024 % | % CHANGE |
|---|---|---|---|---|---|---|---|
| City of Colwood | $ 850,898,868 | $ 75,688,512 | $ 926,587,380 | 22.22% | $ 896,511,341 | 22.33% | 3.35% |
| District of Highlands | 133,430,969 | 299,565 | 133,730,534 | 3.21% | 133,880,882 | 3.33% | -0.11% |
| City of Langford | 2,294,768,803 | 11,997,394 | 2,306,766,197 | 55.31% | 2,186,630,864 | 54.46% | 5.49% |
| District of Metchosin | 230,335,915 | 59,584,958 | 289,920,873 | 6.95% | 292,992,591 | 7.30% | -1.05% |
| Town of View Royal | 512,888,731 | 1,059,770 | 513,948,501 | 12.32% | 505,200,776 | 12.58% | 1.73% |
| Total | $ 4,022,323,286 | $ 148,630,199 | $ 4,170,953,485 | 100.00% | $ 4,015,216,454 | 100.00% | 3.88% |
View Royal’s assessed value grew by 1.73%, which is less than the average 3.88% which results in a reduction in ownership by .26%
Page 45–64
2026 Requisition
| REQUISITION REQUEST | 2025 Budget (3.90% Increase) | 2026 Budget (5.56% Increase) | Increase | % Increase |
|---|---|---|---|---|
| Colwood | (1,403,305) | (1,473,841) | (70,536) | 5.03% |
| Highlands | (209,563) | (212,713) | (3,150) | 1.50% |
| Langford | (3,422,724) | (3,669,170) | (246,446) | 7.20% |
| Metchosin | (458,620) | (461,152) | (2,532) | 0.55% |
| View Royal | (790,789) | (817,493) | (26,704) | 3.38% |
| Total | $ (6,285,001) | $ (6,634,368) | $ (349,367) | 5.56% |
- $349,367 or 5.56% increase proposed for 2026
- 2.94% or $185,115 for operating
- 0.95% or $60,000 additional annual capital reserve contribution
- 1.66% of $104,252 to fund the Youth Engagement Program
- Requisition increases are in line with the approved 5-Year plan as presented last year
Page 45–64
2026 Estimated Taxation Impact
| MUNICIPALITY | TOTAL PROPERTY TAX 2025 | 2026 Requisition 5.56% INCREASE | 2026 INCREASE % | 2024 POPULATION | 2026 INCREASE PER CAPITA |
|---|---|---|---|---|---|
| Colwood | $ 23,938,500 | $ 70,536 | 0.29% | 22,169 | $ 3.18 |
| Highlands | $ 2,822,800 | $ 3,150 | 0.11% | 2,994 | $ 1.05 |
| Langford | $ 62,206,140 | $ 246,446 | 0.40% | 58,503 | $ 4.21 |
| Metchosin | $ 2,801,304 | $ 2,532 | 0.09% | 5,376 | $ 0.47 |
| View Royal | $ 13,690,566 | $ 26,704 | 0.20% | 13,019 | $ 2.05 |
Reference Materials
- BC Government population projections
- 2025-2029 Municipal Financial Plans
Page 45–64
View Royal Overview
- Ownership 12.32%
- 7,512 or 13.6% Clients
- 195 or 14.9% Memberships
- 2,102 or 10.8% Registrations
- 31,851 or 17.0% Drop-ins
- 212 or 13.4% LIFE Clients
- 604 or 17.8% Visit Passes
- 13.1% of all Transactions
Page 45–64
Partnership
Page 45–64
Engagement with our ownership
Page 45–64
Document Images
(4)


Extracted from: 2026 01 13 Committee of the Whole Meeting - Agenda - Pdf