Asset Replacement Funding Plan Report
A detailed consultant report by Your City Solutions Inc. providing a framework and scenarios for funding municipal asset replacement.
Asset Replacement Funding Plan Report
Prepared By: Your City Solutions Inc 333 E 11th Vancouver, V5T 0H1
Prepared For: Town of View Royal; 45 View Royal Avenue Victoria, BC V9B 1A6
June 2022 Draft
Table of Contents
- Executive Summary (4-9)
- Introduction (11-19)
- Context (11)
- What is asset management (12)
- Why is asset management important (13)
- Background (14-19)
- Asset Replacement Funding Plan (21-77)
- Compile Asset Data (21-22)
- Funding Demand (24-28)
- Risk & Levels of Service (30-43)
- Forecasted Asset Replacement Budget (45-77)
- Summary (79)
- Concluding Remarks (79)
Disclaimer: The information in this report is intended for information purposes only. Your City Solutions Inc under no circumstances shall be liable for any indirect, direct, incidental, consequential, special or exemplary damages arising out of or in connection with your access or use of the information contained within this Report or the Asset Replacement Funding plan excel model. The City accepts that is access to, use of and any reliance placed upon the output from the report or model be at the City’s sole risk & expense. Your City Solutions shall not be liable for any damages resulting from loss or corruption of any of the City’s data or content regardless of cause.
Executive Summary
Historically, local governments have been very effective at financial planning for operation and maintenance costs, but many do not fully plan for the replacement of their capital assets. As a result, many local government assets are now nearing or at the end of their life and officials are left asking how they can financially plan for the replacement of these assets in a responsible manner. In short, Town of View Royal is not alone in its desire to improve the way the Town thinks about and plans for asset replacements.
In order to begin to better understand what asset replacement budget is best for the Town, a set of key performance indicators (KPI’s) were calculated to help Town of View Royal better understand the impact the replacement budgets have on future risk and levels of service. These KPIs include; Asset HealthScore, Past Life Assets, and Consumption Ratio.
Today, the Town of View Royal owns $138 million dollars in infrastructure of which 4% of the assets are past their estimated life and on average the assets are about one-third (33%) into its average life span which translates to an Asset HealthScore of 96%. When compared to other local governments across British Columbia, the Town’s assets are healthier which presents a unique opportunity for staff & council to begin planning for the replacement of assets today which will help promote sustained levels of service, reduce the risk of failure & help ensure taxes can be kept consistent.
Four funding scenarios were developed to help council and staff better understand the impact various asset replacement budgets will have on the risk and levels of service of the Town's assets.
- Scenario 1: Current Average Annual Reserve Contribution – In this scenario, it was assumed that the current average annual reserve contribution would continue in perpetuity.
- Scenario 2: Risk & Levels of Service Remain Similar – The Goal of this scenario is to keep future risk & levels of service similar to current levels. To achieve this the Asset HealthScore today should be similar to the Asset HealthScore in the future.
- Scenario 3: Asset HealthScore Target of 80% – The goal of this scenario was to set an overall Asset HealthScore of 80% and allow less than 15% of the total assets to exceed their estimated life spans.
- Scenario 4: Asset HealthScore Target of 55% – The goal of this scenario was to target an overall Asset HealthScore of 55% and allow less than 25% of the total assets to exceed their estimated life spans.
Figure ES1: Asset HealthScore, Past Life Asset, Consumption Ratio Replacement Budget & Funding Gap Summary
| Metric | Scenario 1 | Scenario 2 | Scenario 3 | Scenario 4 |
|---|---|---|---|---|
| Starting Asset HealthScore | 96% | 96% | 96% | 96% |
| Final Asset HealthScore | 37% | 97% | 79% | 55% |
| Change | -59% | 1% | -17% | -41% |
| Starting Past Life Asset | 4% | 4% | 4% | 4% |
| Final Past Life Asset | 31% | 0% | 13% | 25% |
| Change | 27% | -4% | 10% | 21% |
| Starting Consumption Ratio | 33% | 33% | 33% | 33% |
| Final Consumption Ratio | 87% | 56% | 69% | 81% |
| Change | 53% | 22% | 36% | 48% |
| Asset Replacement Budget | $456,800 | $1,887,000 | $1,251,214 | $726,800 |
| Funding Gap | $- | ($1,430,200) | ($794,414) | ($270,000) |
| Risk | Increase | Similar | Increase | Increase |
| Levels of Service | Decrease | Similar | Decrease | Decrease |
Observations
- Scenario 1 could result in the largest potential increase in risk and largest potential drop in levels of service & has the smallest funding gap.
- Scenario 2 risk and levels of service levels should be similar today into the future and has the largest replacement budget.
- Scenario 3 could result in higher risk levels & lower levels of service in the future but better than scenarios 1 & 4.
- Scenario 4 could result in higher risk of failure & lower levels of service in the future but would be better than scenario 1 but not as good as scenario 2 or 3.
Figure ES2: Forecasted Asset Replacement Budget Scenario Comparison
| Category | Scenario 1 | Scenario 2 | Scenario 3 | Scenario 4 |
|---|---|---|---|---|
| Total | $456,800 | $1,887,000 | $1,251,214 | $726,800 |
| Sewer Capital Fund | $86,800 | $150,000 | $86,800 | $86,800 |
| General Capital Fund | $370,000 | $1,737,000 | $1,164,414 | $640,000 |
| Transportation | $ - | $1,050,000 | $711,722 | $350,000 |
| Land Improvement | $ - | $350,000 | $313,692 | $215,000 |
| Buildings | $ - | $237,000 | $139,000 | $75,000 |
| Drainage | $ - | $100,000 | $ - | $ - |
Observations
- Asset replacement budgets range from $456,800 to $1.9 million depending on the scenario modeled.
- Most of the General Capital Fund drives the forecasted replacement budget in all scenarios.
- Within General Capital Fund, transportation assets drive the majority of the forecasted budget in all scenarios except in scenario 1.
- It is important to note that the life cycle funding was not selected as a scenario to model, but as a reference point the life cycle value is $2.93 million. Note: Life cycle funding represents the funding level if the Town of View Royal were to replace assets at the end of their estimated life and use reserve funds (i.e cash) to replace assets.
Figure ES3: Asset Funding Gap Scenario Comparison
| Fund | Scenario 1 | Scenario 2 | Scenario 3 | Scenario 4 |
|---|---|---|---|---|
| Total | $ - | $(1,430,200) | $(794,414) | $(270,000) |
| Sewer Capital Fund | $ - | $(63,200) | $ - | $ - |
| General Capital Fund | $ - | $(1,367,000) | $(794,414) | $(270,000) |
Observations
- There is a funding gap for all scenarios modeled.
- The largest funding gap exists within scenario 2.
- The funding gap is mostly driven by the General Capital Fund.
- There is no funding gap for the Sewer Capital Fund for scenarios 1, 3, and 4.
Figure ES4: Pro & Con Summary for each Scenario Modeled
| Scenario | Pro's | Con's |
|---|---|---|
| Scenario 1: Current Average Annual Reserve Contribution | No increase in taxation. | Risk of asset failure goes up when compared to today and levels of service will drop when compared to today. As an example, this could mean that roads may have more potholes and there would likely be more disruption in sewer services. |
| Scenario 2: Risk & Levels of Service Remains Similar | Risk and levels of service will remain consistent over the planning period. | This scenario presents the largest funding gap, which would mean that it would result in the largest tax / rate increase when compared to scenarios 1, 3, and 4. If minimizing taxes and rates is the top priority, this should not be the preferred scenario. If the goal is to sustain current levels of risk and service, this funding scenario could serve the Town well. |
| Scenario 3: Asset HealthScore Target of 80% | The funding gap is not as large as scenario 2 and the Asset HealthScore is within the range of most local governments across British Columbia today. Risk of asset failure is lower than in scenarios 1 and 4, and the likelihood that levels of service will drop is lower than in scenarios 1 and 4. | Risk of asset failure will be higher than today and levels of service will be lower. As an example, this could mean that the roads may have more potholes than today but would have less potholes than in scenario 1. This scenario balances the potential impact to taxation and rates with sustaining service levels and risk of failure. |
| Scenario 4: Asset HealthScore Target of 55% | Second smallest funding gap from all scenarios modeled. This means taxation and rates would be second least impacted. Risk of asset failure is lower than in scenario 1 and the likelihood that levels of service will drop is lower than in scenario 1. | Risk of asset failure will be higher than today & levels of service will be lower than today. As an example this could mean the road may have more potholes than in scenario 3 but less potholes than in scenario 1. Alternatively, it could mean there could be more disruption to services such as sewermains than in scenario's 2 & 3 but less than in scenario 1. This scenario would work well if the Town is very budget conscious & is open to reducing levels of service & increasing the risk of asset failures. |
In summary, The Town has done an exceptional job at keeping its infrastructure maintained to date and now has an opportunity to plan for long-term capital asset replacements. By planning for future asset replacements today, the Town can have confidence that its assets can provide great service to the citizens and promote stable and consistent taxes and rates, today and into the future.
The goal of this report was to help the staff & council better understand the correlational between the asset replacement budget and its impact on risk & level of service over time. Each of the scenarios molded were shared to help staff and council gain clarity on how to best move forward with selecting the right asset replacement budget based on the Towns unique needs. Its important to keep in mind, there is no right or wrong way to think about setting asset replacement budgets; rather, the emphasis should be on what staff & council believe is best for the Town.
In terms of next steps, staff & council could consider selecting one of the asset replacement budget scenarios shared within this report. After clarity is obtained on the desired scenario, it is recommended that a long-term financial strategy be developed to help illustrate to staff & council the financial impact of that scenario. After the financial strategy is finished, staff & council can then determine if the preferred scenario is financially feasible or not. If it is not financially feasible, a new scenario can be selected & financial strategy can be developed. Its important to keep iterating on this until staff & council are happy with both the future risk & levels of service as well as the financial impact to the Towns citizens. Overall, the financial strategy is important as it provides the Town a road map on how the organization can move from its current asset replacement budget to the identified asset replacement budget for the preferred scenario modeled. Ultimately, this will help ensure the Town has a plan to begin to bridge its asset funding gap and will help the Town more towards a more financially sustainable future.
It's also important to recognize that asset management is a continual improvement process that involves continual investment by the Town in order to improve its asset management capacity. In addition to developing a financial strategy, the Town may want to consider developing an asset management & financial policy. This will help ensure future staff & council have clarity on the direction set for by this council & staff. Its could also be beneficial for the Towns to review its asset inventory data to see if there is an opportunity for improvement. In particular, obtaining more detailed asset inventory data on buildings could help calibrate the plan further. And finally developing an annual reporting template would help the Town monitor & measure progress on asset management funding year to year which would help keep asset management top of mind and help the organization see how it is progressing towards the funding target selected.
Cory Sivell, CEO @ YourCity
Introduction
Context
Before the Town considers Asset Replacement Funding Plan results, it is important to understand the asset management environment across Canada to help provide context for this project and the Town. Historically, local governments have been very effective at financial planning for operation and maintenance costs, but many do not fully plan for the replacement of their capital assets. As a result, many local government assets are now nearing or at the end of their life and officials are left asking how they can financially plan for the replacement of these assets in a responsible manner. In short, the Town is not alone in the desire to improve the way the organizes plans for the replacement of assets.
Asset management has gained significant traction in recent years and national recognition across Canada, with organizations such as UBCM, GFOA, and FCM developing education and grant subsidy programs to support local governments in increasing their asset management capacity.
With a growing population and increased infrastructure investment to support that growth, Town of View Royal is in a similar position to many other local government throughout Canada with regard to asset replacement planning. Much of the infrastructure built to support the Town’s growth since 1988 will soon begin reaching the end of its estimated life, which presents a perfect opportunity for the Town to gain more clarity on the cost of infrastructure replacement to ensure service levels can be maintained for the Town’s citizens.
Improving the Town’s asset management capacity will present The Town with the invaluable opportunity to leave the community better than it was found by setting it up for long-term success, which will ensure future generations can enjoy the great infrastructure the community enjoys today.
What Is Asset Management?
Asset management is the process of integrating people, skills, and actions with information about the community's physical assets and financial resources to ensure long-term sustainable service delivery.
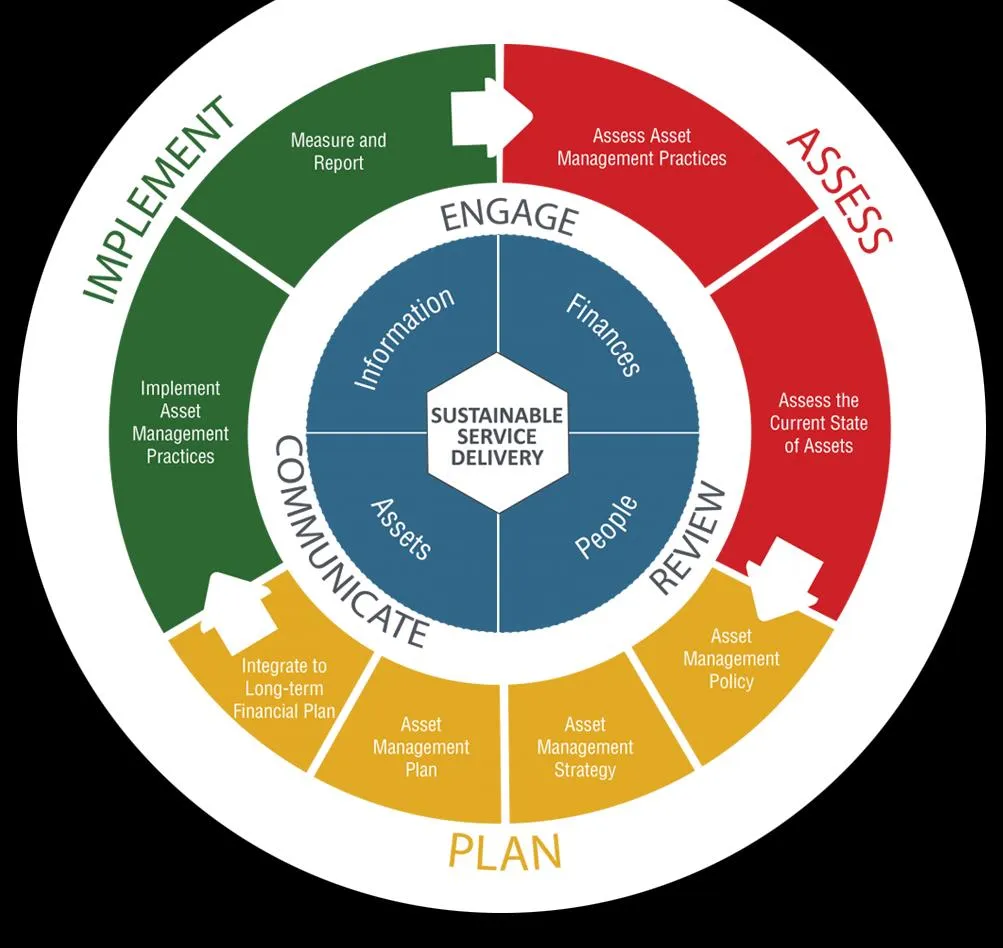
It is important to recognize that asset management involves many moving pieces, including financials, people, the assets, and information, which all work together to help sustainably deliver services.
It is also important to recognize that asset management is a continual improvement process. There is no right place to start or end on the framework; rather, the progression of the process is entirely based on the current state of the community and the Town’s unique objectives. Asset management capacity takes time to improve, but with time, investment, and dedication the development of solid asset management practices will set the Town on a course for long-term success. Use this framework as a guide as the organization as it explores how to further improve its asset management capacity.
Why is Asset Management Important?
There are many reasons why asset management is critical to local governments. Listed below are the three reasons that The Town may find most significant:
- Supports delivery of municipal services in a socially, environmentally, and economically responsible way.
- Helps prevent the need for large, one-off tax increases and encourages consistent tax increases.
- Is required for most grant funding applications.
Background
As part of the Town of View Royal’s 2019 – 2022 strategic plan, six strategic priorities were identified as illustrated below:
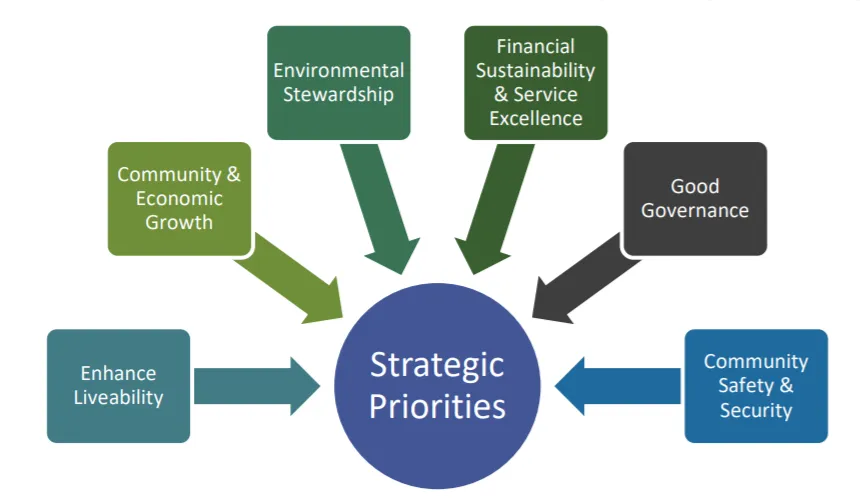
In particular, strategic priority D: Financial Sustainability & Service Excellence identified that the Town’s citizens want:
- Good value for tax dollars
- Funding for continuation of current service levels through taxation (52% of survey respondents said "increase taxes to maintain services at current levels“ was a priority)
- Funding for future large projects through putting aside funds annually (68% of survey respondents indicated that "Putting aside funds each year to fund future large projects“ was a priority)
In order to support this need, the Town’s staff and council identified the need to complete two projects. The first project is the development of an asset management plan that considers options to minimize the infrastructure deficit. The second project focuses on the development of a long-term financial strategy that incorporates the funding implications from the asset management plan.
Staff determined that the Asset Replacement Funding Plan was the first strategic step to help the Town better understand the funding required to minimize the infrastructure deficit. In order to support the funding of this project, staff receive grant funding through UBCM.
The Project
The Asset Replacement Funding Plan is focused on identifying the average annual replacement budget required to meet future risk and levels of service performance targets. The asset replacement funding plan directly informs the funding levels in the Town’s five-year financial plan, five-year capital plan, and long-term asset replacement financial strategy.
The goal of this project is to achieve the following outcomes:
- Awareness: Staff & council will understand the importance of asset management and long-term financial planning.
- Understand Risk and Levels of Service: Staff & council will understand how to measure the trade-offs between risk, levels of service, and funding levels.
- Clarity: Staff & council will have clarity on the average annual asset replacement budget required to meet the Town’s future risk and levels of service performance targets
- Confidence In Financial Future: Staff & council will be able to understand the impact funding decisions today, have on the future of the Town’s assets.
Common Challenges
YourCity Staff has identified common challenges through working with various local governments:
- Challenge 1: Unrealistic budgets – YourCity found that a majority of plans focused on setting unrealistic budgets, which left local government staff and council struggling to bridge their current funding gap.
- Challenge 2: Asset Management Plans remained unfunded – YourCity found that a majority of plans focused on setting replacement budgets, but these budgets were rarely integrated into a financial strategy, meaning the plans remained unfunded.
- Challenge 3: Difficult to show trade-offs between risk and levels of service – YourCity found that significant analysis was needed to understand the trade-offs between risk, levels of service, and funding targets, analysis that was often unaffordable for small and medium-sized local governments.
- Challenge 4: Difficult to make funding decisions – YourCity found that most plans did not properly illustrate the future impact of funding decisions, which made it difficult to think long-term and instill confidence in the financial future.
YourCity discovered a method to successfully eliminate these common challenges -- our Asset HealthScore Framework.
Our Approach
The Asset HealthScore Framework (Figure C) is a unique and proven process that allows the Town to integrate and visualize the trade-offs between risk, levels of service, and funding so that staff and council can set replacement budgets with confidence.
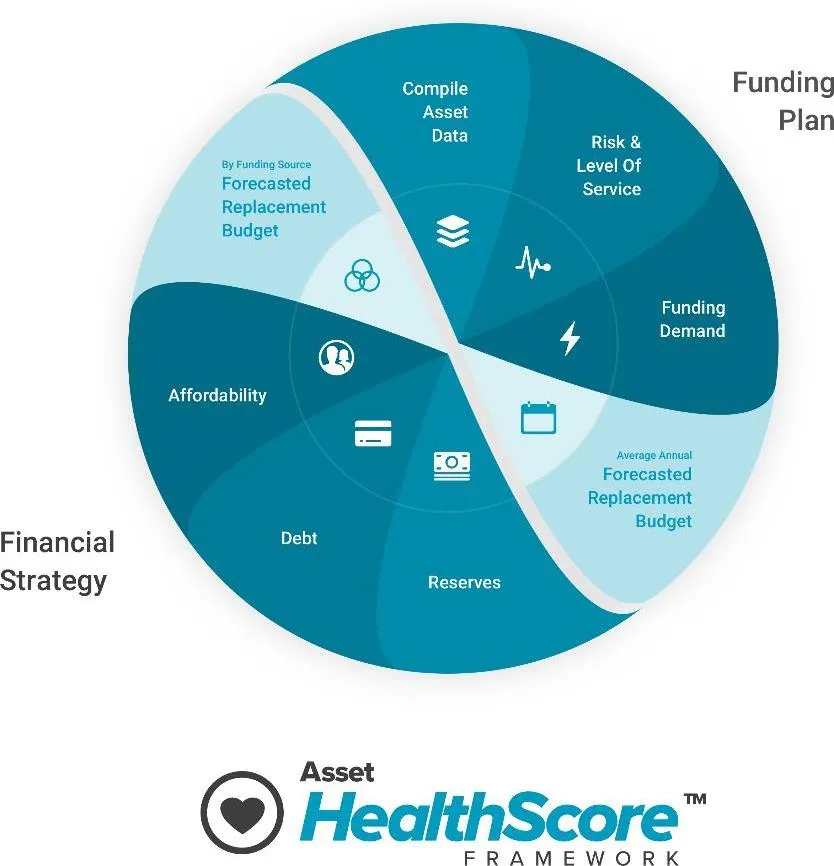
The framework consists of two core phases:
- Phase 1: Asset Replacement Funding Plan is focused on identifying the average annual investment required to meet the Town’s future risk and levels of service goals. Phase 1 is focused on answering the question “What is the required funding level to sustain assets based on the desired future state?”.
- Phase 2: Asset Replacement Financial Strategy is focused on developing the financial strategy to bridge the funding gap. This strategy will help the Town understand how to move from current funding levels to the proposed funding levels developed in Phase 1 by considering reserves, debt, and affordability. Phase 2 is not within the scope of this project but could be considered as a strategic next step.
Important Assumptions
- Like for Like Replacement Only: This plan was developed only considering like for like replacements and does not consider levels of service increases, regulatory requirements, or technology changes.
- Constant Dollar Analysis: The model was developed using constant dollar analysis. This means that inflation is not accounted for in future costs.
- Assets Included: The assets that are included in this study include Sewer, Transportation, Land Improvements, Buildings, and Drainage.
Phase 1: Asset Replacement Funding Plan
Step 1: Compile Asset Data
Why it is Important: Asset data is the foundation that informs the funding demand, risk, and level of service key performance indicators and the forecasted asset replacement budget.
What it is: List of assets that are owned by the Town, including attribute information that is needed to build the asset replacement funding plan such as replacement cost, installation year, and estimated life.
Outcome: Asset inventory that can be used to develop the Asset Replacement Funding Plan.
The steps followed to compile and build the asset inventory:
- Identify & Compile Existing Inventory: Tangible Capital Asset (TCA) data and Statement of Values.
- Bridge The Data Gap: Indexed historical costs to current costs using ENR cost indices; updated replacement costs with statement of values and current budgets.
- Clean Asset Data and Integrate Into the Model: Converted existing asset inventory data into a database format.
Step 2: Funding Demand
Why it is Important: Helps the Town understand when assets will be past their estimated life, informing the funding plan and financial strategy.
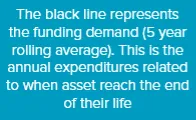
What it is: Represents the average annual investment required to replace assets when they reach the end of their estimated life over the planning period (30 years). It uses a five-year rolling average to understand waves of expenditure.
Outcome: Goal is for staff and council to understand how replacement funding demand changes over time and which Capital Funds drive most replacements.
Figure 1.0: Average Annual Funding Demand By Asset Category
| Category | Avg Funding Demand | % of Total |
|---|---|---|
| Total | $ 1,697,923 | 100% |
| Sewer Capital Fund | $ 88,912 | 5% |
| General Capital Fund | $ 1,609,010 | 95% |
| Transportation | $ 1,042,909 | 61% |
| Land Improvements | $ 331,016 | 19% |
| Buildings | $ 221,543 | 13% |
| Drainage | $ 13,542 | 1% |
Observations
- General Capital Fund represents majority of the funding demand (95%).
- Within the General Capital Fund, Transportation is a major driver (61%).
Figure 1.2: Funding Demand For General & Sewer Capital Fund (5 Year Rolling Average)
Observations
- Funding demand is below average in years 1-15 and years 21-25.
- Funding demand is above average in years 15-21 and years 25-30.
- There is a wave of expenditure of approximately 15 years.
- Highlights the importance of using debt and reserves to smooth taxation levels.
Step 3: Risk & Levels of Service
Why it is Important: Helps prioritize limited asset replacement budgets and quantifies the impact of decisions on the Town's ability to deliver services.
What it is: Risk represents the relative impact of asset failure (safety, environment, finances, reputation). Levels of Service represents the relative quality desired from the service. Performance is measured using Asset HealthScore, Past Life Asset, and Consumption Ratio.
Outcome: Goal is to help staff and council understand how risk/service will be measured, identify critical assets, and achieve clarity on category importance based on scores.
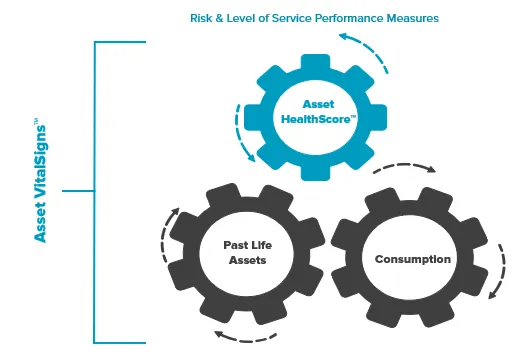
Figure 2.0: Risk & Levels of Service Performance Measures
- Past Life Assets - represents the percentage of asset portfolio’s value that is past its estimated service life.
- Consumption - represents how far the asset is into its estimated life.
- Asset HealthScore - represents the overall health of assets, informed by both past life assets and consumption ratio.
Figure 2.1: Asset HealthScore Table (Correlation between Past Life and Consumption)
The Asset HealthScore is a value from 0% to 100% determined by looking up the intersection of Consumption (vertical) and Past Life Assets (horizontal). Higher HealthScores occur when both Consumption and Past Life percentages are low.
Figure 2.4: Current Risk & Levels of Service Key Performance Indicators
| Category | Replacement Cost | Past Life Assets | Consumption Ratio | Asset HealthScore |
|---|---|---|---|---|
| Total | $ 138,694,480 | 4% | 33% | 96% |
| Sewer Capital Fund | $ 29,235,603 | 1% | 31% | 96% |
| General Capital Fund | $ 109,458,868 | 4% | 34% | 96% |
| Transportation | $ 53,218,530 | 1% | 32% | 96% |
| Land Improvement | $ 6,929,992 | 43% | 89% | 28% |
| Buildings | $ 11,704,576 | 9% | 37% | 92% |
| Drainage | $ 37,605,769 | 1% | 25% | 97% |
Observations
- Total infrastructure value is approximately $139 million.
- ~80% of value ($109M) is in the General Capital Fund.
- ~4% ($5.5M) of assets are past expected life.
- Assets are about one-third into their estimated life span.
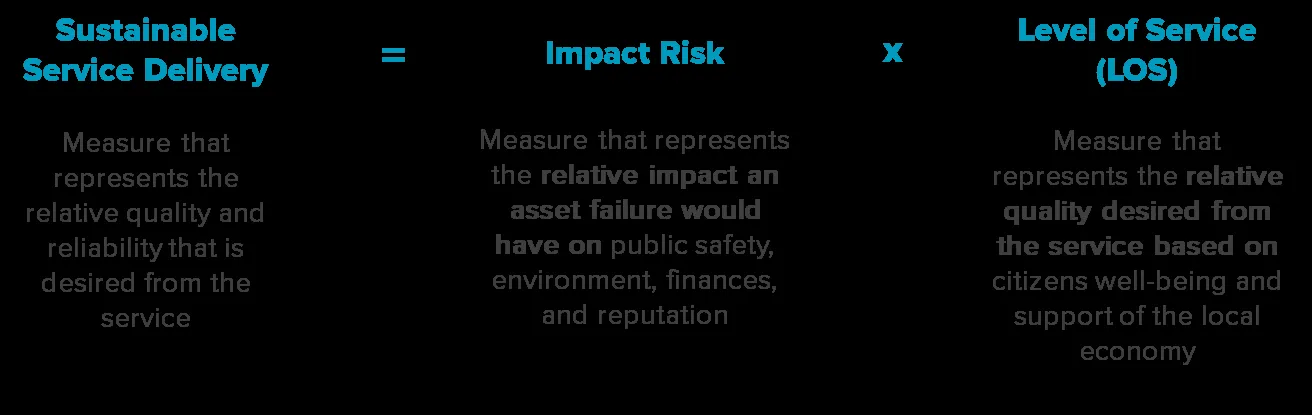
Sustainable Service Delivery Score
Sustainable service delivery score represents the relative quality and reliability desired from a service.
- Impact Risk: Relative impact of failure on safety, environment, finances, and reputation.
- Level of Service (LOS): Relative quality desired based on citizen well-being and the local economy.
Figure 2.10: Impact Risk Framework Summary
| Category | Public Safety (Weight 5) | Environment (Weight 4) | Financial (Weight 3) | Reputation (Weight 3) | Weighted Score (out of 15) |
|---|---|---|---|---|---|
| Sewer | 4 | 3 | 4 | 4 | 4 |
| Drainage | 2 | 3 | 2 | 2 | 2 |
| Transportation | 4 | 2 | 4 | 3 | 3 |
| Buildings | 3 | 2 | 4 | 2 | 3 |
| Land Improvement | 2 | 1 | 1 | 1 | 1 |
Figure 2.15: Levels of Service Framework Summary
| Category | Benefit (Weight 2) | Criticality (Weight 4) | Economy (Weight 3) | Weighted Score (out of 9) |
|---|---|---|---|---|
| Sewer | 5 | 5 | 4 | 5 |
| Drainage | 3.5 | 4 | 2 | 3 |
| Transportation | 4 | 4 | 5 | 4 |
| Buildings | 2 | 3 | 3 | 3 |
| Land Improvement | 1 | 2 | 1 | 1 |
Figure 2.16: Sustainable Service Delivery Score Matrix
| Impact Risk \ LOS | 1 | 2 | 3 | 4 | 5 |
|---|---|---|---|---|---|
| 1 | 1 | 2 | 3 | 4 | 5 |
| 2 | 2 | 4 | 6 | 8 | 10 |
| 3 | 3 | 6 | 9 | 12 | 15 |
| 4 | 4 | 8 | 12 | 16 | 20 |
| 5 | 5 | 10 | 15 | 20 | 25 |
Score Groupings: 1-6 = Low; 7-15 = Medium; 16-25 = High.
Figure 2.17: Service Sustainability Score Summary
| Category | Risk | LOS | SD Score | Category |
|---|---|---|---|---|
| Sewer | 4 | 5 | 17 | HIGH |
| Drainage | 2 | 3 | 7 | LOW |
| Transportation | 3 | 4 | 14 | MEDIUM |
| Buildings | 3 | 3 | 8 | LOW |
| Land Improvement | 1 | 1 | 2 | LOW |
Step 4: Forecasted Asset Replacement Budget
Why it is Important: Provides staff and council confidence in allocating budgets between asset categories and funds by understanding trade-offs.
What it is: Represents total average annual investment into asset replacement (includes tax, rate, and debt funded replacements).
Outcome: Staff and council understand the impact of different budgets on future risk and service performance measures.
Figure 3.2: Forecasted Asset Replacement Budget Scenario Summary
| Scenario | Goal |
|---|---|
| Scenario 1 | Current average annual reserve contribution continues in perpetuity. |
| Scenario 2 | Keep future risk and service similar to current levels (HealthScore today ≈ HealthScore future). |
| Scenario 3 | Target overall HealthScore of 80% and <15% past estimated life. |
| Scenario 4 | Target overall HealthScore of 55% and <25% past estimated life. |
Scenario 1: Current Average Annual Reserve Contribution
Scenario Description: Assumes current average annual reserve contribution ($456,800) continues in perpetuity.
Figure 4.1: Forecasted Asset Replacement Budget Summary (Scenario 1)
| Fund | Forecasted Budget | % of Total |
|---|---|---|
| Total | $ 456,800 | 100% |
| Sewer Capital Fund | $ 86,800 | 19% |
| General Capital Fund | $ 370,000 | 81% |
Figure 4.2: Impact of Forecasted Budget on Asset VitalSigns (Scenario 1)
| Category | Starting HealthScore | Final HealthScore | Score | Sustainability Category |
|---|---|---|---|---|
| Total | 96% | 37% | - | - |
| Sewer Capital Fund | 96% | 93% | 17 | HIGH |
| General Capital Fund | 96% | 30% | - | - |
Observations
- HealthScore drops significantly from 96% to 37% by the end of the 30-year period.
- General Capital Fund experiences the largest drop (96% to 30%).
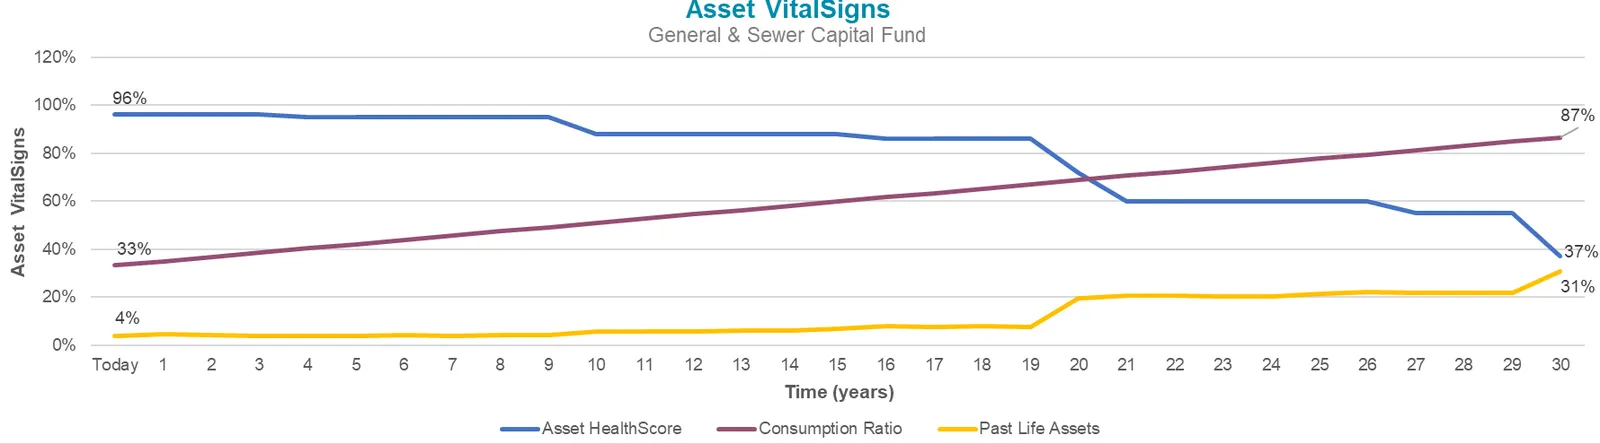
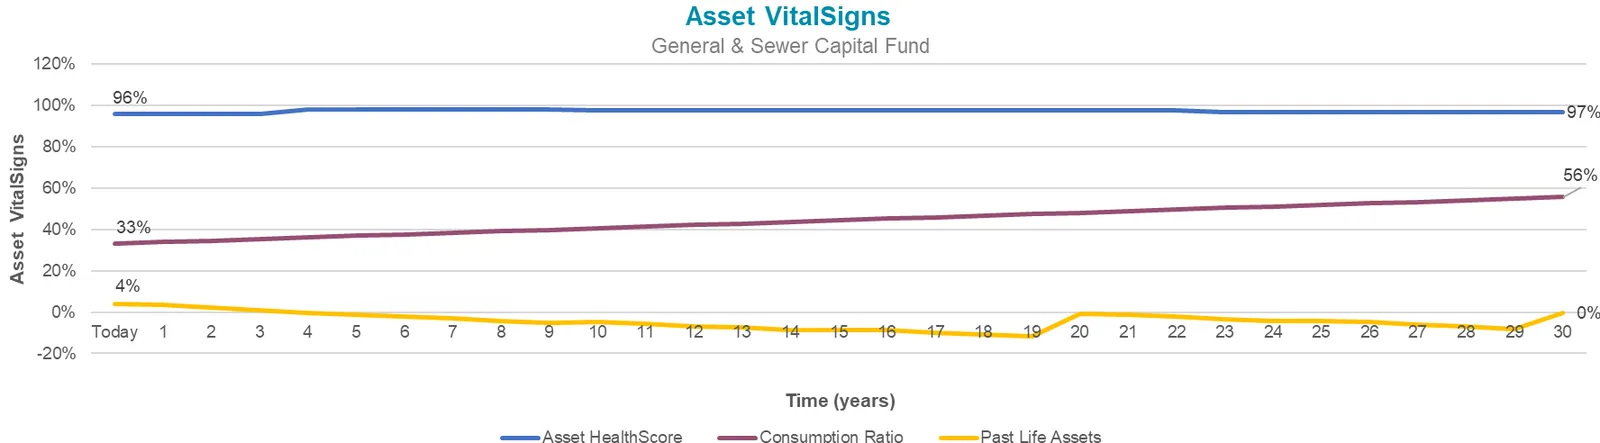
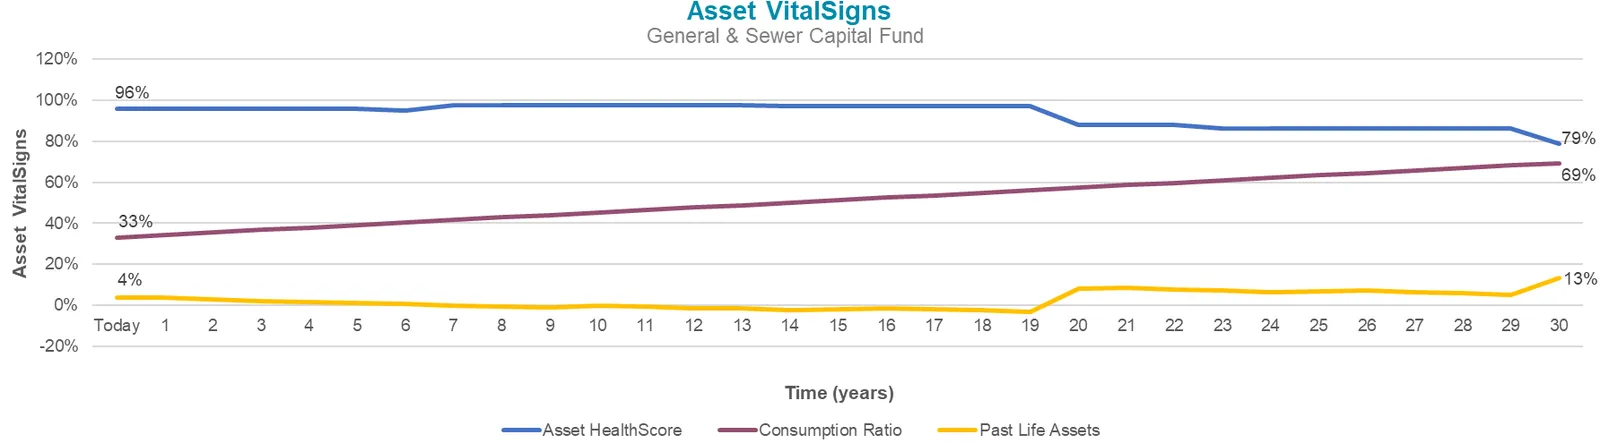
Figure 6.0: Asset Replacement Funding Gap (Scenario 1)
| Fund | Current Budget | Forecasted Budget | Funding Gap |
|---|---|---|---|
| Total | $ 456,800 | $ 456,800 | $ - |
Scenario 2: Risk & Levels of Service Remains Similar
Scenario Description: Goal is to keep future risk and service levels similar to current levels.
Figure 4.1: Forecasted Asset Replacement Budget Summary (Scenario 2)
| Fund/Category | Forecasted Budget | % of Total |
|---|---|---|
| Total | $ 1,887,000 | 100% |
| Sewer Capital Fund | $ 150,000 | 8% |
| General Capital Fund | $ 1,737,000 | 92% |
| Transportation | $ 1,050,000 | 56% |
| Land Improvement | $ 350,000 | 19% |
| Buildings | $ 237,000 | 13% |
| Drainage | $ 100,000 | 5% |
Figure 4.2: Impact of Forecasted Budget on Asset VitalSigns (Scenario 2)
| Category | Starting HealthScore | Final HealthScore | score | Sustainability Category |
|---|---|---|---|---|
| Total | 96% | 97% | - | - |
| Sewer Capital Fund | 96% | 97% | 17 | HIGH |
| General Capital Fund | 96% | 94% | - | - |
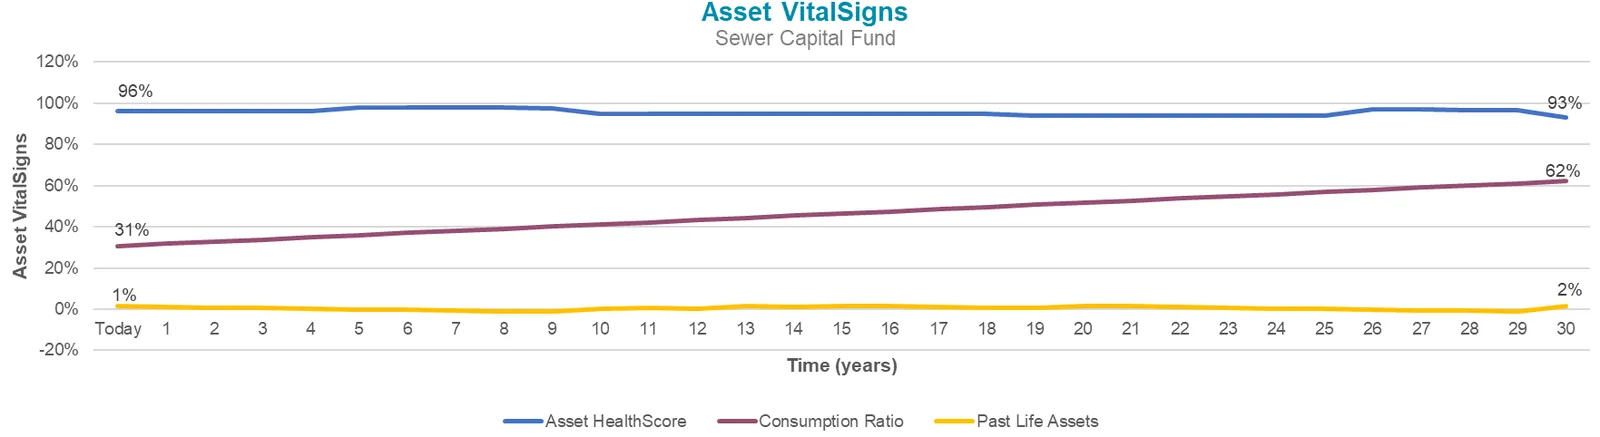
Figure 6.0: Asset Replacement Funding Gap (Scenario 2)
| Fund | Current Budget | Forecasted Budget | Funding Gap |
|---|---|---|---|
| Total | $ 456,800 | $ 1,887,000 | $(1,430,200) |
Scenario 3: Asset HealthScore Target of 80%
Scenario Description: Goal is to set an overall Asset HealthScore of 80% and allow ~15% of assets to exceed estimated life.
Figure 4.1: Forecasted Asset Replacement Budget Summary (Scenario 3)
| Fund/Category | Forecasted Budget | % of Total |
|---|---|---|
| Total | $ 1,251,214 | 100% |
| Sewer Capital Fund | $ 86,800 | 8% |
| General Capital Fund | $ 1,164,414 | 93% |
| Transportation | $ 711,722 | 57% |
| Land Improvement | $ 313,692 | 25% |
| Buildings | $ 139,000 | 11% |
| Drainage | $ 0 | 0% |
Figure 4.2: Impact of Forecasted Budget on Asset VitalSigns (Scenario 3)
| Category | Starting HealthScore | Final HealthScore | score | Sustainability Category |
|---|---|---|---|---|
| Total | 96% | 79% | - | - |
| Sewer Capital Fund | 96% | 93% | 17 | HIGH |
| General Capital Fund | 96% | 68% | - | - |
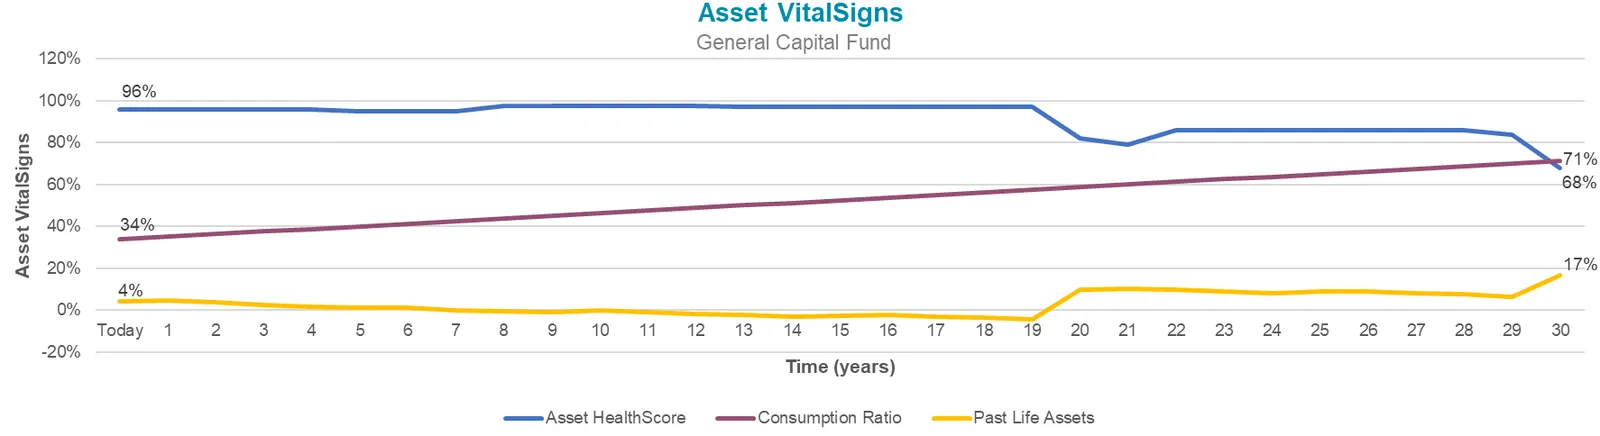
Figure 6.0: Asset Replacement Funding Gap (Scenario 3)
| Fund | Current Budget | Forecasted Budget | Funding Gap |
|---|---|---|---|
| Total | $ 456,800 | $ 1,251,214 | $(794,414) |
Scenario 4: Asset HealthScore Target of 55%
Scenario Description: Goal is to target an overall HealthScore of 55% and allow 25% of assets to exceed estimated life.
Figure 4.1: Forecasted Asset Replacement Budget Summary (Scenario 4)
| Fund/Category | Forecasted Budget | % of Total |
|---|---|---|
| Total | $ 726,800 | 100% |
| Sewer Capital Fund | $ 86,800 | 12% |
| General Capital Fund | $ 640,000 | 88% |
| Transportation | $ 350,000 | 48% |
| Land Improvement | $ 215,000 | 30% |
| Buildings | $ 75,000 | 10% |
| Drainage | $ - | 0% |
Figure 4.2: Impact of Forecasted Budget on Asset VitalSigns (Scenario 4)
| Category | Starting HealthScore | Final HealthScore | score | Sustainability Category |
|---|---|---|---|---|
| Total | 96% | 55% | - | - |
| Sewer Capital Fund | 96% | 93% | 17 | HIGH |
| General Capital Fund | 96% | 37% | - | - |
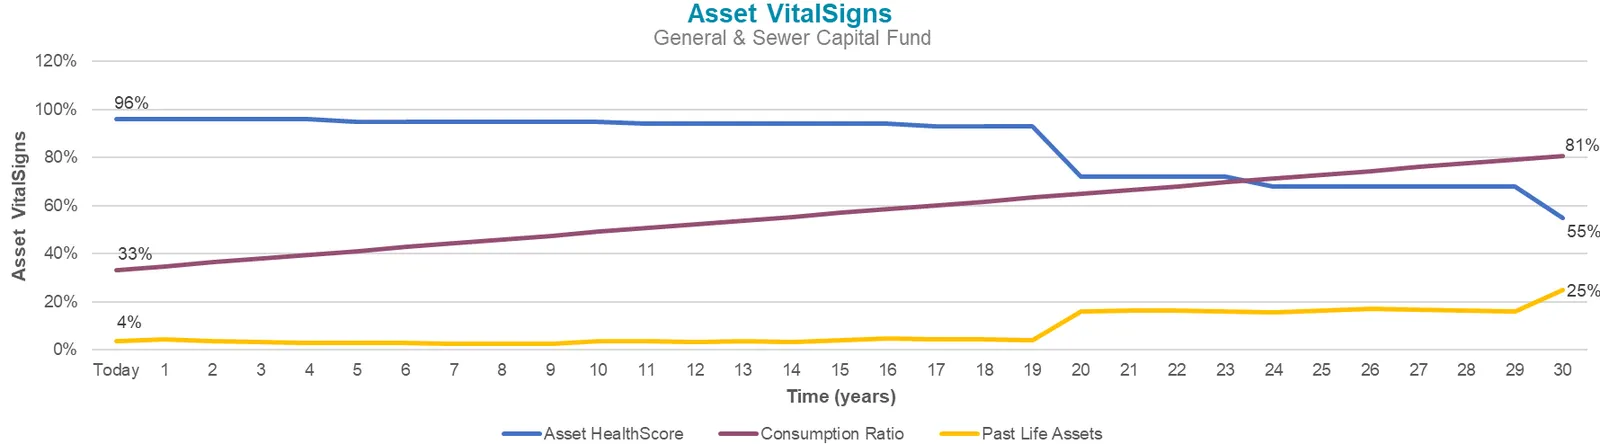
Figure 6.0: Asset Replacement Funding Gap (Scenario 4)
| Fund | Current Budget | Forecasted Budget | Funding Gap |
|---|---|---|---|
| Total | $ 456,800 | $ 726,800 | $(270,000) |
Summary
Concluding Remarks
Town of View Royal has done an exceptional job at keeping its infrastructure maintained to date and now has an opportunity to plan for long-term capital asset replacements. By planning for future asset replacements today, the Town can have confidence that its assets can provide great service to the citizens and promote stable and consistent taxes and rates, today and into the future.
Asset Management is a continual improvement process that requires time, investment, and champions within the organization to ensure it lives beyond the current staff and council. Below are a few suggested next steps as the Town begins to explore how it can continue to improve its asset management capacity beyond this project.
- Asset Replacement Financial Strategy & Policy: The financial strategy would provide the Town the road map to move from the current asset replacement budget to the set asset replacement budget from phase 1. The financial strategy will answer the question “how will the Town fund the replacement budget?” by considering reserves, debt, and affordability. The policy would help document the thinking behind the strategy and provide focus moving forward.
- Annual Reporting Template: An annual reporting template would allow the Asset Replacement Funding Plan information to be presented annually to staff and council in standard format. This would allow the Town to be able to monitor and measure progress over time and observe trends.
- Improve Data: Over time, it is always important to improve asset inventory data, which could include collecting a more detailed inventory, improving replacement costs and estimated life spans. In particular, the Town could benefit from reviewing the land improvement data and having more detailed facility inventory data.
Cory Sivell, CEO @ YourCity
Document Images
(9)


Step 1 graphic: Compile Asset Data icon.
Step 2 graphic: Funding Demand icon.
Text snippet from chart: "The black line represents the funding demand (5 year rolling average). This is the annual expenditures related to when asset reach the end of their life".
Step 3 graphic: Risk & Levels of Service icon.
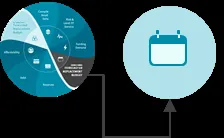
Step 4 graphic: Forecasted Asset Replacement Budget icon.
Step 4 graphic (alternative/icon view).