Asset Replacement Funding Plan Presentation by YourCity
A detailed technical presentation by YourCity consulting regarding the Asset HealthScore framework and four funding scenarios for municipal assets.
Asset Replacement Funding Plan Presentation
Prepared By: YourCity Prepared For: Town of View Royal June 2021
Summary For Todays Conversation
- Introduction
- Asset Replacement Funding Plan
- Summary
Introduction
National Context

Why is Asset Management Important?
- Supports delivery of municipal services in a socially, environmentally, and economically responsible way.
- Helps prevent the need for large, one-off tax increases and encourages consistent tax increases.
- Is required for most grant funding applications.
Local Context
Strategic Priorities
Town of View Royal's 2019 – 2022 Strategic Plan
Strategic priority D: Financial Sustainability & Service Excellence identified that the Town's citizens want:
- Good value for tax dollars
- Funding for continuation of current service levels through taxation (52% of survey respondents said "increase taxes to maintain services at current levels" was a priority)
- Funding for future large projects through putting aside funds annually (68% of survey respondents indicated that "Putting aside funds each year to fund future large projects" was a priority)
Background
- Challenge 1: Unrealistic budgets
- Challenge 2: Asset Management Plans remained unfunded
- Challenge 3: Difficult to show trade-offs between risk and level of service
- Challenge 4: Difficult to make funding decisions
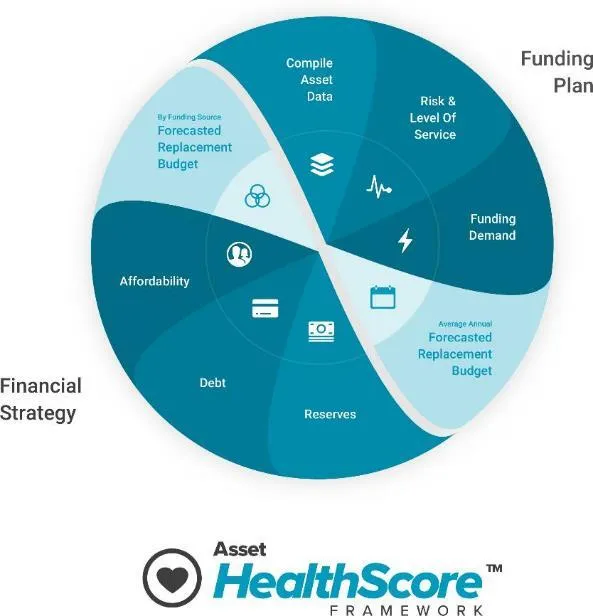
After repeatedly confronting these challenges, we were inspired to explore potential solutions. From these efforts, we discovered a method to successfully eliminate these common challenges -- our Asset HealthScore Framework.
Important Assumptions
- Like for Like Replacement Only: This plan was developed only considering like for like replacements and does not consider level of service increases, regulatory requirements, or technology changes.
- Constant Dollar Analysis: The model was developed using constant dollar analysis. This means that inflation is not accounted for in future costs.
- Assets: The assets that are included in this study include; sewer, transportation, land improvements (i.e parks), buildings, drainage
Asset Replacement Funding Plan
Step 1: Compile Asset Data

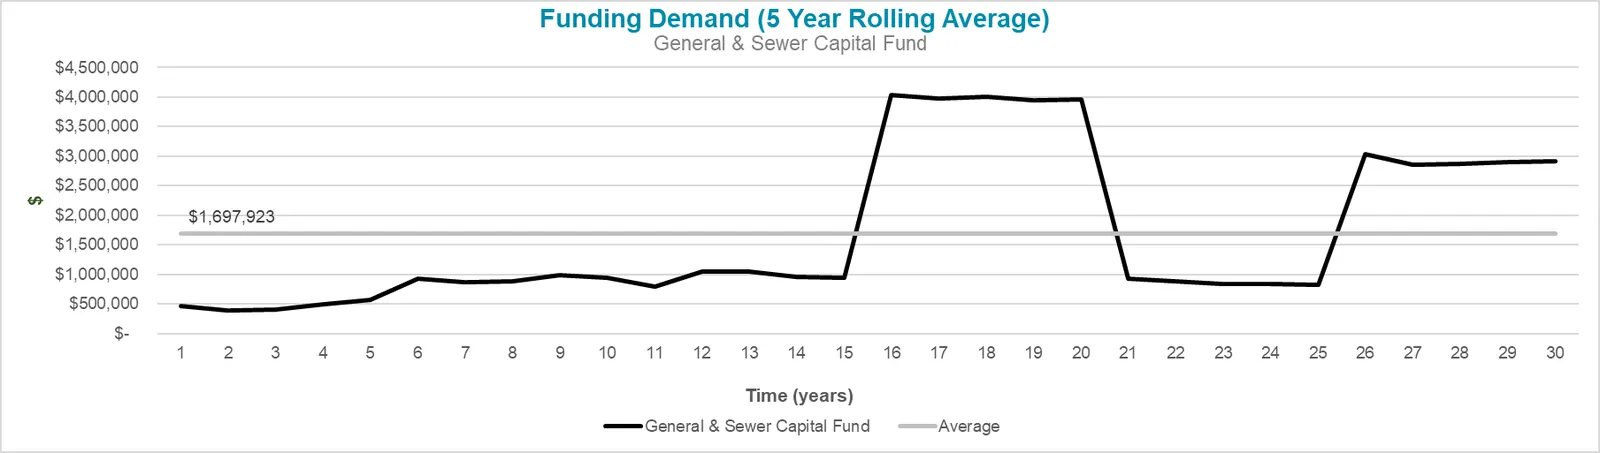
Step 2: Funding Demand

Step 3: Risk & Level of Service

Risk and Level of Service Performance Measures
Asset VitalSigns consist of:
- Asset HealthScore
- Past Life Assets
- Consumption
"let's keep taxes low" to "let's keep assets healthy" (While considering affordability)
Example
Bucket Metaphor:
- Rate of Investment: Water filling the bucket
- HealthScore: The current water level
- Rate of Deterioration: Water leaking from the bottom
- Consumption: Water used from the bucket
- Past Life Asset: Water remaining at the very bottom
Correlation Between Asset VitalSigns and Risk and Level of Service
| Asset HealthScore | Past Life & Consumption Ratio | Risk of Failure & Level of Service |
|---|---|---|
| Upward Trend | Downward Trend | Downward Trend Risk / Upward Trend Level of Service |
| Downward Trend | Upward Trend | Upward Trend Risk / Downward Trend Level of Service |
Example Comparison
| Category | Asset HealthScore | Past Life % | Consumption Ratio % | Risk of Failure | Level of Service |
|---|---|---|---|---|---|
| Transportation | 82% | 10% | 50% | Downward | Upward |
| Parks | 58% | 30% | 50% | Upward | Downward |
Example
Asset Value
$139M Asset Replacement Value
Risk and Level of Service Performance Measures
- Asset HealthScore: 96%
- Past Life Assets: 4%
- Consumption: 33%
Step 4: Forecasted Asset Replacement Budget
Asset Replacement Budget Scenario Summary
| Scenario Name | Scenario Description |
|---|---|
| Scenario 1: Current Average Annual Reserve Contribution | Current average annual reserve contribution would continue in perpetuity |
| Scenario 2: Risk & Level of Service Remains Similar | Asset HealthScore (Starting) = Asset HealthScore (Final) |
| Scenario 3: Asset HealthScore Target 80% | Reduce Asset HealthScore from 96% to 80% (15% Past Life, 70% Consumption) |
| Scenario 4: Asset HealthScore Target 55% | Reduce Asset HealthScore from 96% to 55% (25% Past Life, 80% Consumption) |
Scenario 1
- Scenario Name: Current Average Annual Reserve Contribution
- Scenario Description: Reserve contributions from 2020 to 2025 financial plan (annual reserve contribution)
- Forecasted Budget: $456,800
- Impact Over Time: Asset HealthScore drops from 96% to 37%. Past Life increases from 4% to 35%, and Consumption increases from 33% to 90%.
- Asset Replacement Funding Gap:
- Current Budget: $456,800
- Forecasted Budget: $456,800
- Funding Gap: $0
Scenario 2
- Scenario Name: Risk & Level of Service Remains Similar
- Scenario Description: The goal of this scenario is to keep the risk & level of service in the future similar to the current level. To achieve this the Asset HealthScore today should be similar to the Asset HealthScore in the future.
- Forecasted Budget: $1.89M
- Impact Over Time: Asset HealthScore remains stable at 96% to 97%. Past Life drops to 0%, and Consumption increases to 56%.
- Asset Replacement Funding Gap:
- Current Budget: $456,800
- Forecasted Budget: $1.89M
- Funding Gap: ($1.43M)
Scenario 3
- Scenario Name: Asset HealthScore Target 80%
- Scenario Description: Reduce Asset HealthScore from 94% to 80% (Allow 15% of Assets To Past their Estimated Life)
- Forecasted Budget: $1.25M
- Impact Over Time: Asset HealthScore drops from 96% to 79%. Past Life increases to 13%, and Consumption increases to 69%.
- Asset Replacement Funding Gap:
- Current Budget: $456,800
- Forecasted Budget: $1.25M
- Funding Gap: ($794,414)
Scenario 4
- Scenario Name: Asset HealthScore Target 55%
- Scenario Description: Reduce Asset HealthScore from 94% to 55% (Allow 25% of the Assets to Go Past Their Estimated Life)
- Forecasted Budget: $726,800
- Impact Over Time: Asset HealthScore drops from 96% to 55%. Past Life increases to 25%, and Consumption increases to 81%.
- Asset Replacement Funding Gap:
- Current Budget: $456,800
- Forecasted Budget: $726,800
- Funding Gap: ($270,000)
Summary
Forecasted Budget Scenario Comparison
- Scenario 01: Status Quo
- Asset HealthScore: 37%
- Past Life: 35%
- Consumption: 90%
- Scenario 02: Similar Risk & Level of Service
- Asset HealthScore: 96%
- Past Life: 0%
- Consumption: 56%
- Scenario 03: Asset HealthScore Target 80%
- Asset HealthScore: 79%
- Past Life: 13%
- Consumption: 69%
- Scenario 04: Asset HealthScore Target 55%
- Asset HealthScore: 55%
- Past Life: 25%
- Consumption: 81%
Forecasted Asset Replacement Budget Scenario Comparison
- Scenario 1: $456,800
- Scenario 2: $1.89M
- Scenario 3: $1.25M
- Scenario 4: $726,800
Asset Funding Gap Scenario Comparison
- Scenario 1: $0
- Scenario 2: $1.43M
- Scenario 3: $794,414
- Scenario 4: $270,000
Key Takeaways
- O&M vs. Capital Planning
- Great job at maintaining infrastructure to date & increasing reserve contributions
- Great job at planning (master plans, AM plans etc...)
- Opportunity to plan into the future to sustain assets & promote stable & consistent rate / tax increase.
- Asset VitalSigns
- The Ask: Time to reflect & think about:
- Desired Future Risk & Levels of Service?
- Integrate forecasted asset replacement budget into a long-term financial strategy.
Next Steps For Consideration:
- Asset Condition Assessments
- Asset Replacement Financial Strategy (2021 / 2022)
- Asset Management / Financial Policy (2021 / 2022)
- Annual Reporting Template
- Improve Data
Questions
Document Images
(6)
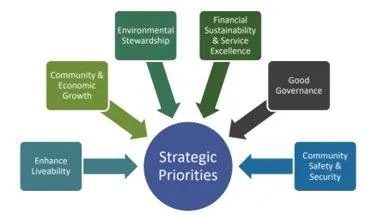
Diagram of Strategic Priorities
Line chart showing Funding Demand (5 Year Rolling Average) for General & Sewer Capital Fund over 30 years with an average of $1,697,923
Side view of a light blue vintage car representing an asset with high consumption and past life
Calendar icon callout highlighting Forecasted Replacement Budget