Sewer User Fee Options Presentation
A visual presentation summarizing the recommendations for a new sewer fee structure, including volumetric rates, user classes, and the $100 minimum account charge.
Core Housing Need
- Renters are about 5 times as likely to be in core housing need as owners; renter households represent 63% of households in core housing need, but only about 28% of all households.
- Core housing need provides a strong indicator of the need for non-market housing units. Overall, there were 355 households in core housing need in View Royal in 2016; 225 of these households (63%) were renters and 125 were owners. One hundred sixty households are in extreme core housing need, composed of 85 renters and 75 owners.
- As the increase in housing costs has been outpacing the increase in household incomes, this need likely remains the same or greater. Based on projections, as of 2019, the Town likely has a need for affordable units for approximately 229 renter households and 131 owner household in core housing need. There are a further 34 households currently on the BC Housing Registry who are also in immediate need of affordable housing assistance.
- This indicates a need for more than 200 non-market rental units, as well as programs and supports for affordable ownership.
Summary of Key Themes
High Cost of Housing
The increased cost of housing is outpacing income growth in View Royal. This is a regional and provincial issue. However, increasingly, even median-earning households are experiencing issues finding or retaining housing in View Royal.
Diversity of Housing Stock and Affordability
As a Town with predominantly single-family dwellings as the main form of housing, diverse and more affordable types of housing are not currently being built to support the ‘missing middle’ demographics: young and first-time homebuyers who are more likely to be able to afford townhomes or condominiums than single-family homes.
Purpose-Built Rental is Not Keeping Pace with Demand
Despite significant growth in purpose-built rental stock in View Royal in the last two years, the Town’s vacancy rate was 0.7% in October 2019. This points both to overall regional pressures around rental housing, and the demand for more rental in the Town and region.
Need for Non-Market Units
In 2016, there were 225 renter households in core housing need, with 85 of these households in extreme core housing need. As of 2019, estimates suggest there are at least 229 renter households, with 91 in extreme core housing need. There are a further 34 households currently on the BC Housing Registry. This indicates a need for an equivalent number of non-market or affordable units to support these residents.
Additionally, while the Town supports ongoing regional initiatives to address homelessness, the Fort Victoria site currently houses a number of vulnerable seniors on a semi-permanent basis who may have few or no other options for long-term housing in the Town or in the region. These residents are currently in recreational vehicles, which are not suited for long-term living.
Planning for Aging Population
Like many communities in Canada, View Royal is likely to experience a significant increase in older adults (65 and older) between 2020 and 2038. Our projections show that in a status quo growth scenario, by 2038 over one-third of households in View Royal will be led by adults older than 65. This indicates a strong need to continue to support the development of housing that will allow seniors to age in place, including considerations for accessible, access to transit and services, and more compact forms of growth.
1 INTRODUCTION
1.1 Project Overview
Like many communities in British Columbia (BC), View Royal has been facing housing pressures in recent years due to market conditions in the province and changing demographics. To better understand the challenges and how to respond to them, the Town initiated this Housing Needs Assessment (HNA) to build a more complete understanding of current and future housing needs in the community. This work will be used to inform community planning and to meet provincial regulations regarding Housing Needs Reports.
This report forms part of a larger study currently being conducted for the Town of View Royal. This report presents the quantitative component of the Housing Needs Report, which fulfills provincial requirements (see Section 1.2 for further information). The data collection and analysis contained in this report was conducted in fall and winter of 2019 and finalized in early 2020.
In December 2019, four key stakeholder workshops were held, as well as nine interviews with stakeholders who could not attend the focus groups. The findings of this qualitative research are contained in a separate Engagement Report, which was finalized in early 2020. Following on the quantitative and qualitative research, Urban Matters is conducting a review of key successful housing policies and actions undertaken by municipalities across BC to address housing needs and facilitate appropriate development to serve residents. This report is anticipated to be completed in Spring 2020.
1.2 Provincial Requirements for Housing Needs Reports
The Housing Needs Reports regulations require local governments to collect approximately 50 distinct kinds of data about current and projected population, household income, significant economic sectors, and currently available and anticipated units. All of the data required that is currently available has been collected and can be found in Appendix A. Several items have not yet been made available by the Government of BC and these are noted (e.g., historical BC Assessment data). Housing Needs Reports are also required to complete a summary form, included as an appendix to this report.
The Town of View Royal’s Housing Needs Assessment also contains data that goes beyond the requirements to better serve decision makers, planners, developers, non-profits, and residents to make informed decisions on housing need. The additional information includes analysis on the affordability gap for owners and renters, information on secondary suites provided by the Town of View Royal, and household projections (Appendix XXX) developed using Capital Regional District (CRD) population projections for the Town.
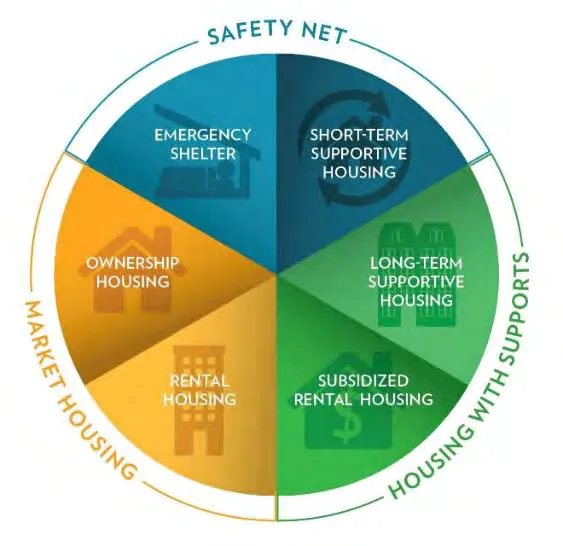
1.3 The Housing Wheelhouse
There are various housing options available to households of different income levels, ranging from emergency shelter to market ownership. In the past, these options have been thought of as falling along a linear spectrum, where households progress towards homeownership. This is called the “housing continuum”. However, in reality, people’s housing needs change throughout their lives and homeownership is not the ultimate goal for everyone.
Recognizing this, the City of Kelowna developed a “housing wheelhouse” model. This model demonstrates that progression through housing options may not always be linear, moving towards market home ownership. Rather, changes can occur in different directions and many people may not see homeownership as the ultimate goal for themselves or their families. The housing wheelhouse better accounts for the fluidity of housing options – over the course of one’s lifetime, an individual may flow between different forms of housing according to financial, family, health, and other considerations.
For example, under the traditional housing continuum, as their financial resources increase, an individual may move from subsidized rental housing, to market rental housing, to homeownership, where their journey ends. However, the housing wheelhouse recognizes that this may not be the end of the journey – this same individual may move into long-term supportive housing if their health deteriorates, or into subsidized housing if their financial resources decrease. Alternately, this individual may never access ownership housing in their lifetime, if it is not aligned with their goals or means.
Considering the wheelhouse approach can help local governments to respond to changing, more diverse housing needs.
Figure 1: Housing Wheelhouse (City of Kelowna, 2017)
1.4 Methods and Limitations
Quantitative Data
This HNA draws on both available statistical information on demographics and housing, in View Royal and the Capital Regional District (CRD). The CRD includes View Royal and the following municipalities: Sidney, North Saanich, Central Saanich, Saanich, Salt Spring Island, Southern Gulf Islands, Oak Bay, Victoria, Esquimalt, Colwood, Metchosin, Langford, Highlands, Sooke, and Juan de Fuca.
The information summarized and used within this report was collected from several datasets published by the Ministry of Municipal Affairs and Housing for the Housing Needs Reports in British Columbia. These datasets are from a number of sources, including a BC Custom Census dataset from the Statistics Canada (includes 2016, 2011, and 2006 censuses and 2011 National Household Survey); the Canada Mortgage and Housing Corporation (CMHC); BC Housing; Co-operative Housing Federation of BC; BC Assessment, and BC Statistics.
There are several limitations to this data. First, the custom Statistics Canada data used varies slightly from the standard Community Profiles available online. The primary difference is that the custom data counts only residents in private households, excluding a range of what are defined as ‘collective households.’ For Statistics Canada this includes military bases, which in the case of View Royal does impact the numbers somewhat. Commonly cited figures, such as population, have been aligned with Census Community Profile figures in this report wherever possible; however, in some cases reliance on custom data was necessary for analysis.
Additionally, the projections contained in this report are based on assumptions available to us today and represent a plausible base case should the assumptions remain true over time. Finally, as the 2011 National Household Survey was a voluntary survey, the data is considered less reliable and readers are encouraged to use the 2006 Census data for comparison purposes where possible.
Shelter costs in this report refers to CMHC’s definition which is the total monthly shelter cost paid by the household for their dwelling. For renters, shelter costs include rent and any payments for electricity, fuel, water, and other municipal services. For owners, shelter costs include mortgage payments (principal and interest), property taxes, and any condominium fees, along with payments for electricity, fuel, water, and other municipal services.
Stakeholder Engagement
Section 6 of this report summarizes key findings of stakeholder workshops and individual interviews conducted as part of the Housing Needs Assessment. It is intended to support the quantitative findings of the report by providing qualitative experience of housing players and users across the continuum.
The purpose of qualitative research (i.e. workshops and interviews) is to dig deeper into the housing needs, challenges and opportunities beyond what quantitative research (i.e. statistical analysis) alone can illustrate. For the Town’s HNA, four stakeholder workshops and nine interviews were hosted for key stakeholders to foster meaningful understanding and discussion with:
- housing users;
- housing providers;
- developers; and
- service providers.
Two workshops were held on November 28th at View Royal Council Chambers and an evening session at the View Royal Fire Hall. The fourth workshop was held on November 29th again at View Royal Council Chambers. The Fire Department was selected as they represent a cross-section of households with both new and long-term residents that own or rent in the Town of View Royal and may be representative of broader workforce housing needs. After the workshops, the project team hosted interviews with key stakeholders to expand on the insights had through workshops.
It should be noted that this approach is not necessarily statistically valid. However, a variety of stakeholders were selected to represent a diversity of perspectives.
1.5 Structure of this Report
This report contains the following sections and appendices in order to meet legislated requirements of for housing needs reports in British Columbia:
- Section 2: Community demographic profile and population/household projections
- Section 3: Income and economic profile
- Section 4: Housing profile
- Section 5: Gap analysis on housing needs
- Section 6: Other components of this study
- Appendix A: Glossary of Terms
- Appendix B: Required data to be collected for housing needs reports
- Appendix C: Completed summary form for housing needs reports
- Appendix D: Household projections
2 DEMOGRAPHIC PROFILE AND PROJECTIONS
This section contains information on the Town of View Royal’s demographic context: population, number of households, and community growth projection. The data was collected from the BC Custom Census (published by the Ministry of Municipal Affairs and Housing) for the 2006, 2011, and 2016 censuses and the 2011 National Household Survey.
The purpose of this section is to outline key trends and issues in the population as a whole, and specific demographic groups.
2.1 Population
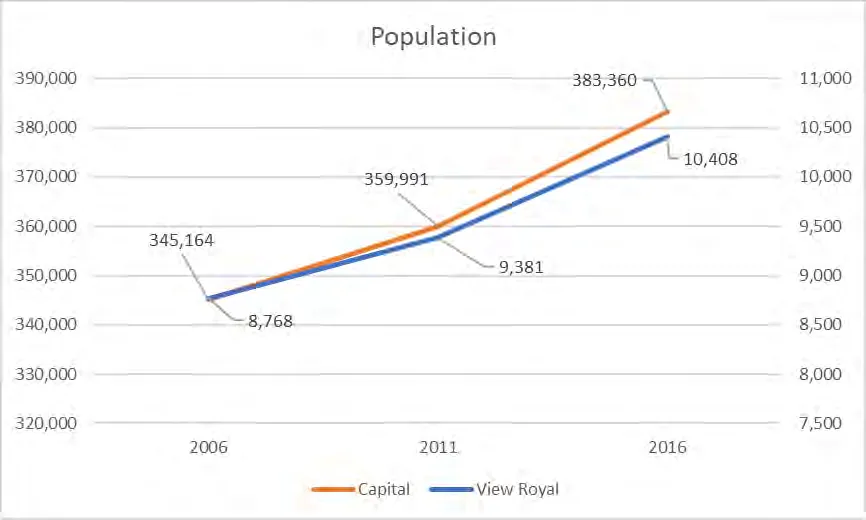
Between 2006 and 2016, View Royal grew 18.7%, representing 1,640 individuals. Proportionally, View Royal grew at a faster rate than the CRD’s 11.1%. Most of this growth was between 2006 and 2011 with a gain of 1,027 individuals (13%). From 2011 to 2016 the Town of View Royal’s population grew 660 (7 %).
Figure 2: Population Change, View Royal and CRD, 2006-2016
2.2 Age
The average and median age has risen from 2006 to 2011. The median age in the Town of View Royal has seen a modest rise from 41 years to 44 years old in 2016, which is comparable to the CRD’s median age of 45. The largest population segment is 45 to 64 years old (3,095 or 31% of the population) followed by those aged 25 to 44 years old (2,490 or 25%). The third largest population segment is those aged 19 years and under (2,105 or 21%). The two smallest populations segments are those 65 to 84 years old (1,545 or 16%) and 85 years and over (190 or 2%).
Proportionally, the population segments ratio are comparable between the Town of View Royal and the Capital Regional District with View Royal having a slightly larger proportion in the population group 19 years and under (21% vs. 18%); a smaller proportion for the age groups 20 to 24 years (5% vs. 7%) and 65 to 84 years (16% vs 18%); and shared proportion for those segments between 25 and 44 years and 85 years and over (25% and 2% respectively).
Figure 3: Population by Age in View Royal and the CRD, 2016
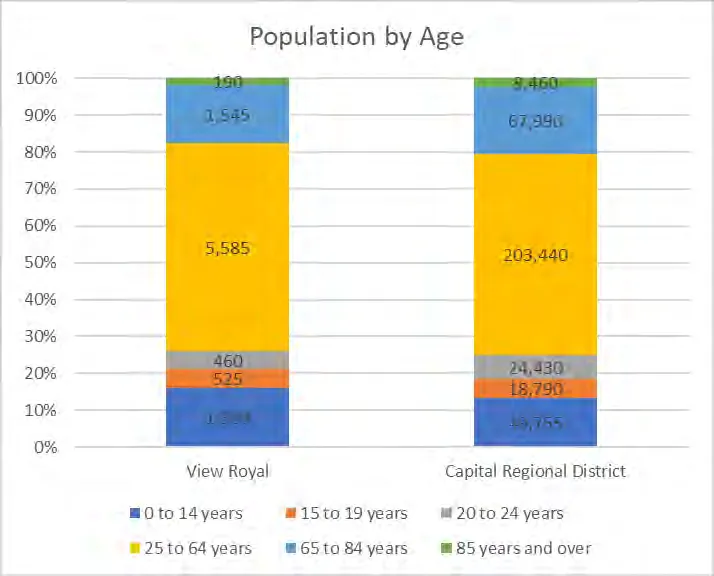
Figure 4: Change in Age Distribution in View Royal, 2006-2016
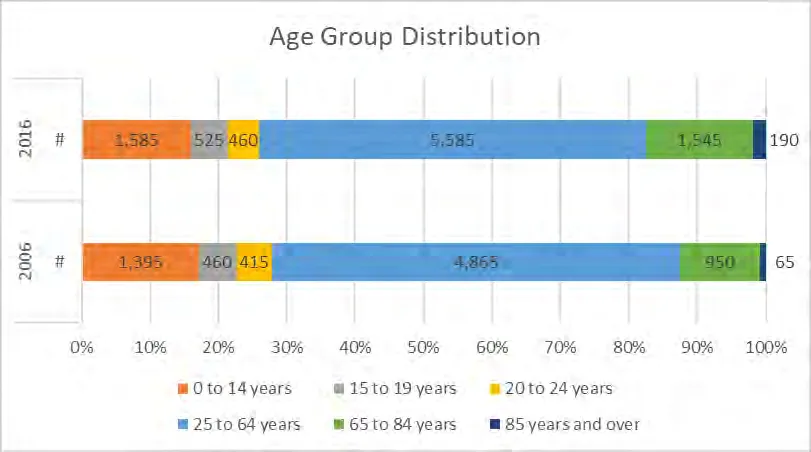
From 2006 to 2016 we have seen an overall increase in the number of residents in each age group within Royal. Proportionally, the age group of residents aged 25 to 64 years decreased by 4%, from 60% in 2006 to 56% in 2016. This growth was balanced by growth in the 65 to 84 year old age group, which expanded by 4% (from 12% to 16%). All other segments stayed relatively the same with 1% decreases in those aged 0 to 14 years (17% to 16%) and 15 to 19 years (6% to 5%). There was a 1% increase in those aged 85 and over (1% to 2%). The proportion of the population aged 20 to 24 years stayed at 5%.
2.3 Mobility
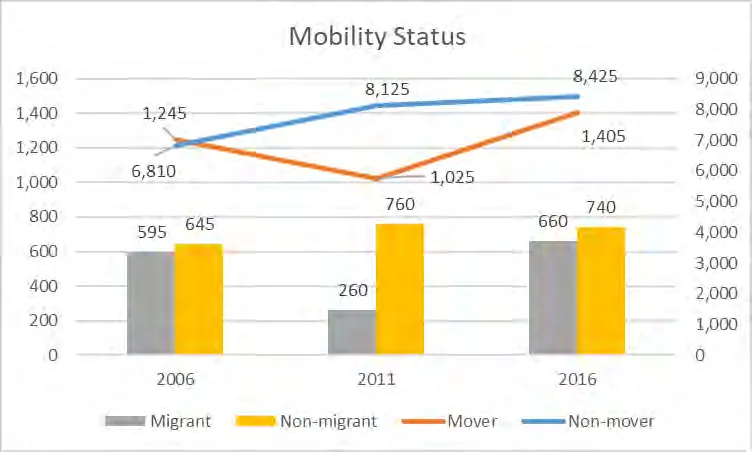
Between 2011 and 2016 about 1,400 residents (or 14.2%) moved in View Royal. About half (52.7%) moved within View Royal, while 660 (47.0%) moved from outside the community. However, between 2006 and 2011, of the 1,025 residents who moved, residents who moved in View Royal were much more likely to move within the community (74.1%) than move in from outside the community (25.4%). Non-migrants are persons who did move but remained in the Town of View Royal. Migrants include individuals who moved from another community, province, or nation.
Figure 5: Mobility Status for View Royal Residents, 2006-2016
2.4 Households
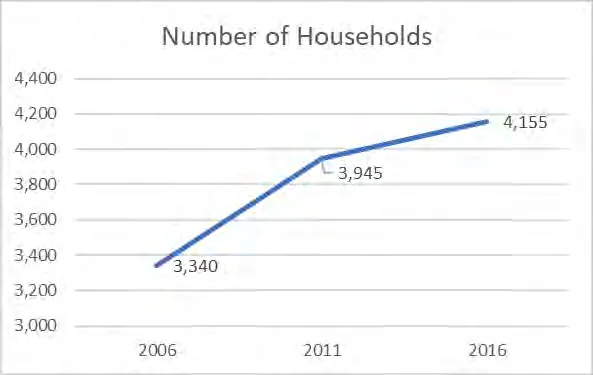
From 2006 to 2016, the number of households has increased in the Town of View Royal from 3,340 to 4,155, or 815 additional households, representing a household growth of 24.4%. Between 2006 to 2011, the community saw an increase of 605 households, and between 2011 and 2016 210 new households were added.
Figure 6: View Royal Households, 2006-2016
2.5 Household Size
The average household size has remained steady at 2.4 since 2006, with the majority (40%, 1,650 households) of households being 2-persons. There were 4,155 households in View Royal in 2016. One-person households comprise 26% (1,060) of the Town of View Royal while 3-person households comprise 15% (615), 4-person households represent 14% (565), and 5 or more person households represent 6% (270) of all households.
Figure 7: Households by Size, View Royal, 2016
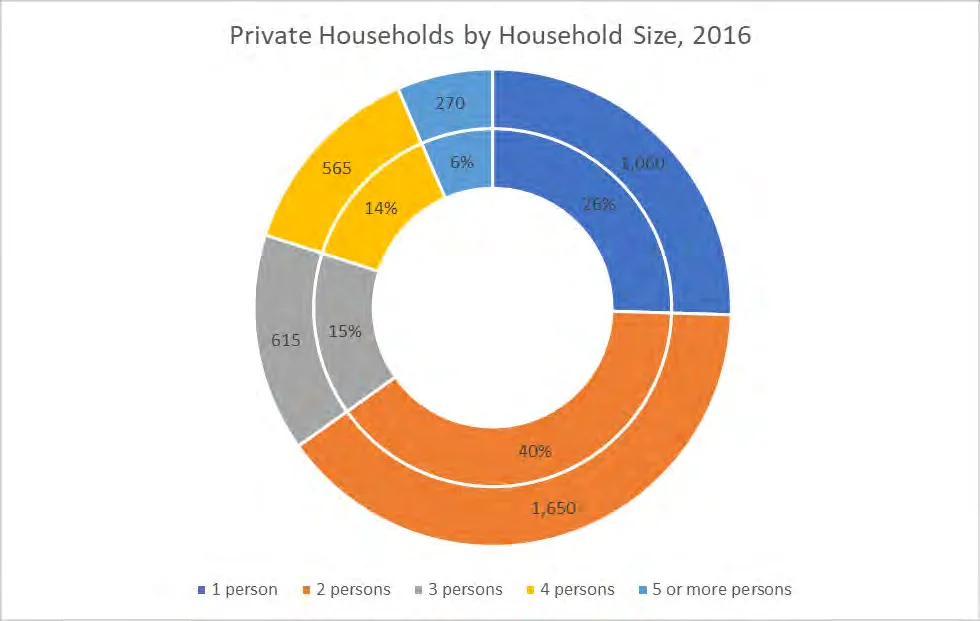
Figure 8: Households By Size, 2006-2011
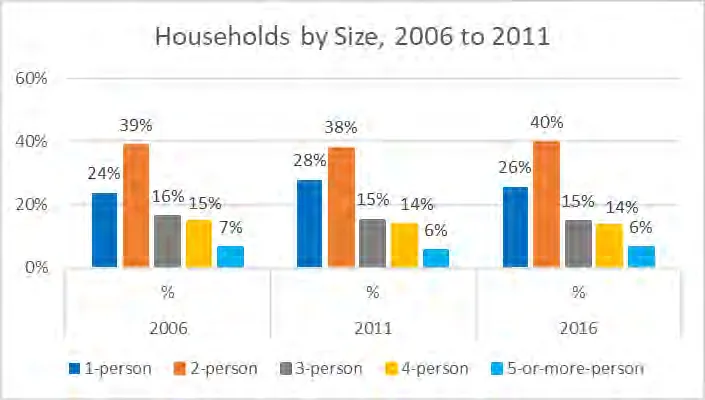
Proportionately, household sizes in View Royal remained consistent between 2006 and 2016. One-person households showed some fluctuation, increasing from 24% in 2006, to 28% in 2011 and down to 26% in 2016. The proportion of two-person households also fluctuated from 39% in 2006, to 38% in 2011 and then up to 40% in 2016.
2.6 Population Projections
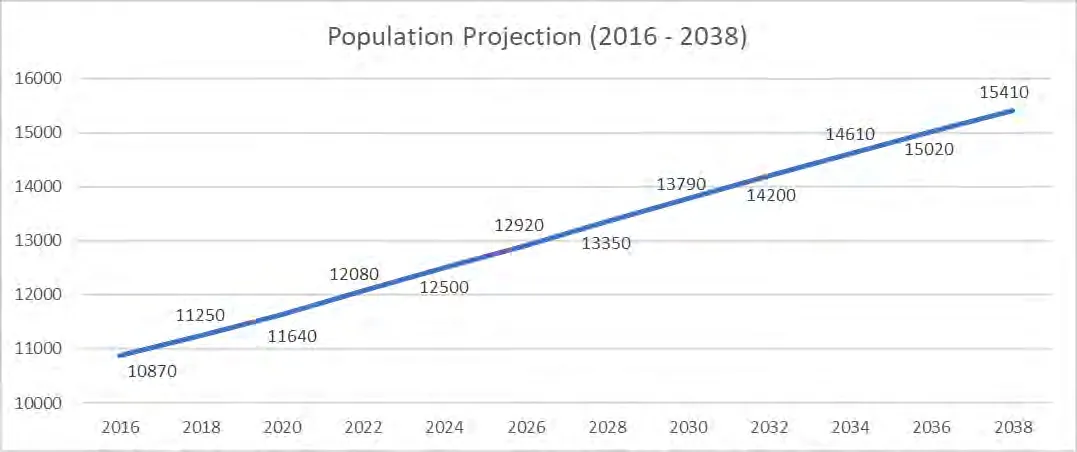
The population within the Town of View Royal is projected to climb 22 percent from 10,870 to 13,350 in 2028 and may grow to 15,410 by 2040. At this rate the Town of View Royal could surpass a population of 15,000 by 2036.
Figure 9: Population Projection
2.7 Dwelling Projections
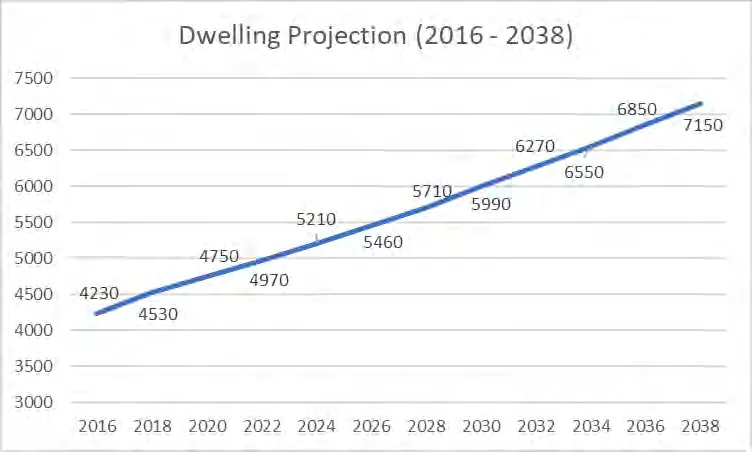
Figure 10 illustrates that a projected increase of 35% or 1,480 dwellings from 4,230 in 2016 to 5,710 by 2028. The average year over year growth rate is expected to be 5%. The discrepancy between total number of households in section 152.4 and that of 2016 in the below figure is that projections were prepared by BC Stats while Statistics Canada was used for point in time numbers.
Figure 10: Dwelling Projections, 2016-2038
2.8 Population by Age
Figure 11 shows projected population by age groups, with three age groups predicted to decrease in proportion between 2016 and 2038: 14 years and under, 20 to 24 years, and 25 to 64 years. Proportionately, the category 25 to 64 years sees the largest decline while maintaining its position as the largest overall age group with the other two seeing minor decreases. The shrinking in these 3 categories is largely made up by the growth for those aged 65 to 84 years and a small increase in the 85 years and over category. The category 15 to 19 saw no changes. Therefore, it is expected that the median age increases over time.
The Town of View Royal has an aged dependency ratio of 25% as of 2016, which could increase to 38% by 2038. An aged dependency ratio looks at the population 65 and over divided by those aged 15 to 64 who are typically in the workforce. Research shows evidence that a high aged dependency ratio can have negative effects on growth of condominiums and single-family homes sale prices over time. Municipalities with increasing aged dependency can also create additional pressure on the rental market.
Figure 11: BC Statistics Population Projection by Age, View Royal, 2016-2038
2.9 Household Projections
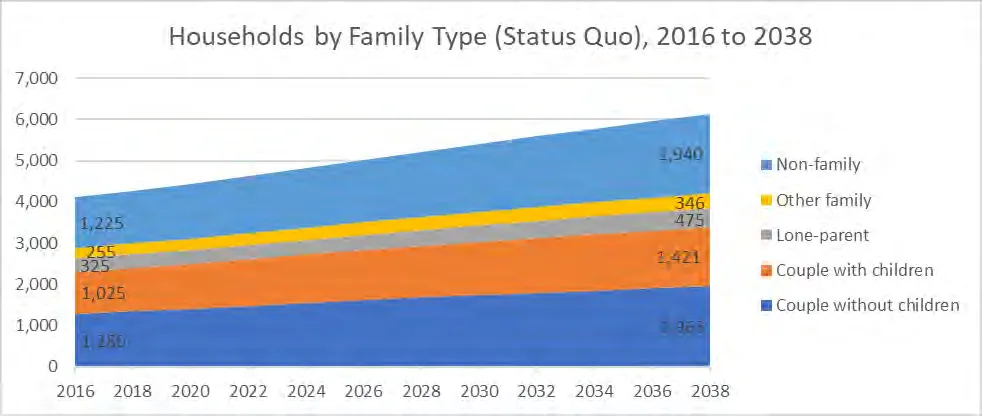
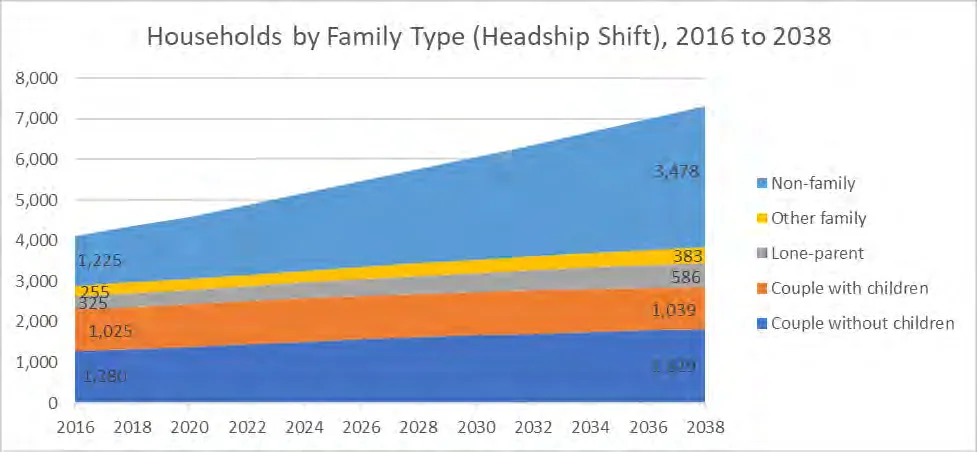
Household projections have been broken into two different scenarios based on two headship rates: Figure 12 and Figure 13. Headship rates are the number of persons who are counted as heads of households. Headship rates are important for urban planners to understand housing needs, as they reflect changes in potential household composition and required housing types over time. Value judgements are not provided on either scenario, and neither come as recommendations. The two scenarios are provided as to consider potential outcomes based on decisions related to housing type, density and other factors the Town can influence.
The first scenario illustrates projections based on status quo; the second scenario is based on a shift to a headship composition, bringing View Royal’s family composition closer to Esquimalt, a neighbouring community that is also a core urban community in the CRD.
Figure 12: Household Projections by Family Type (Status Quo), View Royal, 2016-2038
In the first scenario, projections are based off the status quo headship rate. This means that trends and composition of households in the Town of View Royal stays the same as current rates. In this scenario, the number of households by family type show an overall increase of 1,105 (27%) in family households from 4,110 in 2016 to 6,145 by 2028. Proportionately, households by family type proportions stay relatively the same. With small decrease in the proportion of couple with children households, which is matched by a small increase in non-family households. Based on this scenario, the Town could see a need for an additional 316 housing units between 2020 and 2025, including 106 1-bedrooms or studios, 134 2-bedrooms, and 76 3-bedrooms (see Appendix D).
The second scenario illustrates a headship rate shift in the Town of View Royal. In the second scenario, the composition of the Town of View Royal changes over the 22-year time frame (2016 – 2038) to be proportionate to Esquimalt. The second scenario shows an overall faster growth rate than the first with 3,047 (74%) more households from 4,110 in 2016 to 7,157 by 2028. It also shows a noticeable downward shift in couples with children, a mild decrease in couples without children, and a much larger proportion of non-family households. These changes in composition could result from changes in density, housing type, affordability and other factors. Based on this scenario, the Town could see a need for an additional 723 housing units between 2020 and 2025, including 352 1-bedrooms or studios, 250 2-bedrooms, and 121 3-bedrooms (see Appendix D).
Figure 13: Households by Family Type (Headship Shift), 2016-2038
2.10 Key Considerations
Some key considerations emerge from this analysis of population and demographics:
- The population in View Royal grew faster between 2006 and 2011 than in the CRD as a whole, indicating that increased growth and development will likely continue to impact development and planning considerations over the next five to ten years
- Generally, the age composition of the community is comparable to the CRD as whole, with a slightly aging demographic and an increasing median age. This points to a need for increased considerations around age-appropriate housing, planning for retaining and attracting younger demographics, and supporting aging-in-place options.
- About half of new households projected to be formed by 2040 will be non-family households, while about half will be family households. This is consistent with an aging population that may have more single-person households.
3 INCOME AND ECONOMIC PROFILE
This section reviews key economic indicators, including household incomes, employment and commuting figures and labour force statistics. The purpose of this section is to identify statistics that may impact housing issues, such as the income of renter households or unemployment rates.
3.1 Household Incomes
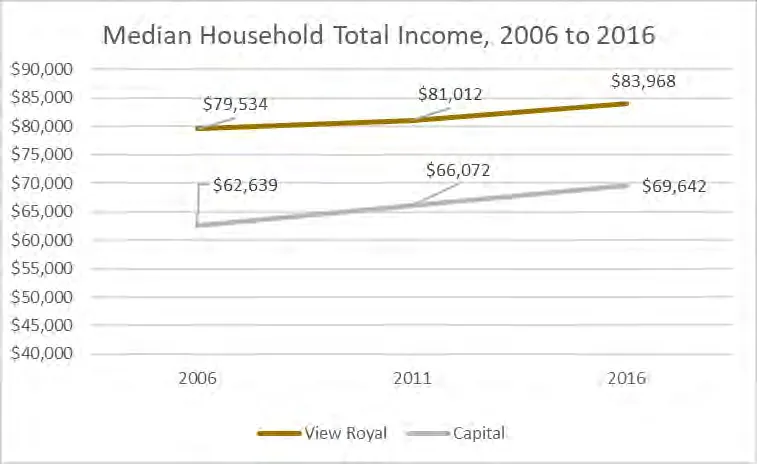
The median household income in View Royal has increased from $79,534 in 2006 to $81,012 in 2011 to $83,968 in 2016, representing a 5.6% increase. The total median before-tax household income over the 10-year period increased by $4,434. In comparison, the Capital Regional District has had a median household income of $62,639 (2006), $66,072 (2011), and $69,642 (2016), representing an 11.2% increase. However, despite lower increases in median household income, the Town of View Royal has consistently had higher median incomes than the CRD as a whole since 2016.
Figure 14: Median Household Total Income, View Royal, 2006-2016
3.2 Households by Income Brackets
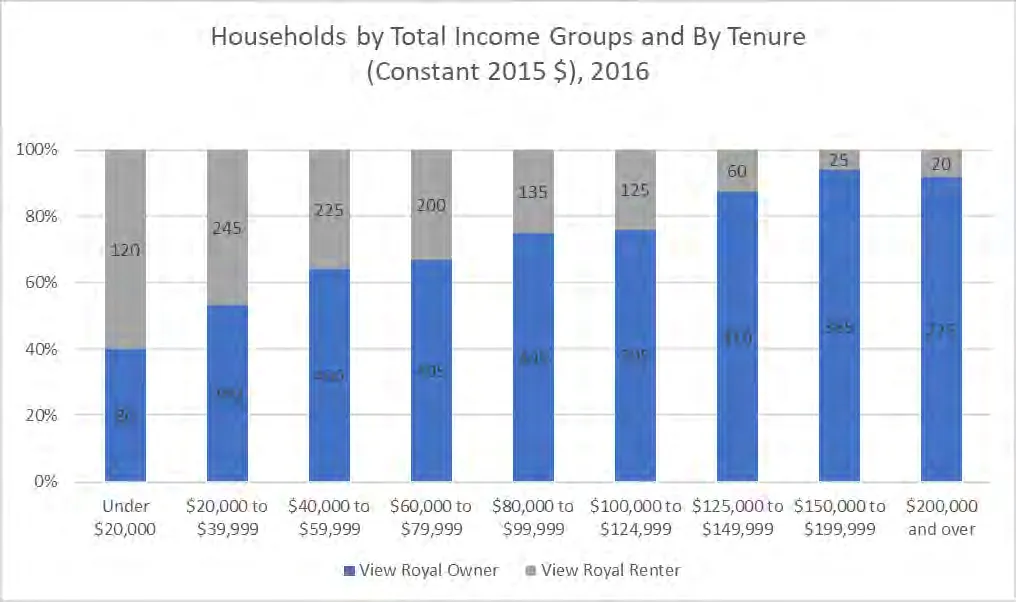
The largest categories of households by income brackets, for 2016, fall into $100,000 to $124,999 (13%), $125,000 to $149,999 (11%), and 150,000 to 199,999 (10%). These households represent more than one-third of all households in View Royal. About three quarters (74%) of households make $50,000 or more, while about a quarter (26%) making less than $50,000.
As household income increases it is more likely that ownership will be the predominant tenure type. Ninety-two percent of households earning over $200,000 are owners, while 60% of households earning less than $20,000 are renters.
Figure 15: Households by Income Group, View Royal, 2006-2016
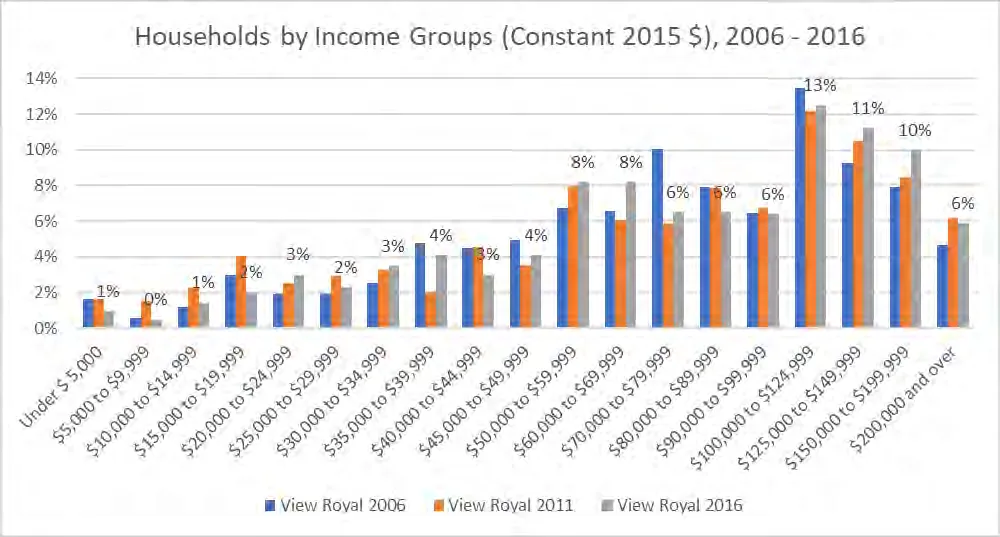
Figure 16: Households Tenure Types by Income Groups, View Royal, 2016
3.3 Owner and Renter Household Income
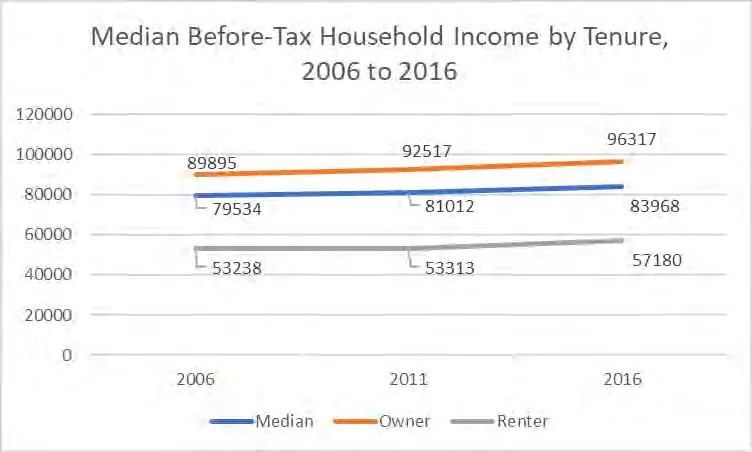
The median before-tax household income by tenure has increased for each tenure type from 2006 to 2016. Owner household income increased between 2006 and 2011 by $2,622 (3%) from $89,895 to $92,517 and increased again between 2011 and 2016 by $3,800 (4%) from $92,517 to $96,317. For renter households median income increased by $75 (0.1%) from 2006 to 2011 and by $3,867 (7%) from 2011 to 2016. Therefore, from 2006 to 2016 owner households saw an increase of $6,422, which is larger than the increase of $3,942 for renter households median before-tax household income.
The overall median household income increased from 2006 to 2011 by $1,479 (2%) and by $2,956 (4%) between 2011 and 2016.
Figure 17: Median Before-Tax Household Income by Tenure, 2006 to 2016
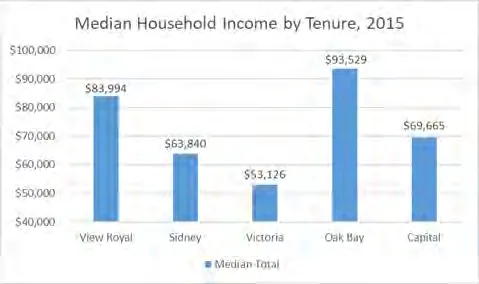
Figure 18: Comparative Median Household Income by Select CRD Municipality, 2015
The Town of View Royal has a higher total median household income than Town of Sidney, District of Sooke, and the City of Victoria. They have lower total median household income than the District of Oak Bay. The median total income for View Royal is $83,994, which is $14,329 greater than the Capital Regional District.
3.4 Workers by Industry
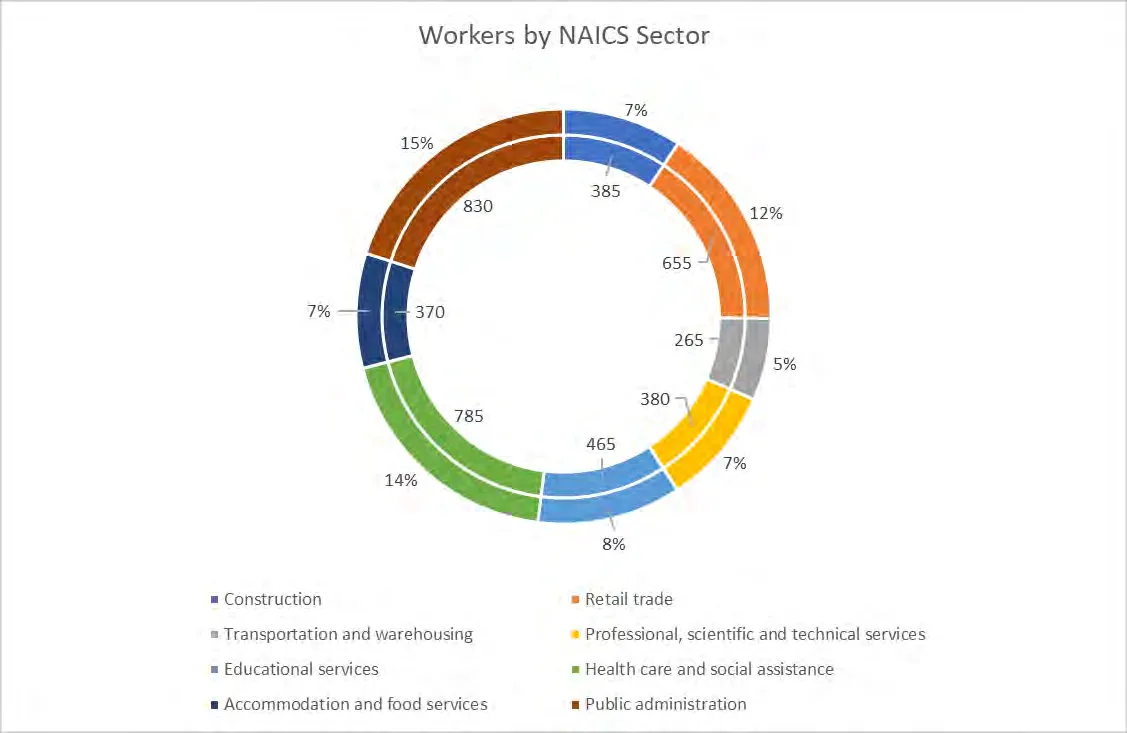
From 2006 to 2016, the Town of View Royals workforce increased 755 (16%) from 4,795 to 5,550. In 2016, the largest workforce category is public administration with 830 or 15% of workers, and then health care and social assistance with 785 or 14% of workers. Retail trade employs 655 workers, or 12%. The remaining sectors to note include construction, transportation and warehousing, educational services, accommodation and food services, as well as professional, scientific and technical services. These categories comprise 75 percent of View Royal’s workers by industry profile.
Figure 19: Workers by North American Industry Classification System (NAICS) Sector, View Royal, 2016
3.5 Economic Indicators
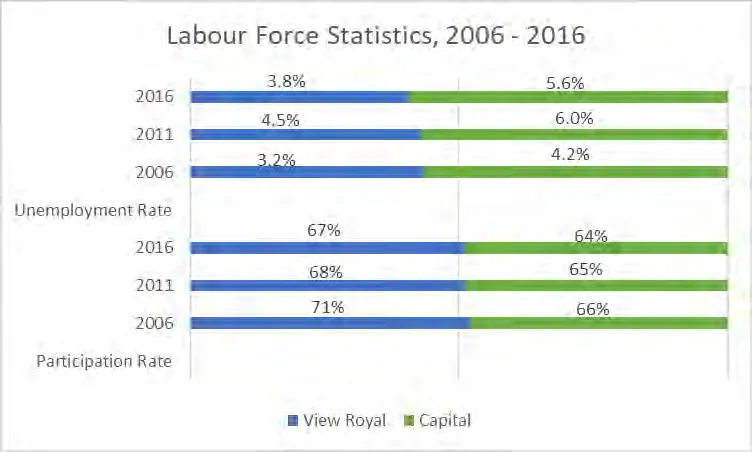
From 2006 to 2016, the Town of View Royal has had a lower unemployment rate and a higher participation rate than the Capital Regional District. For example, in 2016 the unemployment rate for View Royal was 3.8% and 5.6% for the Capital Regional District. Also, in 2016, View Royal’s participation rate was 67% while the Capital Regional District had a participation rate of 64%. During the 2006 to 2016 period the participation rate in the Town of View Royal has been declining from 71% (2006) to 68% (2011) to 67% (2016). The unemployment in the same time period has fluctuated from 3.2% (2006) to 4.5% (2011) to 3.8% (2016).
Figure 20: Labour Force Statistics, View Royal, 2006 and 2016
3.6 Workforce Commuting
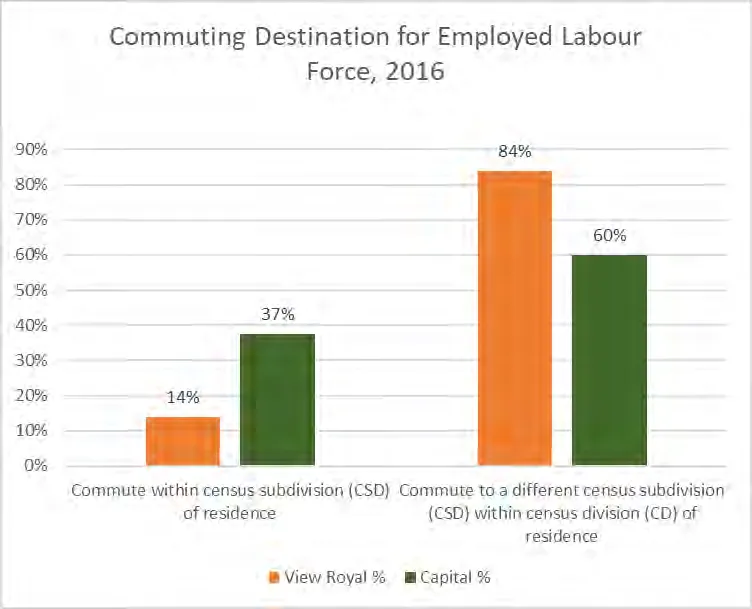
In the Town of View Royal, a much higher proportion of its labour force (84%) commutes to a different census subdivision (i.e. municipality) within the census division (i.e. CRD) of residence, compared with commuters as whole in the CRD (60% in the CRD commute to another municipality within the region).
Figure 21: Commuting Destination for Labour Force, View Royal and CRD, 2016
3.7 Key Considerations
The following key considerations emerge from an analysis of this section:
- Median household income in View Royal has steadily increased between 2006 and 2016; although it is increasingly more slowly than in the CRD as a whole, overall incomes remain higher in View Royal than in the CRD, and View Royal households generally earn more than counterparts in other core CRD municipalities.
- Ownership is the predominant form of tenure, and the wealthier a household is, the more likely it is to own; only households earning less than $20,000 annually are majority renters (60%). In the wealthiest income group, 92% are owners, and 8% of households are renters, indicating a small market for high-end rental dwellings.
- Economically, View Royal is slightly stronger than an already economically strong CRD, with lower unemployment rates and higher labour force participation.
4 HOUSING PROFILE
This section provides a breakdown of housing stock and households in View Royal across a number of dimensions. This section contains the following key sub-sections:
- Dwelling Types – the type, age, and number of bedrooms by unit
- Households by Tenure – changes in households by tenure types, 2006-2016
- Ownership Profile – includes current assessed and sales values for homes in View Royal, and housing indicators for owner households
- Rental Profile – includes a summary of the primary and secondary rental markets in View Royal and housing indicators for renter households, including newly constructed rental building and secondary suites
- Non-Market Housing – a review of current non-market buildings and subsidies in View Royal, and households in core housing need by tenure type, and precariously housed residents
- Homelessness – a summary of regional issues and initiatives related to homelessness
The purpose of this section is to better understand existing housing stock in View Royal to determine potential housing gaps and needs.
4.1 Dwellings Types in View Royal
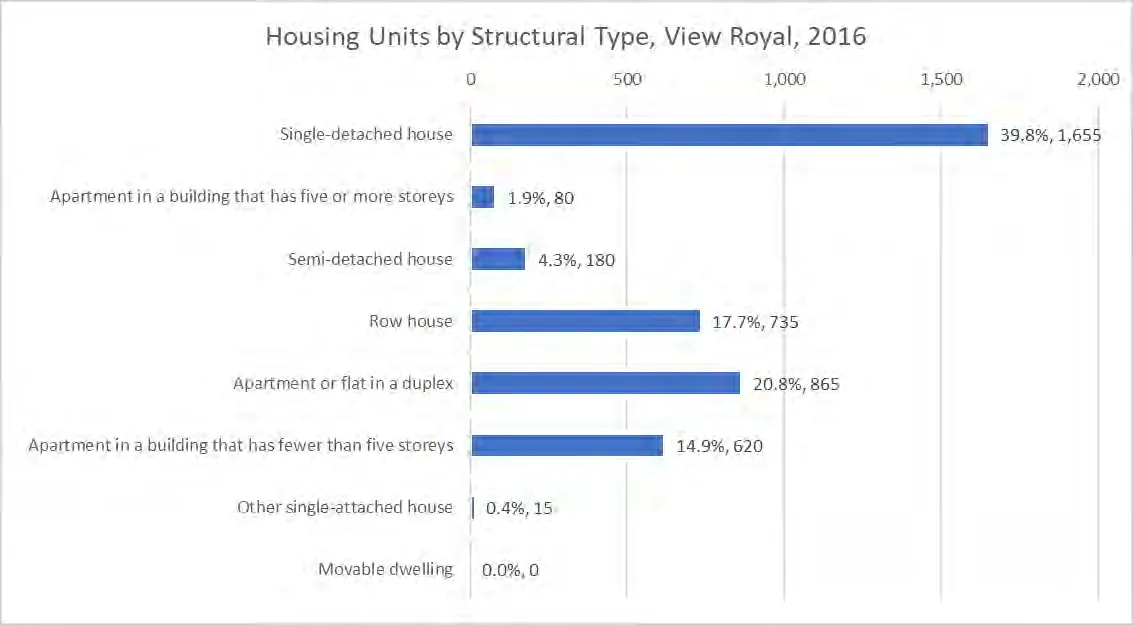
The largest single dwelling unit structural type in View Royal is single-detached homes, representing 40% of all dwelling units (1,655 units). An additional 21% (865 units) are apartments or flats in a duplex (this includes main suites and secondary suites in single family-type structures), while 18% are row homes (735 units). Small apartments (less than 5 storeys) account for 620 units (15%). The remaining unit types include semi detached houses (180 units), larger apartments (5 or more storeys) (80 units), and other single-attached houses (15 units). There are zero movable dwellings. Movable dwellings refers to mobile homes, as well as other dwellings used as a place of residence but capable of being moved on short notice, such as a tent, recreational vehicle, or houseboat. The total number of housing units by structural type is 4,155.
Figure 22: Housing Units by Structural Type, View Royal, 2016
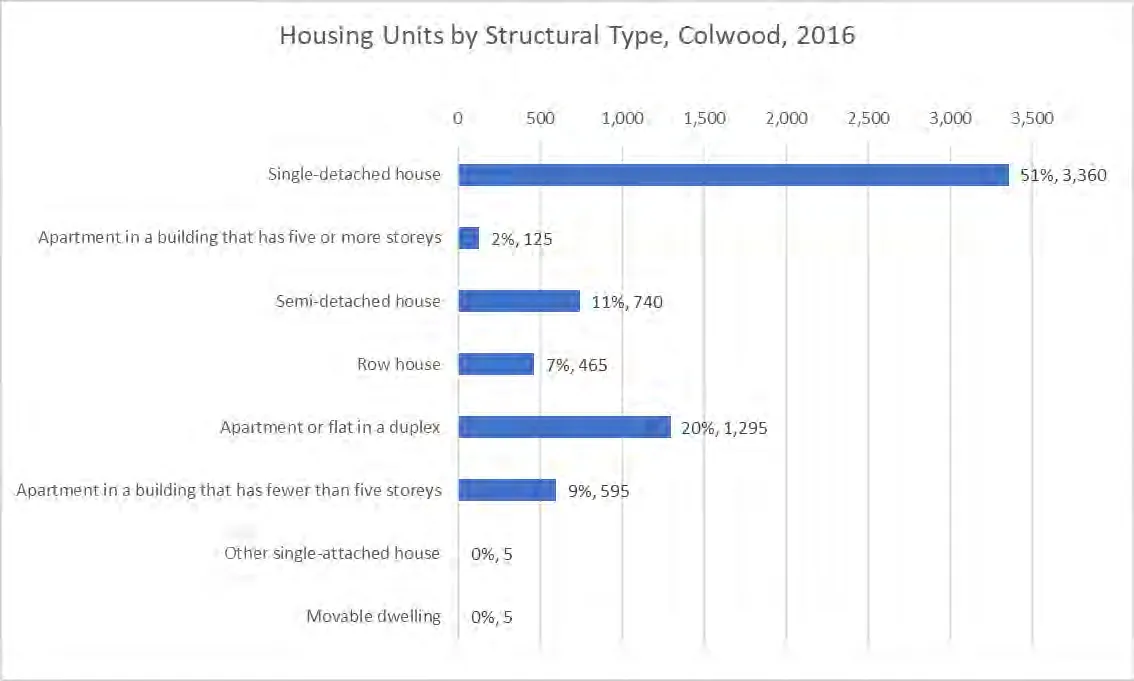
In comparison to the City of Colwood, the Town of View Royal housing units by structural type is proportionately smaller in two categories: single-detached houses by 11% and semi-detached houses by 7%. The Town of View Royal is proportionately larger in three categories: row houses by 11%, apartment or flat in a duplex by 1%, and apartment in a building that has fewer than five storeys by 6%. Finally, Colwood and View Royal have about the same proportion of apartments with five or more storeys (2%), and other single-attached houses (0%).
Data from the Town shows that there were 345 secondary suites in 2016. These units are likely captured within the “apartment in a flat or duplex” category.
Relative to Esquimalt, the Town of View Royal has a lower proportion of housing units by structural type in three categories: apartments in a building that has five or more storeys by 5%, semi-detached houses by 4%, and apartments in a building that has fewer than five storeys by 31%. View Royal has a greater proportion in three categories: single-detached houses by 17%, row houses by 13%, and apartment or flat in a duplex by 10%. This means that a greater proportion of View Royal’s dwelling units is comprised of single-detached houses and secondary suites within single-detached houses. Finally, Esquimalt and the Town of View Royal have about the same proportion of other single-attached houses.