Staff Report - CAO Update
A monthly update from the Chief Administrative Officer covering administrative highlights, financial technology refreshes, development services updates, and protective services activities.
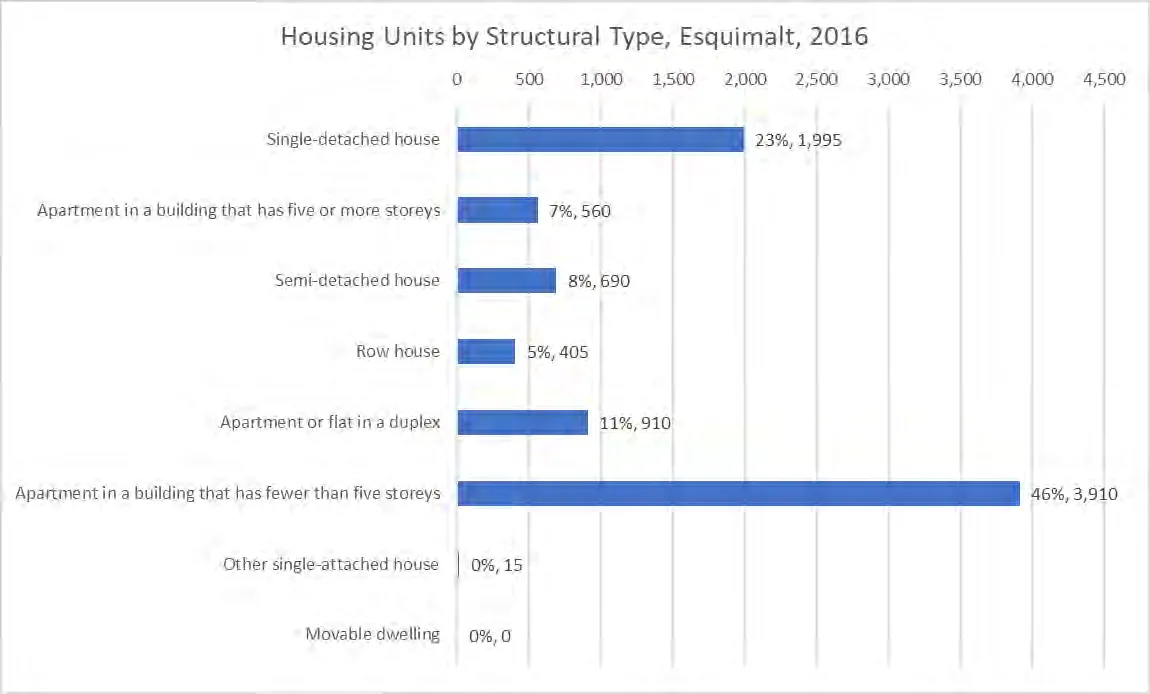
Figure 24: Housing Units by Structural Type, View Royal, 2016³⁷
Units by Bedroom Size
As of 2016, there are roughly 4,150 housing units in View Royal. The largest portion of housing units are 3-bedroom units (1,160) then 2-bedroom units (1,215) and 4-or-more-bedroom units (1,010). 1-bedroom housing units are the least abundant at 320 units.
Based on the data from 2.2.2 Household Size, there are 1,650 households with 2-persons, 1,060 households with one-person, 615 households with 3-person, and 835 households with 4 or more persons. This means that over half of all dwellings (52.3%) are 3 or more bedrooms; however, only just over a third (34.9%) of all households have 3 or more people. This could indicate that smaller households, particularly older households, may be ‘over-housed’ which can impact the ability to age in place for older seniors (aged 85+).
³⁷ Source: Statistics Canada Census Program, Custom Data Organization for BC Ministry of Municipal Affairs and Housing
Table 3: Dwellings by Number of Bedrooms versus Private Households by Household Size, 2016³⁸
| # | Dwellings by Number of Bedrooms, 2016 | % | Private Households by Household Size, 2016 | % |
|---|---|---|---|---|
| 1 | 320 | 8% | 1,060 | 26% |
| 2 | 1,215 | 29% | 1,650 | 40% |
| 3 | 1,610 | 39% | 615 | 15% |
| 4 or more | 1,010 | 24% | 835 | 20% |
Age of Housing Stock
Housing in the Town of View Royal is relatively evenly spread across a number of age ranges: units built between 1961 and 1980 represent 19% of all units, units built between 1981 and 1990 are 17%, units built between 1991 and 2000 are 20%, and units built between 2001 and 2010 are 21%. Housing stock from 1960 or earlier comprises 14 percent while housing built in 2011 to 2016 comprises only 9 percent.
Figure 25 Housing by Period of Construction, View Royal, 2016³⁹
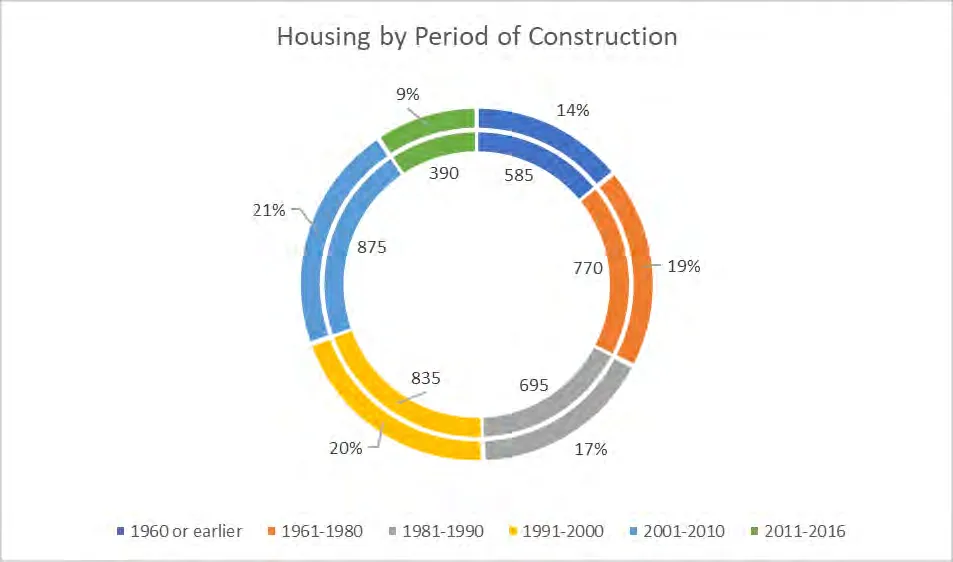
Compared to the CRD as a whole, housing stock in View Royal is slightly newer. Less than half (49%) of View Royal’s housing was built prior to 1991, compared to 71% in the CRD. In general, housing stock in View Royal and across the region is not old enough to cause widespread issues related to age and condition. However, there can be some implications for affordability.
For renter households, tear downs, rebuilds or redevelopments, and renovations can increase the cost of rent and can be cause for eviction. In View Royal, there has been an increasing proportion of renters living in housing requiring major repairs, as discussed in Section 4.4 (Figure 35).
For owners, older dwellings are usually more expensive to maintain and may require more repairs than newer dwellings. In View Royal, there has also been an increasing proportion of owners living in housing requiring major repairs, as discussed in Section 4.3 (Figure 29).
³⁸ Source: Statistics Canada Census Program, Custom Data Organization for BC Ministry of Municipal Affairs and Housing ³⁹ Source: Statistics Canada Census Program, Custom Data Organization for BC Ministry of Municipal Affairs and Housing
New Housing Stock
Since 2016, there have been 507 building permits issued by the Town, with demolitions netted out (Table 4). Each year, the majority of building permits issued were for multi-family (68% to 81%). This suggests there may be a trend towards more multi-family forms, which could offer more affordable and missing middle options for residents looking to purchase a home.
Table 4: Dwelling Units Created in View Royal, 2017-2019⁴⁰
| 2017 | 2018 | 2019 | ||||
|---|---|---|---|---|---|---|
| # | % | # | % | # | % | |
| Single-Family or Secondary Suite | 50 | 24% | 44 | 19% | 24 | 32% |
| Multi-Family | 158 | 76% | 185 | 81% | 51 | 68% |
| Total (Demolitions Netted Out)⁴¹ | 206 | 100% | 229 | 100% | 72 | 100% |
4.2 Households by Tenure Type
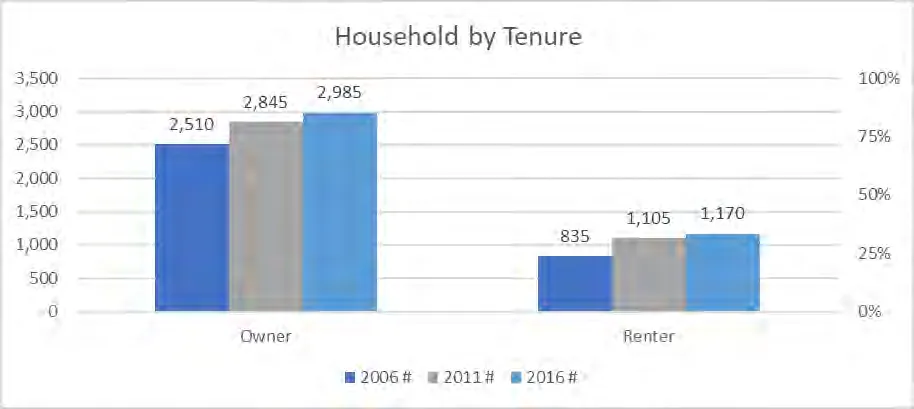
The Town of View Royal has a high ownership rate of 72 percent (2016), or 2,985, compared to 63 percent of residents within the CRD. However, renters still make up a significant portion of the community at 28 percent, or 1,170 households. From 2006 to 2016, the proportion of owners has declined 3 percent (while increasing by nearly 500 households) and a 3 percent increase in renter households (an increase of nearly 250 households).
⁴⁰ Source: Town of View Royal, 2020 ⁴¹ There were a total of 2 demolition permits recorded in 2017, 0 in 2018, and 3 in 2019.
Figure 26: Households by Tenure, View Royal, 2006- 2016⁴²
Renter Households in Subsidized Housing
Figure 27: Renter Households and Subsidized Housing, View Royal, 2011 and 2016⁴³
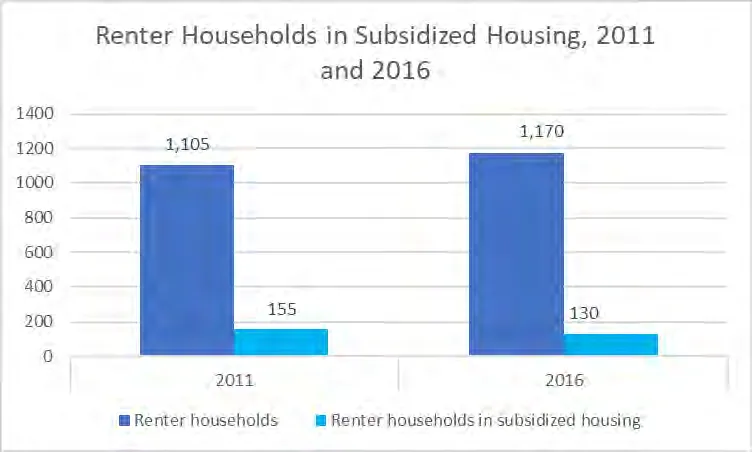
The number of renter households in subsidized housing decreased from 155 in 2011 to 130 in 2016. In relation to total renter households the proportion of renter households in subsidized living was 14% in 2011 and 11% in 2016.
⁴² Source: Statistics Canada Census Program, Custom Data Organization for BC Ministry of Municipal Affairs and Housing ⁴³ Source: Statistics Canada Census Program, Custom Data Organization for BC Ministry of Municipal Affairs and Housing
4.3 Ownership Profile
Assessed Values
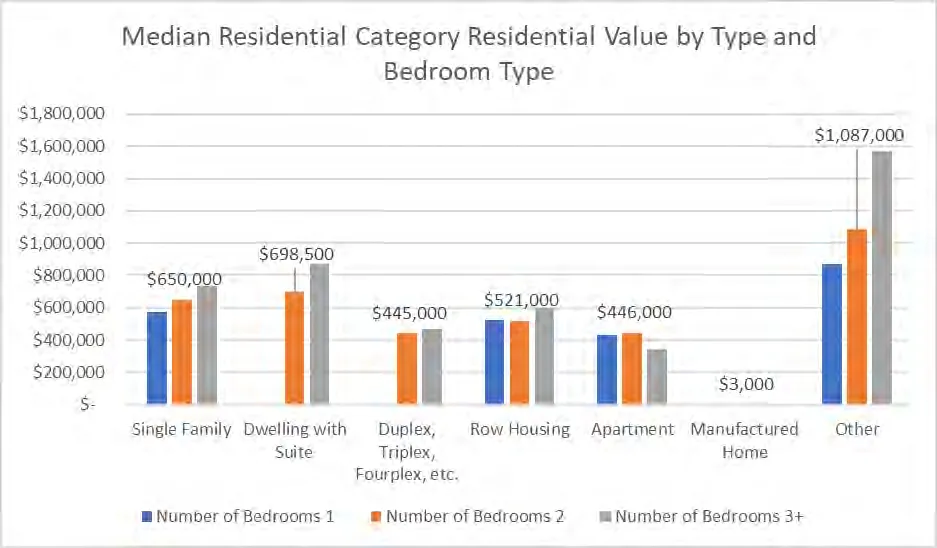
The graph below highlights the assessed value of a range of dwelling types, by bedroom size.⁴⁴ It is highlighted because the data was most consistently provided for bedroom type between residential categories. 2-bedroom single family residential properties have a median value of $650,000 while 2-bedroom dwellings with a suite have a median value of $698,500. Duplexes, triplexes, fourplexes, etc. have a median value of $445,000. Row housing has a median value of $521,000 and 2-bedroom apartments are valued at $446,000. Manufactured homes with 2-bedrooms have a median value of $3,000. The median value for the 2-bedroom other⁴⁵ residential types is $1,087,000. These “other” residential type properties likely have high property values associated with their potential for development. There is a small number of “other” residential type properties in the Town (8 in 2019), so this figure could be easily skewed and is not the type of residential property most households would be looking for.
Figure 28: Residential Value by Dwelling Type and Bedroom Size, View Royal, 2018⁴⁶
⁴⁴ Two-bedroom units are consistently labelled as this data was most consistently available across housing type. ⁴⁵ “Other” includes properties subject to section 19(8) of the Assessment Act. Section 19(8) applies to parcels of land that are 2.03 hectares (approximately 5 acres) or smaller and have been improved for residential purposes. The residential improvements cannot be used to accommodate more than three families. This residential land must have the potential for development so that the property’s market value in another use is higher than the property’s existing residential value. ⁴⁶ Source: Assessed Value, 2019. Although historical assessment data is a provincial requirement, this data has not been provided by the province at the date of publication of this report.
Sales Prices
The sale prices of single-family residential buildings increase from $610,000 for 1-bedroom dwellings, to $690,000 for 2-bedroom dwellings and $699,900 for 3-bedroom dwellings. Dwellings with suites that have 2-bedrooms sell for $50,000 less than single-family 2-bedroom dwellings; while 3+ bedroom dwellings with suites sell for $238,100 more than their non-suite (single family) counterparts. 3-bedroom or more duplexes, triplexes, fourplexes, etc. sell for $589,800, which is less than previously mentioned dwelling types. Row houses have sold at $595,000 for 1-bedroom dwellings, $492,000 for 2-bedroom dwellings, and $571,333 for 3-bedroom or more dwellings. Apartment units sell for $420,500 for 1-bedroom units and $415,000 for 2-bedroom units.
Table 5: Median Residential Category Total Conveyance Price by Type and Bedroom Type⁴⁷
| Number of Bedrooms | |||
|---|---|---|---|
| 1 | 2 | 3+ | |
| Single Family | $ 610,000 | $ 690,000 | $ 699,900 |
| Dwelling with Suite | Insufficient data | $ 640,000 | $ 938,000 |
| Duplex, Triplex, Fourplex, etc. | Insufficient data | $ - | $ 589,800 |
| Row Housing⁴⁸ | $ 595,000 | $ 492,000 | $ 571,333 |
| Apartment | $ 420,500 | $ 415,000 | $ - |
Housing Indicators for Owner Households
Statistics Canada and CMHC have established national standards for affordability, adequacy, and suitability of housing. Communities throughout Canada use these standards as indicators to identify issues and make improvements related to housing. The three standards are defined as follows:
- Affordable housing has shelter costs equal or less than 30% of total before-tax household income.
- Adequate housing does not require any major repairs, as reported by the maintainer.⁴⁹
- Suitable housing has enough bedrooms for the size and composition of resident households according to National Occupancy Standard (NOS) requirements.
⁴⁷ Source: BC Assessment Average Sales Prices, 2019. ⁴⁸ Row housing includes all types of townhome tenures (i.e. strata and non-strata) ⁴⁹ “Major repairs” is interpreted by the respondent, but according to Statistics Canada, this may include repairs to things such as defective plumbing or electrical wiring, and/or structural repairs to walls, floors, or ceilings.