APPENDIX D: HOUSEHOLD PROJECTIONS
Projections of household growth in View Royal through 2038, analyzed by structure type, family type, tenure, and age under different scenarios.
APPENDIX D: HOUSEHOLD PROJECTIONS
Household projections have been broken into two different scenarios based off of two headship rates. Headship rates are the number of persons who are counted as heads of households. Headship rates are important for urban planners to understand the housing need. Value judgements are not provided on either scenario, and neither come as recommendations. The two scenarios are provided as a thought experiment to understand potential outcomes on decisions related to housing type, density and other factors the Town can influence.
Headship rates describe the proportion of people of a given age group who lead a household (of a given family type, in our projections). Headship rates are the mechanism by which we move from population projections by age groups to household projections. Using a set of headship rates by age (typically based on past headship rates within the community of interest), we can use the number of individuals of each age range and gain provided by the CRD population projections and gain an estimate of the number of households. This approach generally assumes a headship rates remain constant (or changes in a specific manner), but in reality, headship rates could be influenced by a number of variables, including affordability, availability of certain tenures or forms of housing, or other socio-economic trends.
The first scenario illustrates projections based on status quo; the second scenario is based off of a shift to a headship composition similar to Esquimalt.
Household by Structure Type Projections
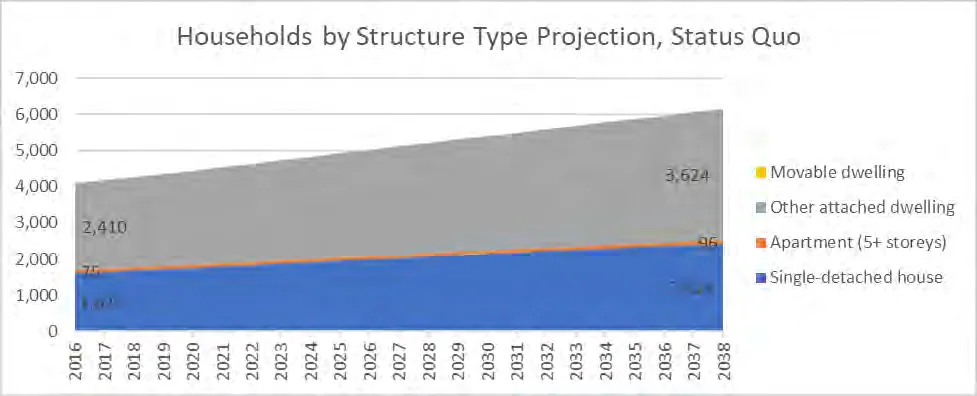
Status Quo – Households by Structure Type Projection
| 2016 | Growth | 2038 | |
|---|---|---|---|
| Total | 4,110 | +2,034 (49%) | 6,144 |
| Other Attached Dwelling | 2,410 (58%) | +1,214 (50%) | 3,624 (59%) |
| Apartment with 5+ storeys | 75 (2%) | +21 (28%) | 96 (2%) |
| Single-detached house | 1,625 (40%) | +799 (49%) | 2,424 (39%) |
| Moveable Dwelling | unknown at this time |
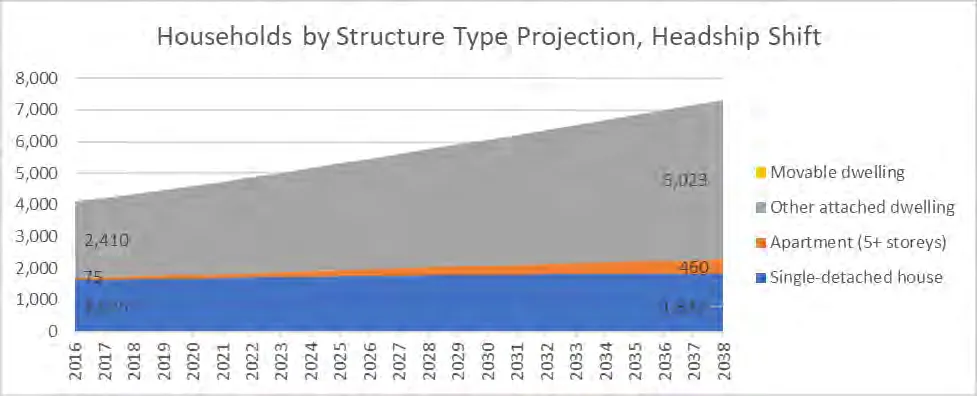
Headship Shift – Households by Structure Type Projection
| 2016 | Growth | 2038 | |
|---|---|---|---|
| Total | 4,110 | +3,205 (78%) | 7,315 |
| Other Attached Dwelling | 2,410 (58%) | +2,613 (108%) | 5,023 (69%) |
| Apartment with 5+ storeys | 75 (2%) | +385 (513%) | 460 (6%) |
| Single-detached house | 1,625 (40%) | +207 (13%) | 1,832 (25%) |
| Moveable Dwelling | unknown at this time |
Households by Family Type Projections
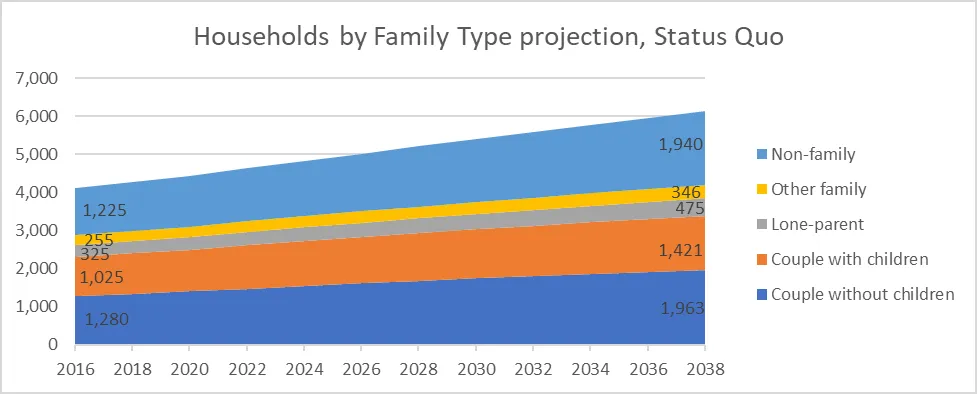
Status Quo – Households by Family Type
| 2016 | Growth | 2038 | |
|---|---|---|---|
| Total | 4110 | +2035 (33%) | 6145 |
| Non-family | 1225 (30%) | +715 (58%) | 1940 (32%) |
| Other Family | 255 (6%) | +91 (36%) | 346 (6%) |
| Lone-parent | 325 (8%) | +150 (46%) | 475 (8%) |
| Couple with children | 1025 (25%) | +396 (39%) | 1421 (23%) |
| Couple without children | 1280 (31%) | +683 (53%) | 1963 (32%) |
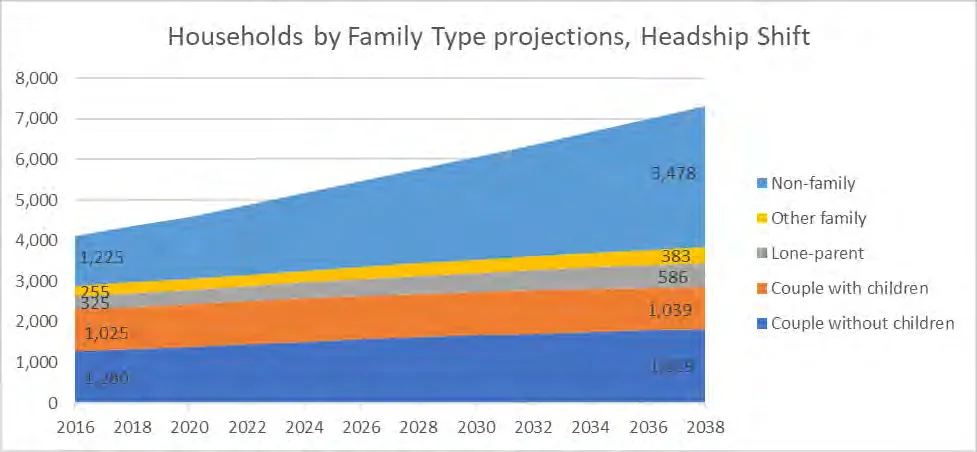
Headship Shift – Households by Family Type
| 2016 | Growth | 2038 | |
|---|---|---|---|
| Total | 4,110 | +3205 (78%) | 7,315 |
| Non-family | 1225 (30%) | +2253 (184%) | 3,478 (48%) |
| Other Family | 255 (6%) | +128 (50%) | 383 (5%) |
| Lone-parent | 325 (8%) | +261 (80%) | 586 (8%) |
| Couple with children | 1025 (25%) | +14 (1%) | 1039 (14%) |
| Couple without children | 1280 (31%) | +549 (43%) | 1829 (25%) |
Households by Tenure Projections
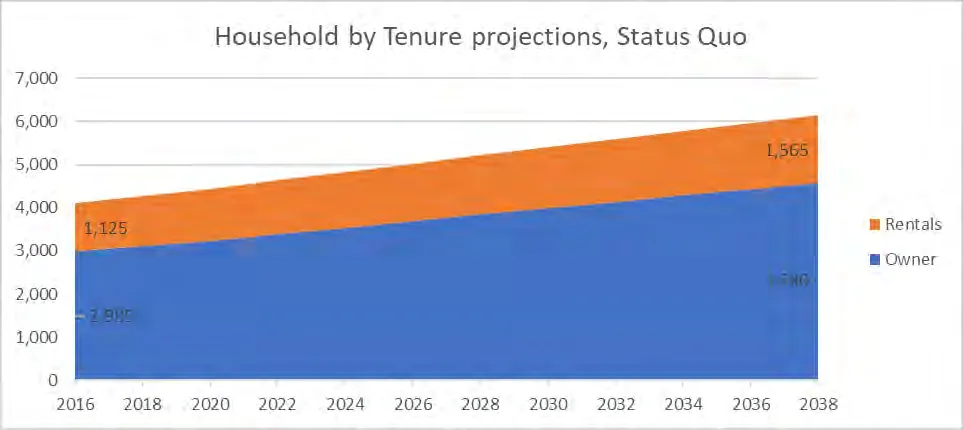
Status Quo – Households by Tenure projections
| 2016 | Growth | 2038 | |
|---|---|---|---|
| Total | 4110 | +2035 (33%) | 6145 |
| Rentals | 1125 (27%) | +440 (39%) | 1565 |
| Owner | 2985 (73%) | +1595 (53%) | 4580 |
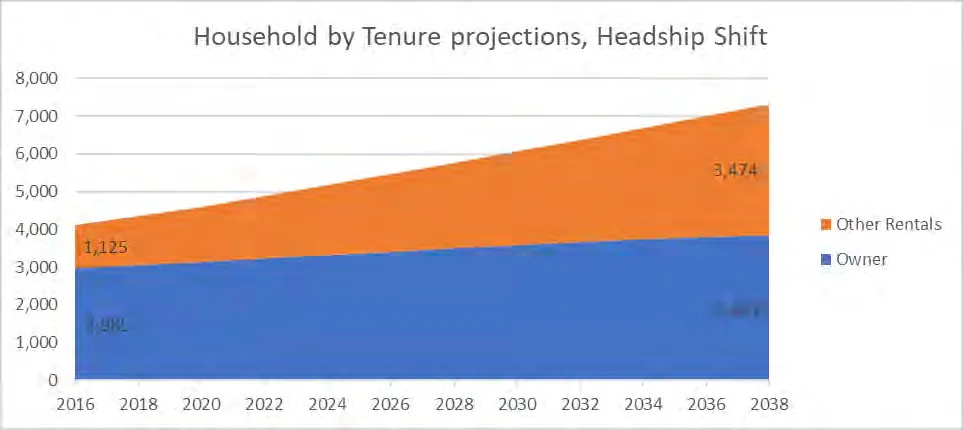
Headship Shift – Household by Tenure Projection
| 2016 | Growth | 2038 | |
|---|---|---|---|
| Total | 4110 | +3205 (78%) | 7,315 |
| Rentals | 1125 (27%) | +2349 (209%) | 3474 (47%) |
| Owner | 2985 (73%) | +856 (29%) | 3841 (53%) |
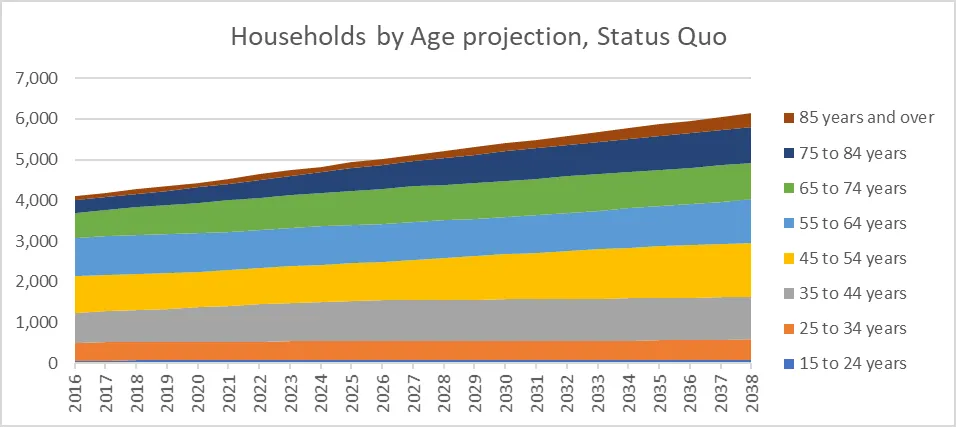
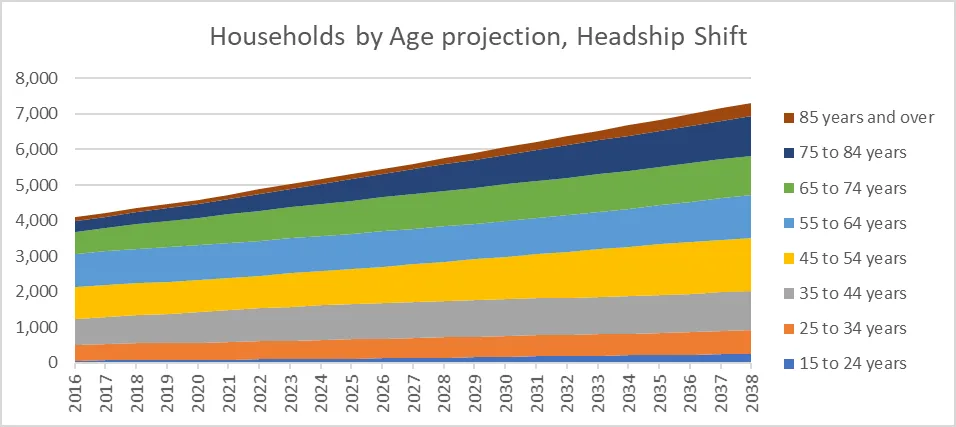
Households by Age Projections
Housing Needs by Unit Size
The following distribution of required units by household type has been assumed to identify estimated future housing needs by unit size:
| No/1 Bedroom | 2 Bedroom | 3+ Bedroom | |
|---|---|---|---|
| Couple without Children | 50% | 50% | 0% |
| Families with Children and Other Families | 0% | 33% | 67% |
| Non-Family | 60% | 30% | 10% |
Based on the projected household growth in the first scenario, it is expected that there will be an increase of 643 households from 2016 to 2025. Most of this growth will be in couples without children and families with children and other families. Based on the projected household growth and the typical number of bedrooms needed for these household types, the anticipated units needed are shown in the following table:
Projected Units Needed by Number of Bedrooms, Status Quo, 2016-2020 and 2020-2025
| Household Type | Projected Household Growth 2016-2020 | Projected Household Growth 2020-2025 |
|---|---|---|
| Couple without Children | 129 | 178 |
| Families with Children and Other Families | 91 | 109 |
| Non-Family | 107 | 29 |
| Number of Bedrooms | Anticipated Units Needed 2016-2020 | Anticipated Units Needed 2020-2025 |
| Studio or 1 Bedroom | 128 | 106 |
| 2 Bedroom | 126 | 134 |
| 3+ Bedroom | 72 | 76 |
| Total | 327 | 316 |
In the second scenario, it is expected the number of households will grow by 777. Non-family households are projected to have the highest growth, followed by couples without children. The anticipated units needed in this scenario require less bedrooms and are shown in the following table:
Projected Units Needed by Number of Bedrooms, Headships Shifted, 2016-2020 and 2020-2025
| Household Type | Projected Household Growth 2016-2020 | Projected Household Growth 2020-2025 |
|---|---|---|
| Couple without Children | 111 | 149 |
| Families with Children and Other Families | 56 | 112 |
| Non-Family | 316 | 462 |
| Number of Bedrooms | Anticipated Units Needed 2016-2020 | Anticipated Units Needed 2020-2025 |
| Studio or 1 Bedroom | 245 | 352 |
| 2 Bedroom | 168 | 250 |
| 3+ Bedroom | 69 | 121 |
| Total | 482 | 723 |