9 ERSKINE LANE DEVELOPMENT Traffic Impact Assessment
A Traffic Impact Assessment report prepared by Watt Consulting Group for the 9 Erskine Lane residential project, analyzing current and future traffic conditions.
9 ERSKINE LANE DEVELOPMENT
Traffic Impact Assessment
Author: MJ Oh Reviewer: Nathan Carswell, P.Eng., Prepared for: WestUrban Developments Our File: 2755.B01 Date: August 06, 2020
#501-740 Hillside Avenue Victoria, BC V8T 1Z4 T 250.388.9877 F 250.388.9879 wattconsultinggroup.com
TABLE OF CONTENTS
1.0 INTRODUCTION ................................................................................................... 1 1.1 Study Area ............................................................................................................. 1
2.0 EXISTING CONDITIONS ...................................................................................... 2 2.1 Land Use ............................................................................................................... 2 2.2 Road Network ........................................................................................................ 2 2.3 Traffic Count .......................................................................................................... 2 2.4 Traffic Model .......................................................................................................... 3 2.5 Existing Traffic Conditions (View Royal) ................................................................ 4 2.6 Existing Traffic Conditions (MoTI) ......................................................................... 5
3.0 BACKGROUND TRAFFIC CONDITIONS ............................................................ 6 3.1 7 Erskine Lane Traffic ........................................................................................... 7 3.2 2022 Background Traffic Conditions ..................................................................... 8 3.2.1 Helmcken / Watkiss Intersection ............................................................. 10 3.3 2032 Background Conditions .............................................................................. 11 3.3.1 Helmcken / Watkiss Intersection ............................................................. 13
4.0 POST DEVELOPMENT CONDITIONS ............................................................... 14 4.1 Proposed Land Use ............................................................................................. 14 4.2 Site Access .......................................................................................................... 14 4.3 Trip Assignment .................................................................................................. 15 4.4 2022 Opening Day Traffic Conditions ................................................................. 17 4.4.1 Helmcken / Watkiss Intersection ............................................................. 19 4.5 2032 Post Development Conditions .................................................................... 20 4.5.1 Helmcken / Watkiss Intersection ............................................................. 22 4.6 Left Turn Lane Review ........................................................................................ 23 4.7 Erskine Lane / Watkiss Road .............................................................................. 23 4.8 Revision to Site Plan ........................................................................................... 25
5.0 TRAFFIC CALMING ........................................................................................... 26
6.0 ACCESS REVIEW .............................................................................................. 27 6.1 Access Spacing ................................................................................................... 27 6.2 Sight Distances ................................................................................................... 27
7.0 ACTIVE TRANSPORTATION ............................................................................. 27 7.1 Pedestrians and Cyclists ..................................................................................... 27 7.2 Transit ................................................................................................................. 28
8.0 TRANSPORTATION DEMAND MANAGEMENT ............................................... 29 8.1 Electric Bicycles .................................................................................................. 29 8.2 Secure Bicycle Parking ....................................................................................... 29 8.3 Carpooling ........................................................................................................... 29 8.4 Carshare .............................................................................................................. 30 8.5 TDM Impact on Traffic ......................................................................................... 30
9.0 CONCLUSIONS .................................................................................................. 30
10.0 RECOMMENDATIONS ....................................................................................... 32
APPENDICES Appendix A: Synchro Background
LIST OF FIGURES
- Figure 1: Study Intersections and Site Location ........................................................................... 1
- Figure 2: 2019/2020 Existing Traffic Volumes .............................................................................. 4
- Figure 3: 2020 Helmcken Road/Watkiss Way Traffic ................................................................... 5
- Figure 4: AM Trip Assignment for 7 Erskine Lane (Site Outlined in Red) ..................................... 8
- Figure 5: PM Trip Assignment for 7 Erskine Lane (Site Outlined in Red) ..................................... 8
- Figure 6: 2022 Background Traffic Volumes ................................................................................. 9
- Figure 7: 2022 Background Helmcken Road/Watkiss Way Traffic ............................................. 10
- Figure 8: 2032 Background Traffic Volumes ............................................................................... 12
- Figure 9: 2032 Background Helmcken Road/Watkiss Way Traffic ............................................. 13
- Figure 10: Proposed Site Plan .................................................................................................... 15
- Figure 11: Trip Assignment – AM Peak Hour ............................................................................. 16
- Figure 12: Trip Assignment – PM Peak Hour ............................................................................. 17
- Figure 13: 2022 Post Development Volumes ............................................................................. 18
- Figure 14: 2022 Post Development Helmcken Road/Watkiss Way Traffic ................................. 19
- Figure 15: 2032 Post Development Volumes ............................................................................. 21
- Figure 16: 2032 Post Development Helmcken Road/Watkiss Way Traffic ................................. 22
- Figure 17: Left-turn Lane Warrant ............................................................................................... 23
LIST OF TABLES
- Table 1: 2019/2020 AM and PM Peak Hour Traffic Conditions .................................................... 4
- Table 2: 2020 AM and PM Peak Hour Traffic Conditions at Watkiss/Helmcken ........................... 6
- Table 3: 2022 Background Traffic Conditions ............................................................................... 9
- Table 4: 2022 AM and PM Peak Hour Background Traffic Conditions at Watkiss/Helmcken ..... 11
- Table 5: 2032 Background Traffic Conditions ............................................................................. 12
- Table 6: 2032 AM and PM Peak Hour Background Traffic Conditions at Watkiss/Helmcken ..... 13
- Table 7: Peak Hour Trip Generation Rates ................................................................................. 14
- Table 8: Peak Hour Development Trips ...................................................................................... 14
- Table 9: 2022 Post Development Traffic Conditions ................................................................... 18
- Table 10: 2022 Post Development Traffic Conditions at Watkiss/Helmcken .............................. 19
- Table 11: 2032 Post Development Traffic Conditions ................................................................. 21
- Table 12: 2032 Post Development Traffic Conditions at Watkiss/Helmcken .............................. 22
- Table 13: AM Peak Hour 2032 Post Development Option Comparison ..................................... 24
- Table 14: PM Peak Hour 2032 Post Development Option Comparison ..................................... 24
- Table 15: Peak Hour Development Trips .................................................................................... 25
- Table 16: Comparison of Peak Hour Development Trips ........................................................... 25
- Table 17: Sight Distances at Access 1 based on 30km/h ........................................................... 27
1.0 INTRODUCTION
Watt Consulting Group was retained by WestUrban Developments to conduct a traffic impact assessment (TIA) for a proposed residential development located at 9 Erskine Lane in the Town of View Royal, BC. This report reviews existing and post development traffic conditions for both the short- and long-term horizon. The report also reviews the site accesses and the active transportation network.
1.1 STUDY AREA
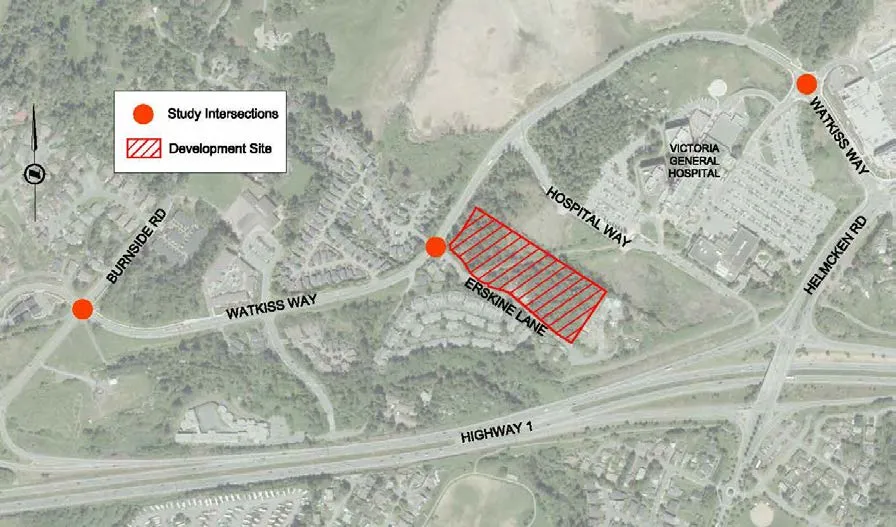
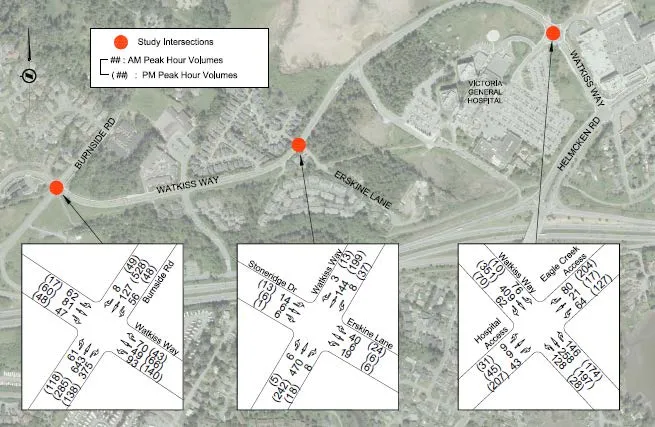
The following key intersections will be studied along with the proposed development accesses located on Erskine Lane:
- Watkiss Way / Erskine Lane / Stoneridge Drive (unsignalized, two-way stop controlled);
- Burnside Road W / Watkiss Way (signalized);
- Watkiss Way / Hospital Access / Mall Access (unsignalized, roundabout); and
- Watkiss Way / Chancellor / Helmcken Road (signalized).
Figure 1 shows the study intersections and site location.
2.0 EXISTING CONDITIONS
2.1 LAND USE
The proposed site is currently zoned as A1 (Rural) and there is an existing single-family home on the site. The surrounding land use is a mix of multi-family and single family residential along Erskine Lane and Stoneridge Drive, with the Victoria General Hospital to the east. A proposed multi-family development is planned for the adjacent property at 7 Erskine Lane.
Other projects, proposed, in the area include the Eagle Nest development at the corner of Burnside Road / Helmcken Road and the BC Transit HandyDart facility at the corner of Burnside Road / Watkiss Way (2401 Burnside Road).
2.2 ROAD NETWORK
Watkiss Way is a two-lane major road with a posted speed limit of 50km/h. Burnside Road W is a two-lane collector road with a posted speed limit of 50km/h. Erskine Lane and Stoneridge Drive are two-lane local roads with a posted speed limit of 30km/h.
As Erskine Lane dead ends south of the proposed site, all site traffic will use the intersection of Watkiss Way / Erskine Lane. The four-legged intersection of Watkiss Way / Erskine Lane is stop-controlled on Erskine Lane.
Helmcken Road is a major road with a combination of raised center median, dedicated left turn lanes and a two way left turn lane that provides access to residential properties between Burnside Road and Watkiss Way / Chancellor Avenue. The intersection of Helmcken Rd / Watkiss Way / Chancellor Ave is a four legged signalized intersection. Dedicated left turn lanes are provided on all approaches to the intersection and the Helmcken Road westbound approach includes a channelized right turn island. The left turn movements on Helmcken Road provide fully protected left turn signal phasing. The eastbound left turn movement (Watkiss Way onto Helmcken Road) provides protected/permitted left turn signal phasing.
2.3 TRAFFIC COUNT
Traffic count data was taken from a previous study. Turning movement counts were conducted for the Watkiss Way intersections during the AM and PM peak hours (8:00AM – 9:00AM and 4:00PM to 5:00PM, respectively) on the following dates:
- Watkiss Way / Burnside Road: November 14, 2018
- Watkiss Way / Erskine Lane: November 16, 2017
- Watkiss Way / Victoria General Access: November 13, 2018
The existing counts were adjusted to 2019 traffic volumes using a 2% annual growth rate. This growth rate was also used to determine future background traffic volumes. All traffic volumes were balanced.
For Helmcken Road / Watkiss Way / Chancellor Avenue the traffic count data was collected on January 20, 2020 during the AM and PM peak hours (8:00AM – 9:00AM and 4:00PM to 5:00PM). By January 2020 traffic on Highway 1 was able to free-flow at McKenzie Avenue / Admirals Road; however, the key elements of the interchange such as the dual right turn (free flow) from McKenzie to Highway 1 and the southbound cloverleaf were not completed. However, just having the Highway free flow reduced the traffic volumes on Helmcken Road between Watkiss Way / Chancellor Avenue by approximately 13% in the AM and 9% in the PM.
The completion of the McKenzie Interchange is expected to occur in the Fall of 2020. The completion of the interchange is expected to further reduce the traffic volumes on the Helmcken Road, Burnside Road, and Watkiss Way corridors as the increased capacity and free-flow at the interchange will draw traffic away from the circuitous routing they utilize now to avoid the delays at Highway 1/McKenzie/Admirals. Therefore the traffic volumes utilized for this study are worst case and not expected to as high as projected.
2.4 TRAFFIC MODEL
Weekday AM and PM peak hour traffic conditions will be modeled using Synchro 10 and SIDRA8 for the opening year full build-out and 10-year post opening year with and without the development traffic to identify short- and long-term impacts of the development. SIDRA will be used only to analyze traffic conditions at the roundabout (Watkiss Way / Hospital Access / Mall Access). Queue lengths were determined by SimTraffic.
Synchro software (Synchro 9/10) provides analysis using the Highway Capacity Manual (2010) methodology, while SimTraffic integrates established driver behaviors and characteristics to simulate actual conditions by randomly “seeding” or positioning vehicles travelling throughout the network. The software generates measures of effectiveness that include level of service (LOS), delay and 95th percentile queue length. Intersections are analyzed to determine the level of service, delays and 95th percentile queue lengths. The levels of service are broken down into six letter grades with LOS A being excellent operations and LOS F indicating failing operations. Level of service C is generally considered to be an acceptable LOS by most municipalities. Level of service D is generally considered to be on the threshold between acceptable and unacceptable operations. A description of level of service and Synchro software is provided in Appendix A.
The horizon years will be evaluated for impacts to traffic operations with and without the development. The results will be used to determine if mitigation measures are needed as a result of background traffic growth or as a result of the development. Simulation settings for Synchro analysis will include:
- Vehicle length of 7.5m;
- Heavy vehicle length of 22.7m;
- Peak hour factors will use count data from study; and
- Heavy vehicle percentage will be based on count data.
2.5 EXISTING TRAFFIC CONDITIONS (VIEW ROYAL)
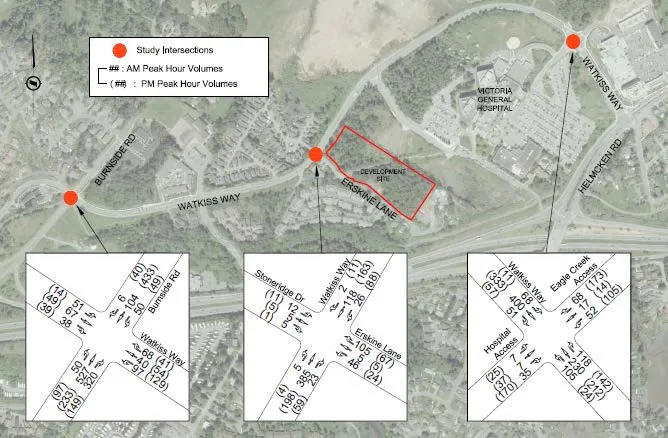
The existing 2019 / 2020 AM and PM peak hour conditions are summarized in Table 1, and traffic volumes are shown in Figure 2. All intersections operate at LOS C or better in the AM and PM peak hours, and there are no existing queuing issues.
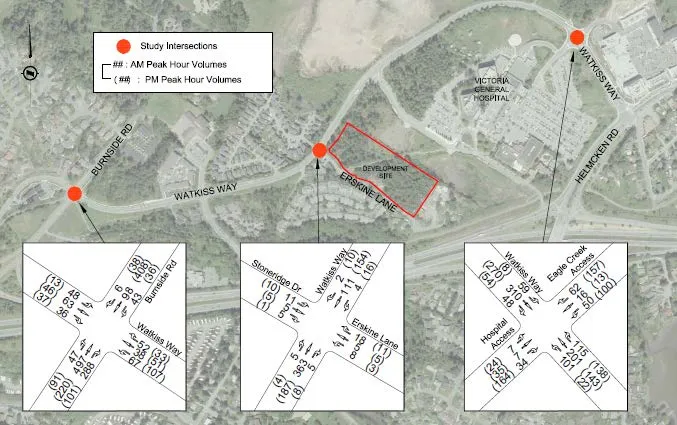
TABLE 1: 2019/2020 AM AND PM PEAK HOUR TRAFFIC CONDITIONS
| Intersection | Movement | AM Peak Hour | PM Peak Hour | ||||
|---|---|---|---|---|---|---|---|
| LOS | Delay (s) | 95th Queue (m) | LOS | Delay (s) | 95th Queue (m) | ||
| Burnside Rd W / Watkiss Way (Signalized) EB/WB=Watkiss Way NB/SB=Burnside Rd |
EBLTR | C | 23 | 30 | B | 12 | 25 |
| WBLTR | C | 29 | 35 | C | 28 | 35 | |
| NBLT | B | 8 | 60 | A | 7 | 55 | |
| NBR | A | 0 | 30 | A | 0 | 20 | |
| SBLTR | A | 7 | 30 | A | 9 | 55 | |
| Watkiss Way / Erskine Ln EB/WB=Watkiss Way NB/SB=Stoneridge Dr Erskine Ln |
EBL | A | 8 | 5 | A | 8 | 5 |
| EBTR | A | 0 | 5 | A | 0 | 5 | |
| WBL | A | 8 | 5 | A | 8 | 10 | |
| WBTR | A | 0 | 5 | A | 0 | 10 | |
| NBLTR | B | 13 | 15 | B | 12 | 10 |
| Intersection | Movement | AM Peak Hour | PM Peak Hour | ||||
|---|---|---|---|---|---|---|---|
| LOS | Delay (s) | 95th Queue (m) | LOS | Delay (s) | 95th Queue (m) | ||
| SBLTR | B | 14 | 10 | B | 13 | 10 | |
| Watkiss Way / Hospital - Mall Access EB/WB=Watkiss Way NB/SB=Hospital-Mall |
EBLTR | B | 13 | 35 | A | 9 | 20 |
| WBLT | A | 8 | 15 | A | 7 | 10 | |
| WBR | A | 0 | 0 | A | 2 | 10 | |
| NBLTR | A | 8 | 5 | B | 14 | 30 | |
| SBLTR | A | 8 | 10 | A | 10 | 20 |
2.6 EXISTING TRAFFIC CONDITIONS (MOTI)
The south leg of the Helmcken Road / Watkiss Way intersection is under the jurisdiction of the Ministry of Transportation and Infrastructure.
TABLE 2: 2020 AM AND PM PEAK HOUR TRAFFIC CONDITIONS AT WATKISS/HELMCKEN
| Movement | 2020AM Peak Hour | 2020 PM Peak Hour | ||||
|---|---|---|---|---|---|---|
| LOS | Delay (s) | 95th Queue (m) | LOS | Delay (s) | 95th Queue (m) | |
| EBL/T | D | 38.8 | 55 | E | 69.9 | 90 |
| EBR | A | 6.1 | 40 | C | 24.5 | 80 |
| WBL | C | 26.1 | 10 | D | 45.0 | 15 |
| WBT/R | B | 17.2 | 5 | C | 29.0 | 5 |
| NBL | E | 57.4 | 95 | F | 88.0 | 60 |
| NBT/R | B | 10.3 | 230 | B | 12.4 | 75 |
| SBL | D | 43.2 | 15 | E | 74.6 | 15 |
| SBT | C | 23.4 | 105 | C | 28.2 | 170 |
| SBR | A | 3.9 | 30 | A | 0.8 | 30 |
| NB/SB = Helmcken Road; EB/WB = Watkiss/Chancellor |
The queues for this intersection are based on SimTraffic and rounded up to the nearest 5m. The southbound queues are estimated at 170m in the afternoon by the software; however southbound queues (Helmcken Road north towards Interurban) are known to extend beyond the Burnside intersection in the PM peak hour (up to 1km). During the AM peak hour the northbound protected left turn operates at a LOS E with all other movements at LOS D or better. During the PM peak hour the eastbound left/through, northbound left and southbound left turns operate at a LOS E/F. As an isolated intersection the northbound/southbound through movements operate at a LOS C; however, delays in the southbound direction are known to be longer due to the queuing.
3.0 BACKGROUND TRAFFIC CONDITIONS
Background traffic was assessed at a linear growth rate of 2.0% per year. Traffic volumes were projected to the assumed opening day in 2022, and the 10 year post opening date horizon in 2032. The 2% growth rate accounts for known developments (HandyDart facility and Eagle Nest) as well unknown developments that could occur in the area.
The 2% growth rate adds approximately 50 vph to Watkiss Way and 70 vph to Burnside Road in the 2022 AM and PM peak hour horizon. For the long term (2032) the growth rate adds approximately 120 vph to Watkiss Way and up to 310 vph on Burnside Road. On Helmcken Road the 2% adds up to 65 vph in 2022 and up to 380 vph in the long term.
The additional trips added, due to growth, account for the Eagle Nest development traffic (4 to 8 vph on Watkiss Way in the peak hours and 12 to 35 vph on Helmcken Road from the Eagle Nest TIA) and the HandyDart Facility. It should be noted that BC Transit’s website states the...
HandyDart Facility will open in 2023, after the 2022 horizon year. Therefore no HandyDart trips would be included in the 2022 background traffic volumes.
A traffic impact study is currently underway for the HandyDart Facility; however, no results / information on this study is available at this time. It is expected that the access for this facility will be off Burnside Road to avoid crossing the Galloping Goose. Depending on the ability to provide a two way left turn lane to allow for lefts out of the facility to use the Helmcken Road / Six Mile / Island Highway interchange routing of the HandyDart traffic is not known.
A high level review of the potential trips generated by the HandyDart Facility was undertaken to ensure additional traffic was not required to be added to the background volumes. Based on the current HandyDart fleet of 54 to 56 vehicles and with an estimated 20% of those vehicles as spares (which is a conservative estimate of spare vehicles maintained by a transit agency) there is a maximum of 44 HandyDart vehicles that could leave the site in the morning and 44 return in the late afternoon. The late afternoon (3pm to 5pm) typically sees the majority of HandyDart vehicle return; however, a portion remain in-service until 10:00pm. Based on news articles this site could handle 110 HandyDart vehicles or approximately double the existing fleet. The expansion of the service from 55 vehicles to 110 vehicles will take time as well as funding resources to purchase vehicles, support additional service hours (drivers, fuel, etc.), and maintain the vehicles. The timeline for when 88 (with 22 spares for a total of 110) HandyDart vehicles could be in-service is unknown at this time. However, if assumed a portion (50%) would use Watkiss Way to Helmcken Road the addition of 44 trips in the long term is accounted for in the growth (HandyDart trips would be 37% of the trips added by the growth rate, which leaves additional growth (63% of the trips) for unknown developments in the area).
3.1 7 ERSKINE LANE TRAFFIC
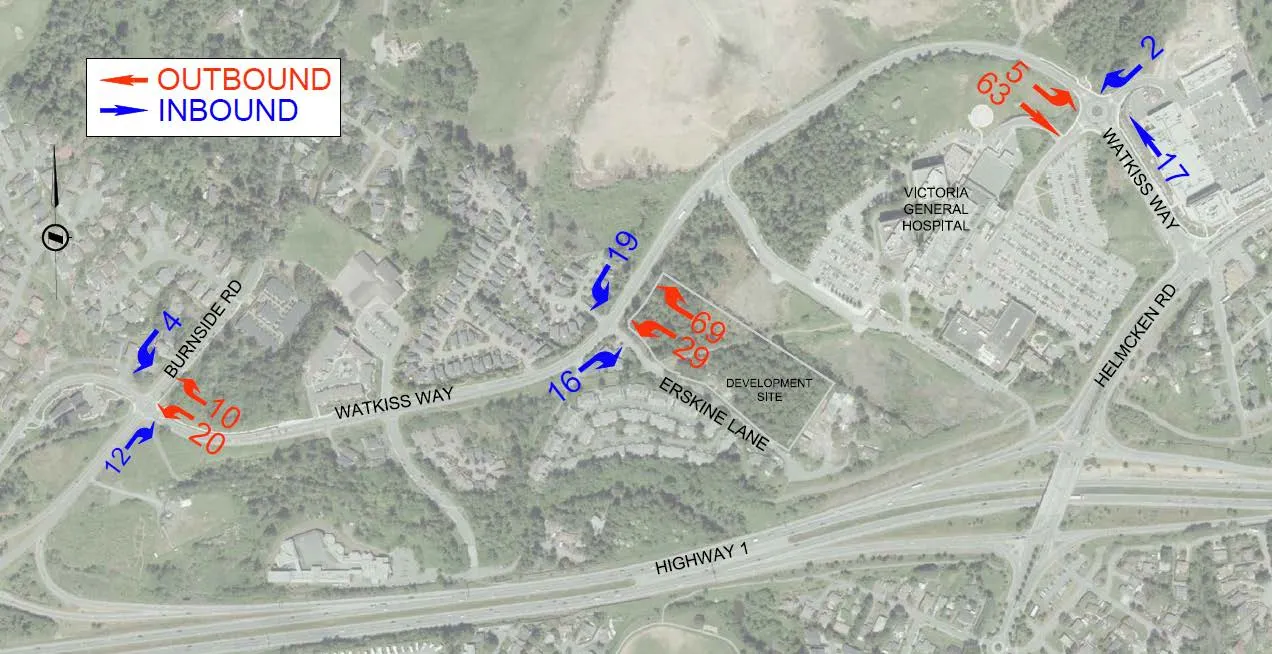
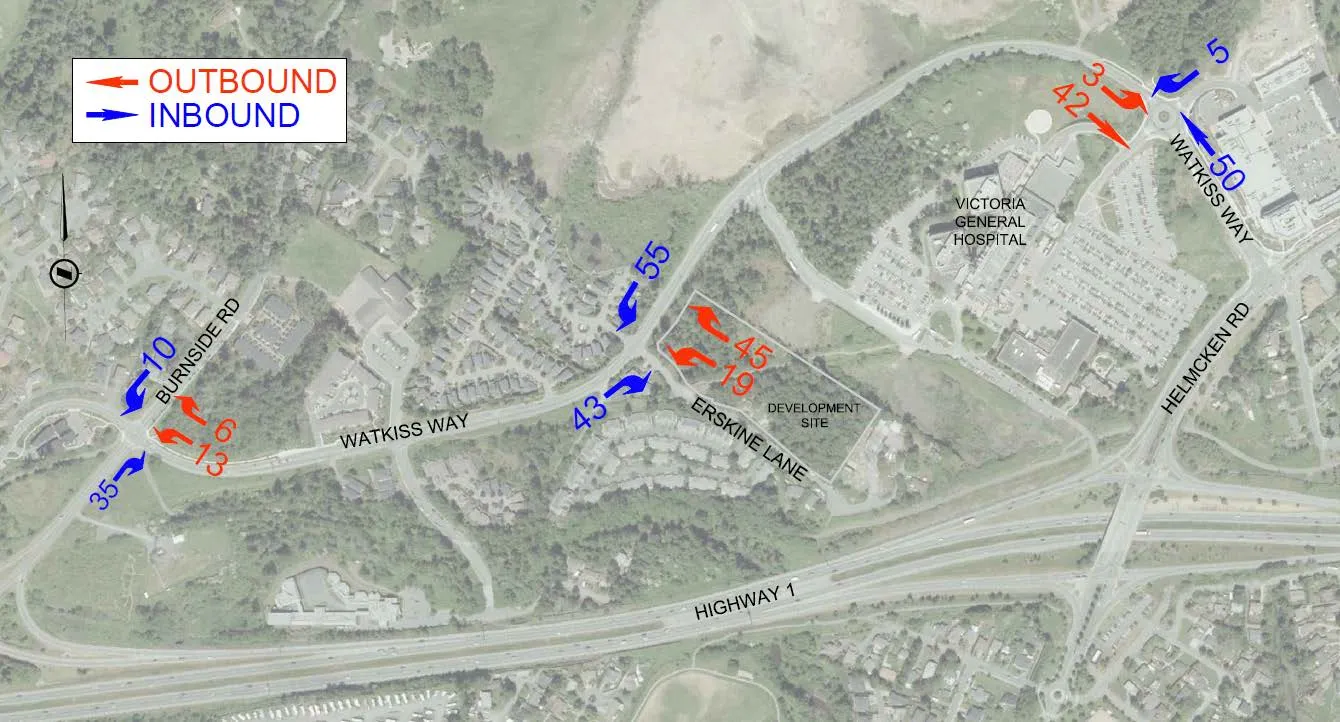
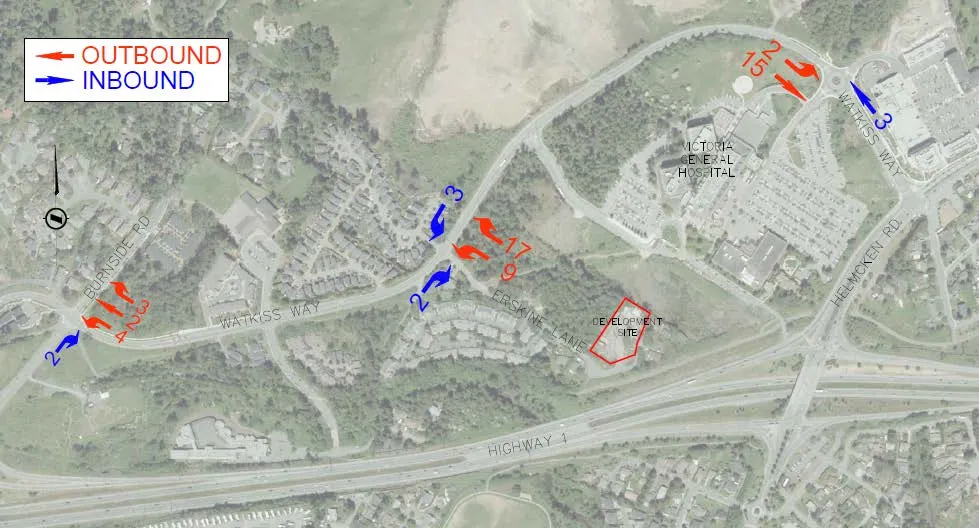
Since Erskine Lane is a dead-end road with relatively low volumes per movement (3 to 18 vehicles per hour per movement) the use of a growth rate to account for the proposed 7 Erskine Lane development would not generate sufficient trips. Therefore the traffic from the proposed 7 Erskine Lane development site was added to background traffic. The proposed development is a 70-unit multi-family building which will generate 31 trips in the AM peak hour, and 36 trips in the PM peak hour. The trips from the development were assigned with consideration to the original TIA at the Watkiss Way / Erskine Lane intersection, and then distributed according to the trip assignment in this TIA, discussed further in Section 4.3. See Figure 4 and Figure 5 to see the distribution of these trips through the network in the AM and PM peak hour.
3.2 2022 BACKGROUND TRAFFIC CONDITIONS
The 2022 AM and PM peak hour conditions are summarized in Table 3, and traffic volumes are shown in Figure 6. All intersections operate at LOS C or better in the AM and PM peak hours, and there are no queuing issues along Watkiss Way.
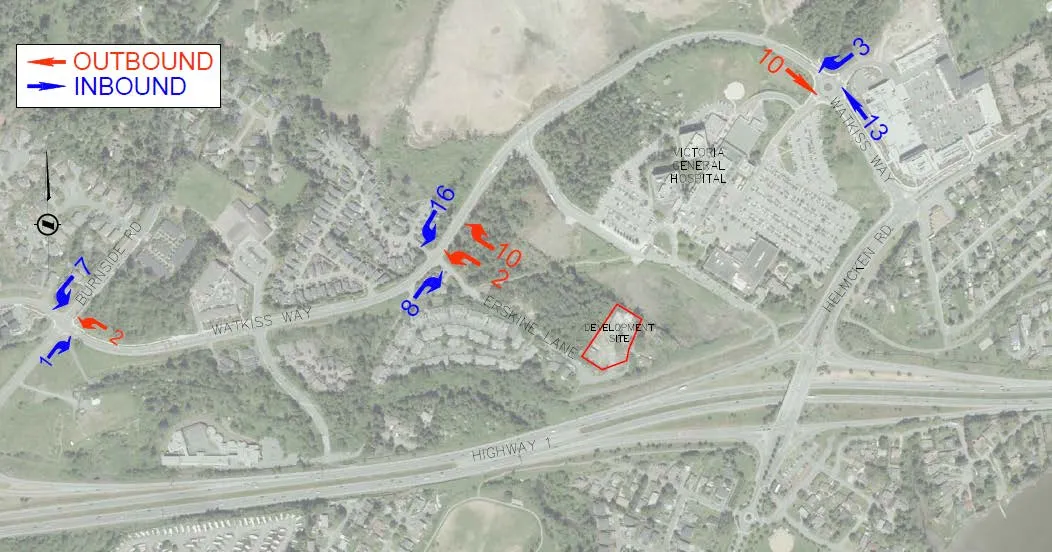
TABLE 3: 2022 BACKGROUND TRAFFIC CONDITIONS
| Intersection | Movement | 2022 AM Peak Hour | 2022 PM Peak Hour | ||||
|---|---|---|---|---|---|---|---|
| LOS | Delay (s) | 95th Queue (m) | LOS | Delay (s) | 95th Queue (m) | ||
| Burnside Rd W / Watkiss Way (Signalized) EB/WB=Watkiss Way NB/SB=Burnside Rd |
EBLTR | C | 22 | 35 | B | 13 | 25 |
| WBLTR | C | 31 | 35 | C | 34 | 45 | |
| NBLT | B | 9 | 70 | A | 7 | 55 | |
| NBR | A | 0 | 35 | A | 0 | 20 | |
| SBLTR | A | 7 | 30 | B | 10 | 55 | |
| Watkiss Way / Erskine Ln EB/WB=Watkiss Way NB/SB=Stoneridge Dr Erskine Ln |
EBL | A | 8 | 5 | A | 8 | 5 |
| EBTR | A | 0 | 5 | A | 0 | 5 | |
| WBL | A | 8 | 10 | A | 8 | 10 | |
| WBTR | A | 0 | 10 | A | 0 | 10 | |
| NBLTR | B | 14 | 15 | B | 12 | 15 | |
| SBLTR | C | 15 | 10 | B | 14 | 10 | |
| Watkiss Way / | EBLTR | B | 14 | 50 | A | 10 | 20 |
| Intersection | Movement | 2022 AM Peak Hour | 2022 PM Peak Hour | ||||
|---|---|---|---|---|---|---|---|
| LOS | Delay (s) | 95th Queue (m) | LOS | Delay (s) | 95th Queue (m) | ||
| Hospital - Mall Access EB/WB=Watkiss Way NB/SB=Hospital-Mall Access |
WBLT | A | 8 | 15 | A | 7 | 15 |
| WBR | A | 0 | 0 | A | 2 | 15 | |
| NBLTR | A | 8 | 5 | B | 16 | 35 | |
| SBLTR | A | 9 | 10 | B | 11 | 22 |
3.2.1 HELMCKEN / WATKISS INTERSECTION
Figure 7 illustrates the 2022 background traffic volumes at Helmcken Road / Watkiss Way.
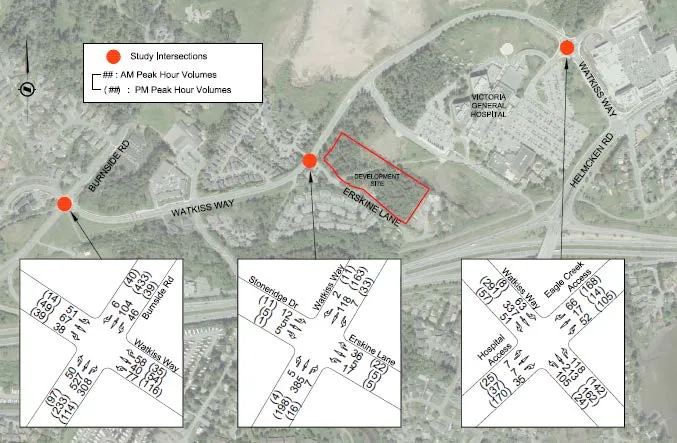
TABLE 4: 2022 AM AND PM PEAK HOUR BACKGROUND TRAFFIC CONDITIONS AT WATKISS/HELMCKEN
| Movement | 2022 AM Peak Hour | 2022 PM Peak Hour | ||||
|---|---|---|---|---|---|---|
| LOS | Delay (s) | 95th Queue (m) | LOS | Delay (s) | 95th Queue (m) | |
| EBL/T | D | 38.6 | 60 | E | 71.5 | 90 |
| EBR | A | 6.8 | 45 | C | 29.2 | 80 |
| WBL | C | 25.8 | 10 | D | 45.3 | 10 |
| WBT/R | B | 16.7 | 5 | C | 28.9 | 5 |
| NBL | E | 64.3 | 110 | F | 94.9 | 70 |
| NBT/R | B | 11.1 | 220 | B | 12.8 | 95 |
| SBL | D | 44.2 | 10 | E | 74.8 | 15 |
| SBT | C | 22.9 | 120 | C | 30.0 | 170 |
| SBR | A | 4.2 | 30 | A | 1.3 | 30 |
The addition of two years of growth does not change any of the levels of services; however, there are slight increases in delays and queue lengths. The northbound left turn queues will exceed the parallel storage and extend into the taper during the AM peak hour.
3.3 2032 BACKGROUND CONDITIONS
The 2032 AM and PM peak hour conditions are summarized in Table 5, and traffic volumes are shown in Figure 8. All intersection movements along the Watkiss Corridor operate at LOS C or better in the AM and PM peak hours, except for the westbound movement at Burnside Road W / Watkiss Way which will operate at a LOS D based on existing signal timing and phasing. The eastbound queue at the roundabout will be 110m or approximately 15 vehicles; however, the movement operates at a LOS C.
TABLE 5: 2032 BACKGROUND TRAFFIC CONDITIONS
| Intersection | Movement | 2032 AM Peak Hour | 2032 PM Peak Hour | ||||
|---|---|---|---|---|---|---|---|
| LOS | Delay (s) | 95th Queue (m) | LOS | Delay (s) | 95th Queue (m) | ||
| Burnside Rd W / Watkiss Way (Signalized) EB/WB=Watkiss Way NB/SB=Burnside Rd |
EBLTR | C | 27 | 40 | B | 14 | 30 |
| WBLTR | D | 47 | 35 | D | 44 | 50 | |
| NBLT | B | 13 | 90 | B | 10 | 100 | |
| NBR | A | 0 | 50 | A | 0 | 60 | |
| SBLTR | A | 9 | 50 | B | 15 | 90 | |
| Watkiss Way / Erskine Ln EB/WB=Watkiss Way NB/SB=Stoneridge Dr Erskine Ln |
EBL | A | 8 | 5 | A | 8 | 5 |
| EBTR | A | 0 | 5 | A | 0 | 5 | |
| WBL | A | 9 | 5 | A | 8 | 10 | |
| WBTR | A | 0 | 5 | A | 0 | 10 | |
| NBLTR | C | 18 | 15 | B | 14 | 15 | |
| SBLTR | C | 19 | 10 | C | 16 | 10 | |
| Watkiss Way / Hospital - Mall Access EB/WB=Watkiss Way |
EBLTR | C | 22 | 110 | B | 13 | 40 |
| WBLT | A | 10 | 20 | A | 9 | 15 | |
| WBR | A | 0 | 0 | A | 2 | 15 |
| Intersection | Movement | 2032 AM Peak Hour | 2032 PM Peak Hour | ||||
|---|---|---|---|---|---|---|---|
| LOS | Delay (s) | 95th Queue (m) | LOS | Delay (s) | 95th Queue (m) | ||
| NB/SB=Hospital-Mall Access | NBLTR | A | 9 | 5 | C | 28 | 75 |
| SBLTR | A | 11 | 15 | B | 15 | 45 |
3.3.1 HELMCKEN / WATKISS INTERSECTION
Figure 9 provides the 2032 AM peak hour and PM peak hour traffic volumes.
TABLE 6: 2032 AM AND PM PEAK HOUR BACKGROUND TRAFFIC CONDITIONS AT WATKISS/HELMCKEN
| Movement | 2032 AM Peak Hour | 2032 PM Peak Hour | ||||
|---|---|---|---|---|---|---|
| LOS | Delay (s) | 95th Queue (m) | LOS | Delay (s) | 95th Queue (m) | |
| EBL/T | D | 37.7 | 65 | F | 84.2 | 100 |
| EBR | B | 14.1 | 55 | E | 55.2 | 80 |
| WBL | C | 25.0 | 10 | D | 47.9 | 20 |
| WBT/R | B | 14.7 | 5 | C | 27.4 | 10 |
| NBL | F | 114.7 | 130* | F | 175.2 | 125* |
| NBT/R | B | 13.9 | 255 | B | 14.3 | 255 |
| SBL | D | 47.2 | 10 | E | 76.5 | 15 |
| SBT | D | 40.9 | 130 | D | 43.2 | 335 |
| SBR | A | 7.2 | 45 | A | 2.4 | 30 |
| *Queues exceed storage |
In 2032, during the AM peak hour with existing signal timings, the eastbound right turn will drop to a LOS B (from LOS A), the northbound left will drop to a LOS F (from LOS E), and the southbound through movement will drop to a LOS D (from LOS C). In the PM peak hour the eastbound left/through drops to LOS F and eastbound right drops to a LOS E (from LOS C). The southbound through will also drops to a LOS D from LOS C. Queues, particularly in the southbound direction will increase by more than 150m. The northbound left turns will extend beyond the provided storage with the background traffic growth. Adjustments in signal timing may be required to accommodate the northbound left turn volumes if these volumes are reached.
4.0 POST DEVELOPMENT CONDITIONS
4.1 PROPOSED LAND USE
The development will consist of 362 dwelling units in four mid-rise buildings (6 storeys). Trip generation rates were estimated using the 10th Edition of the ITE Trip Generation Manual. Trip generation rates for the weekday AM and PM peak hours are shown in Table 7. Table 8 shows the estimated trips generated by the proposed development. They equate to 130 weekday AM peak hour trips and 158 weekday PM peak hour trips.
TABLE 7: PEAK HOUR TRIP GENERATION RATES
| ITE Land Use | Weekday AM | Weekday PM | |||||
|---|---|---|---|---|---|---|---|
| Code | Description | Rate | In | Out | Rate | In | Out |
| 221 | Multi-Family Housing (Mid-Rise) | 0.36 | 26% | 74% | 0.44 | 61% | 39% |
TABLE 8: PEAK HOUR DEVELOPMENT TRIPS
| Description | Units | Weekday AM | Weekday PM | ||||
|---|---|---|---|---|---|---|---|
| In | Out | Total | In | Out | Total | ||
| Multi-Family Housing (Mid-Rise) | 372 | 35 | 99 | 134 | 100 | 64 | 164 |
4.2 SITE ACCESS
The site is accessed from Erskine Lane via Watkiss Way. Pedestrians and cyclists have the option to use the connection to Galloping Goose Trail at the south end of Erskine Lane to walk/bike to the site. There is a trail passing through the site that connects Erskine Lane to the Victoria General Hospital.
There are two accesses proposed on Erskine Road. One site access is proposed for the two buildings north of the trail to the hospital, and the second site access is proposed for the two buildings south of the trail. See Figure 10 for the site plan.
4.3 TRIP ASSIGNMENT
The site trips were assigned based on the existing traffic distributions and consideration of nearby origin / destinations. The following summarizes directional split percentages of the site trips.
Trips In
- 50% of trips from Helmcken Road;
- 35% of trips from Burnside Road (South);
- 10% of trips from Burnside Road (North);
- 5% of trips from Eagle Creek Village;
Trips Out
- 65% of trips to Helmcken Road;
- 20% of trips to Burnside Road (South);
- 10% of trips to Burnside Road (North)
- 5% of trips to Eagle Creek Village;
For the Watkiss Way / Helmcken Road intersection traffic was split as follows: AM Trips In
- 75% of trips from Helmcken Road Northbound Left (12);
- 25% of trips from Helmcken Road Southbound Right (5).
AM Trips Out
- 52% of trips Eastbound left (33);
- 48% of trips Eastbound right (30).
PM Trips In
- 75% of trips from Helmcken Road Northbound Left (37);
- 25% of trips from Helmcken Road Southbound Right (13).
PM Trips Out
- 39% of trips Eastbound left (16);
- 61% of trips Eastbound right (26).
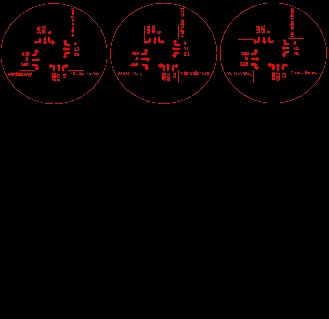
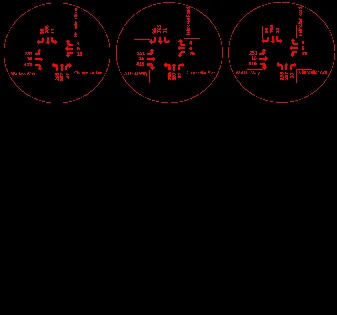
Figure 11 and Figure 12 show the trip assignments for AM and PM peak hours.
4.4 2022 OPENING DAY TRAFFIC CONDITIONS
The 2022 AM and PM peak hour conditions are summarized in Table 9, and traffic volumes are shown in Figure 13. All intersections along Watkiss Way operate at LOS D or better in the AM and PM peak hours, and there are no queuing issues. The westbound movement at Burnside Road W / Watkiss Way worsens to LOS D from LOS C with the addition of development traffic, however, only two additional seconds of delay are added indicating that the movement was already borderline at a LOS C/D.
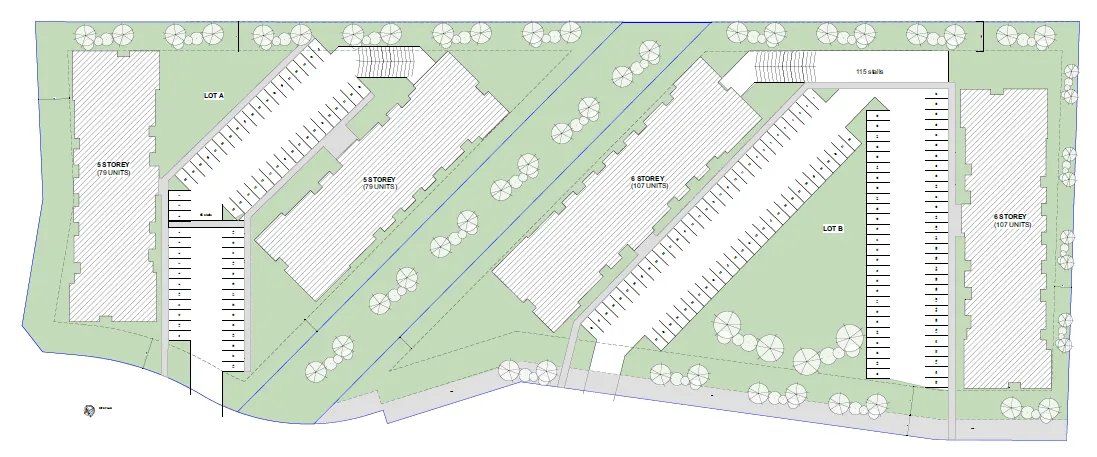
TABLE 9: 2022 POST DEVELOPMENT TRAFFIC CONDIITONS
| Intersection | Movement | 2022 AM Peak Hour | 2022 PM Peak Hour | ||||
|---|---|---|---|---|---|---|---|
| LOS | Delay (s) | 95th Queue (m) | LOS | Delay (s) | 95th Queue (m) | ||
| Burnside Rd W / Watkiss Way (Signalized) EB/WB=Watkiss Way NB/SB=Burnside Rd |
EBLTR | B | 18 | 30 | B | 13 | 25 |
| WBLTR | C | 31 | 35 | D | 36 | 50 | |
| NBLT | B | 15 | 65 | A | 7 | 60 | |
| NBR | A | 0 | 35 | A | 0 | 20 | |
| SBLTR | A | 8 | 35 | B | 11 | 70 | |
| Watkiss Way / Erskine Ln EB/WB=Watkiss Way NB/SB=Stoneridge Dr Erskine Ln |
EBL | A | 8 | 5 | A | 8 | 5 |
| EBTR | A | 0 | 5 | A | 0 | 5 | |
| WBL | A | 9 | 10 | A | 8 | 15 | |
| WBTR | A | 0 | 10 | A | 0 | 15 | |
| NBLTR | C | 23 | 25 | C | 19 | 15 | |
| SBLTR | C | 21 | 15 | C | 20 | 10 | |
| Watkiss Way / Hospital - Mall Access | EBLTR | B | 17 | 75 | B | 11 | 25 |
| WBLT | A | 9 | 20 | A | 8 | 15 | |
| WBR | A | 0 | 0 | A | 1 | 15 |
Document Images
(4)