Land Use Plans and Imperviousness Values Excerpt
Textual excerpt from the Master Drainage Plan Update regarding imperviousness values for various land uses.
3.1.2 Land Use Plans and Imperviousness Values
Percent of imperviousness value were determined for each catchment based on land uses in the catchment to properly simulate the corresponding land coverage. For the existing condition, the Town’s zoning map and latest orthophotos were referenced to develop the existing land-use map. For the future condition, the land use designations illustrated in the Town’s Official Community Plan (OCP) were adopted. The existing and future land-use maps for the study area can referenced in Figure 2 and Figure 3.
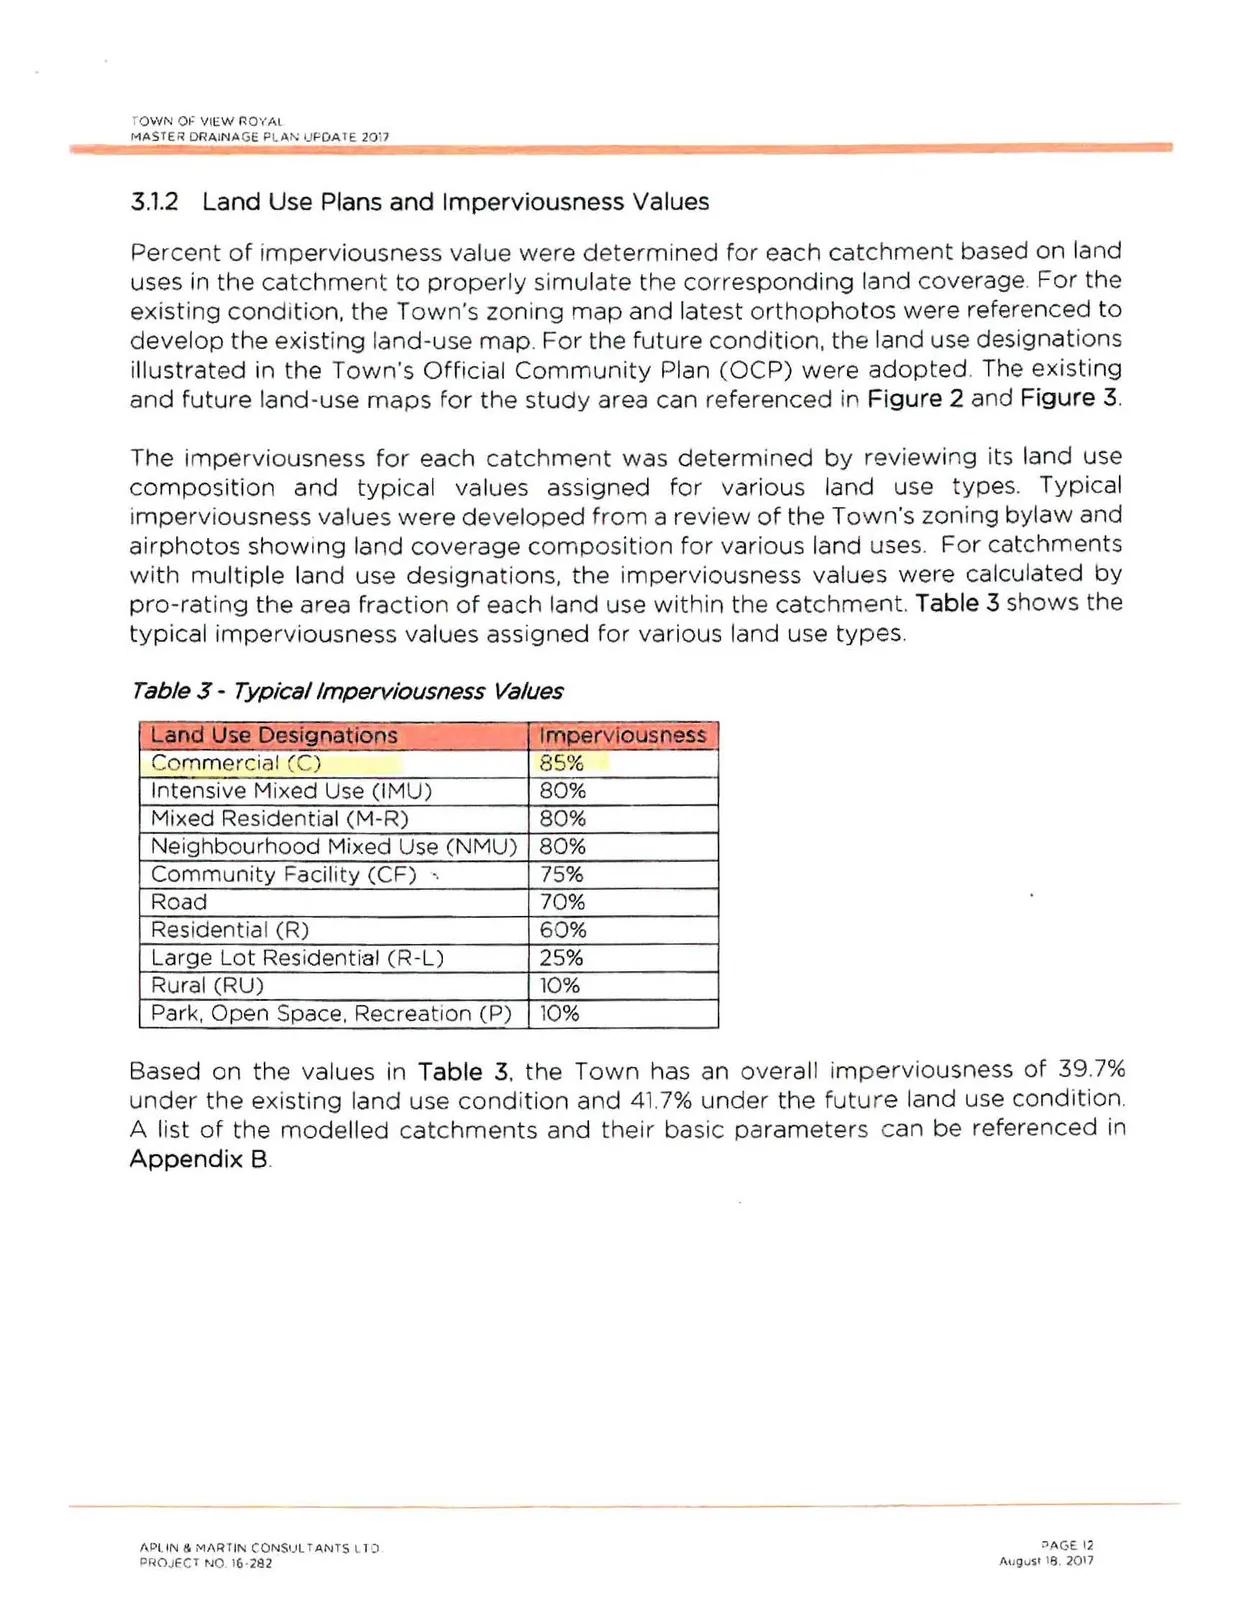
The imperviousness for each catchment was determined by reviewing its land use composition and typical values assigned for various land use types. Typical imperviousness values were developed from a review of the Town’s zoning bylaw and airphotos showing land coverage composition for various land uses. For catchments with multiple land use designations, the imperviousness values were calculated by pro-rating the area fraction of each land use within the catchment. Table 3 shows the typical imperviousness values assigned for various land use types.
Table 3 - Typical Imperviousness Values
| Land Use Designations | Imperviousness |
|---|---|
| Commercial (C) | 85% |
| Intensive Mixed Use (IMU) | 80% |
| Mixed Residential (M-R) | 80% |
| Neighbourhood Mixed Use (NMU) | 80% |
| Community Facility (CF) | 75% |
| Road | 70% |
| Residential (R) | 60% |
| Large Lot Residential (R-L) | 25% |
| Rural (RU) | 10% |
| Park, Open Space, Recreation (P) | 10% |
Based on the values in Table 3, the Town has an overall imperviousness of 39.7% under the existing land use condition and 41.7% under the future land use condition. A list of the modelled catchments and their basic parameters can be referenced in Appendix B.
Document Images
(1)