Surrey Fire Services Dispatch Annual Report for View Royal Fire Rescue 2018
Annual report on dispatch operations, performance standards, and incident statistics following the transition to Surrey dispatch.
Surrey Fire Services Dispatch Annual Report for View Royal Fire Rescue
2018
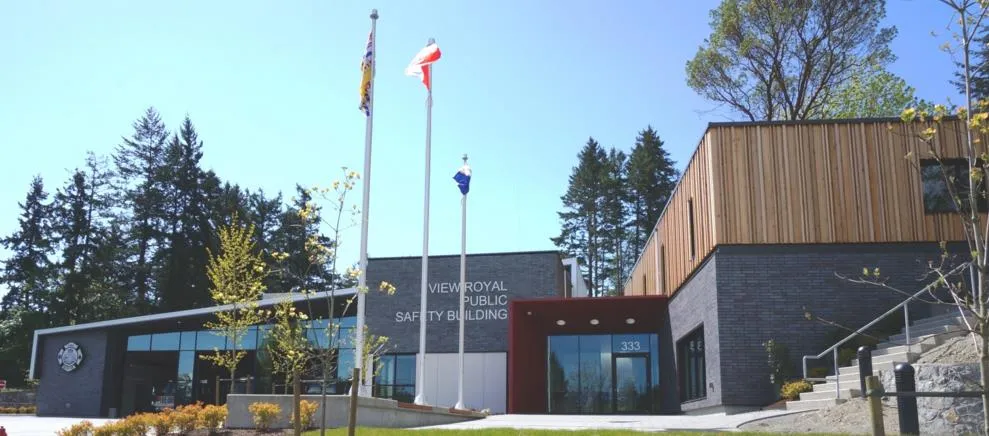
This following report is a detailed account of FDM CAD and RMS statistical data for review, Dispatch performance standards, Dispatch service equipment upgrades, as well as systems availability during the year.
Table of Contents
- View Royal Fire Rescue Incident Statistics - 3
- View Royal Fire Rescue Mesa Calls - 5
- Surrey Regional Dispatch Total Incident Statistics - 6
- Total Centre Call Volume Decrease from 2017 - 8
- December 20th Wind Storm - 11
- Dispatch Performance - 14
- Dispatch Services Uptimes and Outages/Issues - 16
- Dispatch Service and Equipment Upgrades - 17
- 2019 Upcoming Projects and Initiatives - 20
View Royal Fire Rescue Incident Statistics
View Royal Incidents by Month: 229
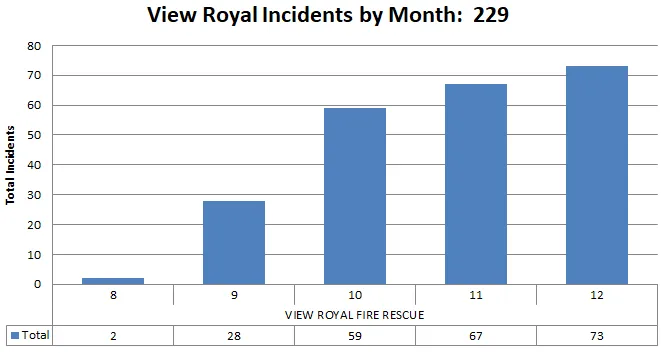
| Month | Total |
|---|---|
| 8 | 2 |
| 9 | 28 |
| 10 | 59 |
| 11 | 67 |
| 12 | 73 |
View Royal Incidents by Day of Week: 229
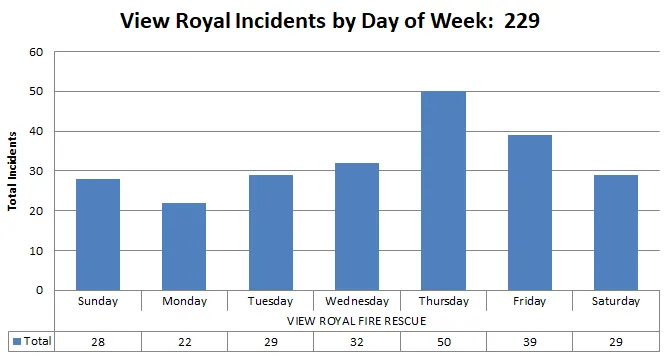
| Day | Total |
|---|---|
| Sunday | 28 |
| Monday | 22 |
| Tuesday | 29 |
| Wednesday | 32 |
| Thursday | 50 |
| Friday | 39 |
| Saturday | 29 |
View Royal Incidents by Type: 229
| Incident Type | Total |
|---|---|
| ALARMS - SF RESIDENTIAL | 3 |
| ALARMS RINGING - MR / COMMERCI | 14 |
| ASSIST CALL | 20 |
| BRUSH/GRASS FIRE | 1 |
| BURNING COMPLAINT | 6 |
| CARBON MONOXIDE ALARMS | 3 |
| GASOLINE/DIESEL SPILL | 1 |
| HYDRO POLE FIRE | 2 |
| INVESTIGATION | 4 |
| LIFT ASSIST | 8 |
| MESA | 115 |
| MISC/OTHER/SPECIAL/NOT LISTED | 2 |
| MVA | 29 |
| MVA - RESCUE REQUIRED | 3 |
| NATURAL GAS LEAK/SMELL | 4 |
| PUBLIC ASSISTANCE | 2 |
| RESCUE - WATER | 1 |
| ROAD FLUSH | 1 |
| STRUCTURE FIRE - COMMERCIAL | 2 |
| STRUCTURE FIRE - RESIDENTIAL | 2 |
| VEHICLE FIRE - BUS/CAMPER/RV | 1 |
| VEHICLE FIRE - CAR/TRK/MC/LNMW | 3 |
| WIRES DOWN | 2 |
View Royal Fire Rescue Mesa Calls
Total 115
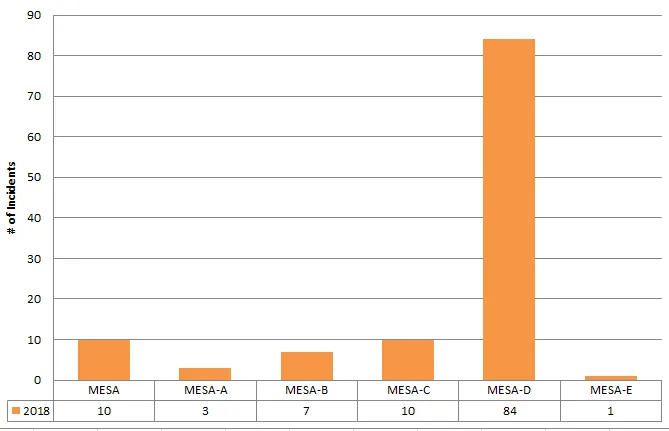
| Mesa Category | 2018 |
|---|---|
| MESA | 10 |
| MESA-A | 3 |
| MESA-B | 7 |
| MESA-C | 10 |
| MESA-D | 84 |
| MESA-E | 1 |
Surrey Regional Dispatch Total Incident Statistics
(Including Fire, Medical, Rescue, Public Assist, Public Works, Bylaws)
2018 Total Incidents by Month: 75,493
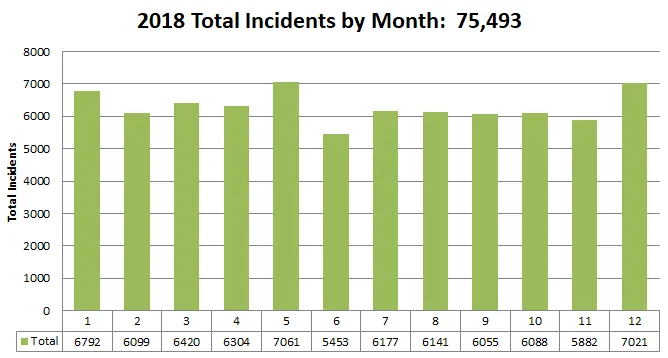
| Month | 1 | 2 | 3 | 4 | 5 | 6 | 7 | 8 | 9 | 10 | 11 | 12 |
|---|---|---|---|---|---|---|---|---|---|---|---|---|
| Total | 6792 | 6099 | 6420 | 6304 | 7061 | 5453 | 6177 | 6141 | 6055 | 6088 | 5882 | 7021 |
Note: Not included in the above total are 3,533 transferred incidents, that were created for tracking purposes, where calls were either misdirected from other PSAPs (ie Ecomm, Westshore PD, Victoria PD) or BCAS, or where calls were received in the centre from the public that were intended for other outside agencies (ie police, forestry, BCAS).
2018 Total Incidents by Day of Week: 75,493
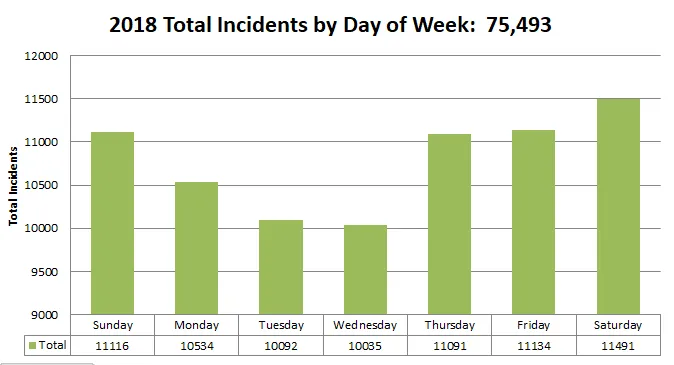
| Day | Sunday | Monday | Tuesday | Wednesday | Thursday | Friday | Saturday |
|---|---|---|---|---|---|---|---|
| Total | 11116 | 10534 | 10092 | 10035 | 11091 | 11134 | 11491 |
2018 Total Incidents by Hour of Day: 75,493
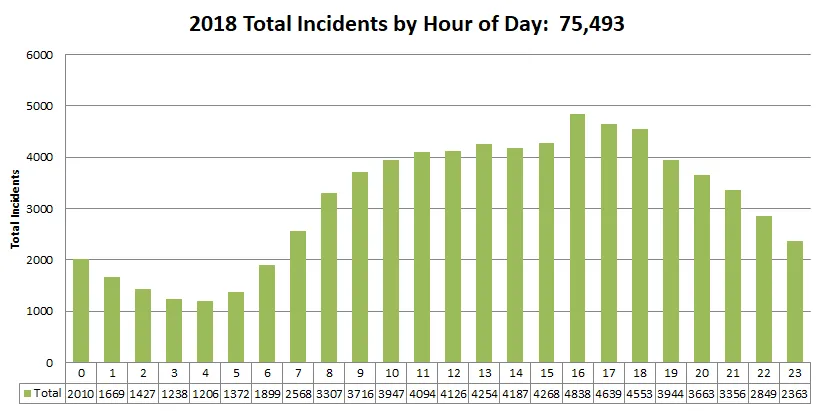
| Hour | 0 | 1 | 2 | 3 | 4 | 5 | 6 | 7 | 8 | 9 | 10 | 11 | 12 | 13 | 14 | 15 | 16 | 17 | 18 | 19 | 20 | 21 | 22 | 23 |
|---|---|---|---|---|---|---|---|---|---|---|---|---|---|---|---|---|---|---|---|---|---|---|---|---|
| Total | 2010 | 1669 | 1427 | 1238 | 1206 | 1372 | 1899 | 2568 | 3307 | 3716 | 3947 | 4094 | 4126 | 4254 | 4187 | 4268 | 4838 | 4639 | 4553 | 3944 | 3663 | 3356 | 2849 | 2363 |
Total Centre Call Volume Decrease from 2017
When comparing the total mesa call incident data from 2017 (84,358) to 2018 (74,493), the significant drop in call volume (8,865) is primarily due to the BC EHS Clinical Response Model Changeover that occurred at the end of May 2018. The largest decrease occurred with the Mesa-B and Mesa-C incident types.
Total Dispatch Centre Mesa Calls
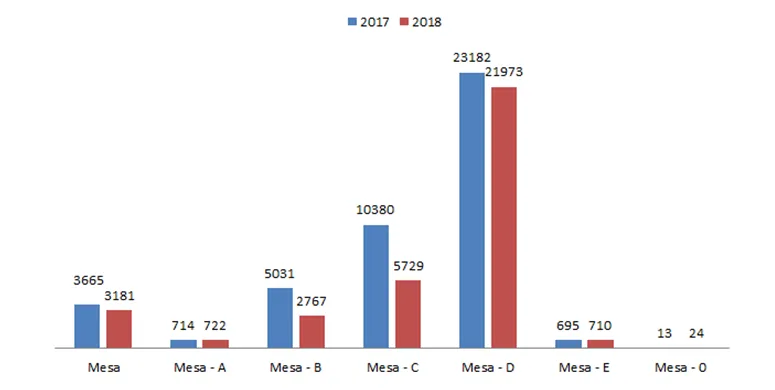
| Metric | Value |
|---|---|
| 2017 Mesa Calls | 43,680 |
| 2018 Mesa Calls | 35,106 |
| Decrease | 8,574 |
| Decrease in % | -19.62% |
911 Calls Answered by Month: 19,571
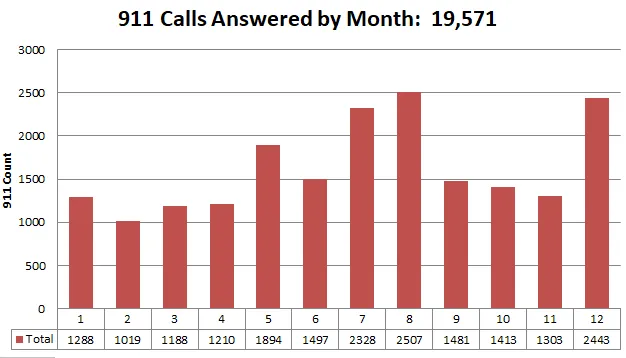
| Month | 1 | 2 | 3 | 4 | 5 | 6 | 7 | 8 | 9 | 10 | 11 | 12 |
|---|---|---|---|---|---|---|---|---|---|---|---|---|
| Total | 1288 | 1019 | 1188 | 1210 | 1894 | 1497 | 2328 | 2507 | 1481 | 1413 | 1303 | 2443 |
911 Calls Answered by Day of Week: 19,571
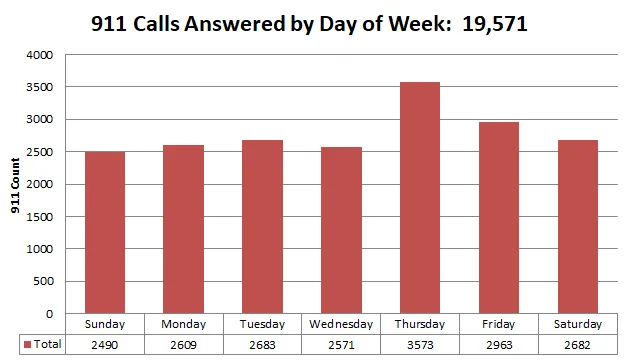
| Day | Sunday | Monday | Tuesday | Wednesday | Thursday | Friday | Saturday |
|---|---|---|---|---|---|---|---|
| Total | 2490 | 2609 | 2683 | 2571 | 3573 | 2963 | 2682 |
911 Calls Answered by Hour of Day: 19,571
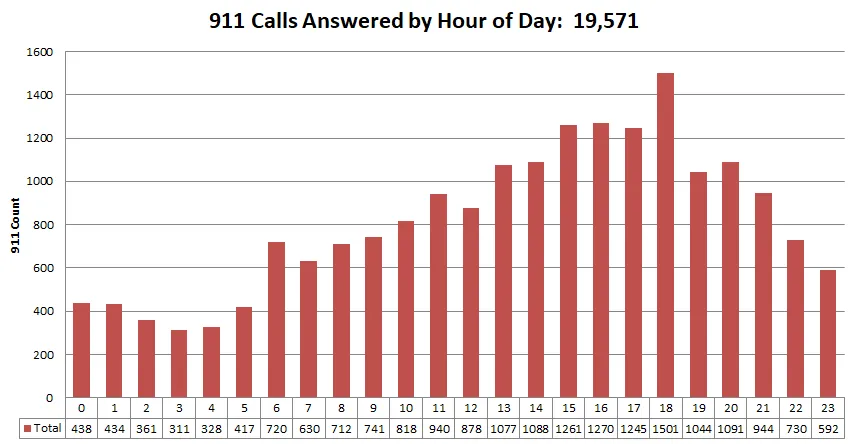
| Hour | 0 | 1 | 2 | 3 | 4 | 5 | 6 | 7 | 8 | 9 | 10 | 11 | 12 | 13 | 14 | 15 | 16 | 17 | 18 | 19 | 20 | 21 | 22 | 23 |
|---|---|---|---|---|---|---|---|---|---|---|---|---|---|---|---|---|---|---|---|---|---|---|---|---|
| Total | 438 | 434 | 361 | 311 | 328 | 417 | 720 | 630 | 712 | 741 | 818 | 940 | 878 | 1077 | 1088 | 1261 | 1270 | 1245 | 1501 | 1044 | 1091 | 944 | 730 | 592 |
December 20th Wind Storm
On December 20th at approximately 10:00, Vancouver Island and the Lower Mainland were hit with an intense wind storm, with reports of gusting winds 90+ km per hour lasting for several hours into the evening. Our enhanced reader board provided us great insight to the 911 queue and allowed us to dynamically shift resources between dispatch and call taking responsibilities.
Dec 20th 911 Calls by Hour: 944
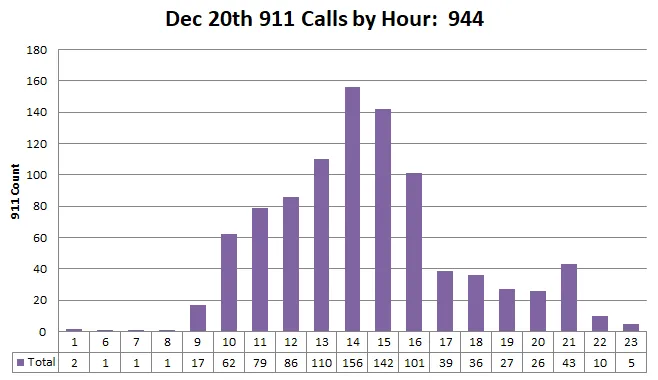
| Hour | 1 | 6 | 7 | 8 | 9 | 10 | 11 | 12 | 13 | 14 | 15 | 16 | 17 | 18 | 19 | 20 | 21 | 22 | 23 |
|---|---|---|---|---|---|---|---|---|---|---|---|---|---|---|---|---|---|---|---|
| Total | 2 | 1 | 1 | 1 | 17 | 62 | 79 | 86 | 110 | 156 | 142 | 101 | 39 | 36 | 27 | 26 | 43 | 10 | 5 |
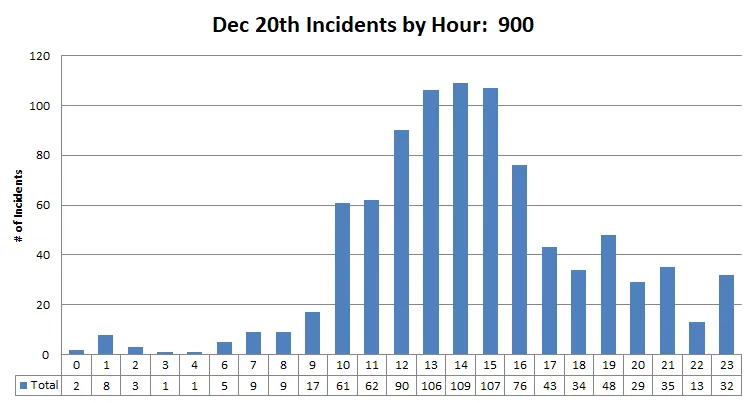
Dec 20th Incidents by Hour: 900
| Hour | 0 | 1 | 2 | 3 | 4 | 6 | 7 | 8 | 9 | 10 | 11 | 12 | 13 | 14 | 15 | 16 | 17 | 18 | 19 | 20 | 21 | 22 | 23 |
|---|---|---|---|---|---|---|---|---|---|---|---|---|---|---|---|---|---|---|---|---|---|---|---|
| Total | 2 | 8 | 3 | 1 | 1 | 5 | 9 | 9 | 17 | 61 | 62 | 90 | 106 | 109 | 107 | 76 | 43 | 34 | 48 | 29 | 35 | 13 | 32 |
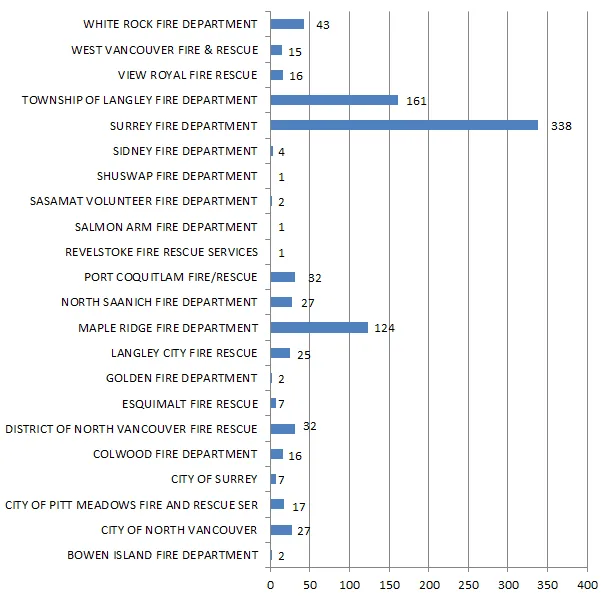
Dec 20th Incidents by Department: 900
| Department | Incidents |
|---|---|
| WHITE ROCK FIRE DEPARTMENT | 43 |
| WEST VANCOUVER FIRE & RESCUE | 15 |
| VIEW ROYAL FIRE RESCUE | 16 |
| TOWNSHIP OF LANGLEY FIRE DEPARTMENT | 161 |
| SURREY FIRE DEPARTMENT | 338 |
| SIDNEY FIRE DEPARTMENT | 4 |
| SHUSWAP FIRE DEPARTMENT | 1 |
| SASAMAT VOLUNTEER FIRE DEPARTMENT | 2 |
| SALMON ARM FIRE DEPARTMENT | 1 |
| REVELSTOKE FIRE RESCUE SERVICES | 1 |
| PORT COQUITLAM FIRE/RESCUE | 32 |
| NORTH SAANICH FIRE DEPARTMENT | 27 |
| MAPLE RIDGE FIRE DEPARTMENT | 124 |
| LANGLEY CITY FIRE RESCUE | 25 |
| GOLDEN FIRE DEPARTMENT | 2 |
| ESQUIMALT FIRE RESCUE | 7 |
| DISTRICT OF NORTH VANCOUVER FIRE RESCUE | 32 |
| COLWOOD FIRE DEPARTMENT | 16 |
| CITY OF SURREY | 7 |
| CITY OF PITT MEADOWS FIRE AND RESCUE SER | 17 |
| CITY OF NORTH VANCOUVER | 27 |
| BOWEN ISLAND FIRE DEPARTMENT | 2 |
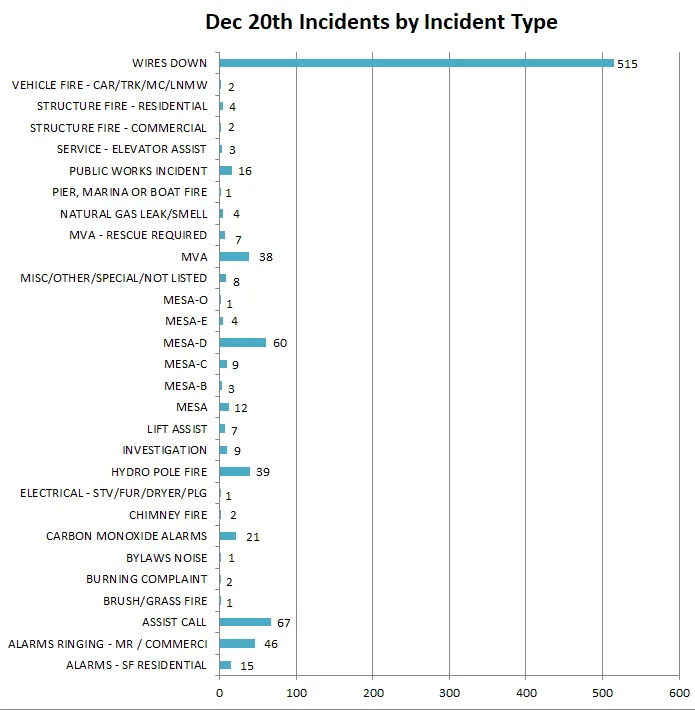
Dec 20th Incidents by Incident Type
| Incident Type | Total |
|---|---|
| WIRES DOWN | 515 |
| VEHICLE FIRE - CAR/TRK/MC/LNMW | 2 |
| STRUCTURE FIRE - RESIDENTIAL | 4 |
| STRUCTURE FIRE - COMMERCIAL | 2 |
| SERVICE - ELEVATOR ASSIST | 3 |
| PUBLIC WORKS INCIDENT | 16 |
| PIER, MARINA OR BOAT FIRE | 1 |
| NATURAL GAS LEAK/SMELL | 4 |
| MVA - RESCUE REQUIRED | 7 |
| MVA | 38 |
| MISC/OTHER/SPECIAL/NOT LISTED | 8 |
| MESA-O | 1 |
| MESA-E | 4 |
| MESA-D | 60 |
| MESA-C | 9 |
| MESA-B | 3 |
| MESA | 12 |
| LIFT ASSIST | 7 |
| INVESTIGATION | 9 |
| HYDRO POLE FIRE | 39 |
| ELECTRICAL - STV/FUR/DRYER/PLG | 1 |
| CHIMNEY FIRE | 2 |
| CARBON MONOXIDE ALARMS | 21 |
| BYLAWS NOISE | 1 |
| BURNING COMPLAINT | 2 |
| BRUSH/GRASS FIRE | 1 |
| ASSIST CALL | 67 |
| ALARMS RINGING - MR / COMMERCI | 46 |
| ALARMS - SF RESIDENTIAL | 15 |
Note: Not included in the above incident totals are 72 transferred incidents, that were created for tracking purposes, where calls were either misdirected from other PSAPs (ie Ecomm, Westshore PD, Victoria PD) or where calls were received in the centre from the public that were intended for other outside agencies (ie police, forestry, BCAS).
Dispatch Performance
Surrey Fire Dispatchers are committed to providing service excellence in call handling and dispatching of emergency incidents.
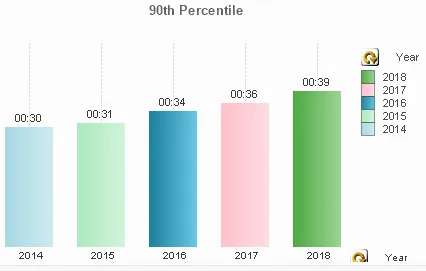
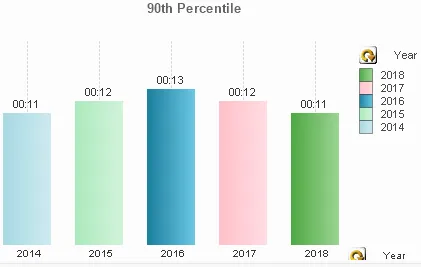
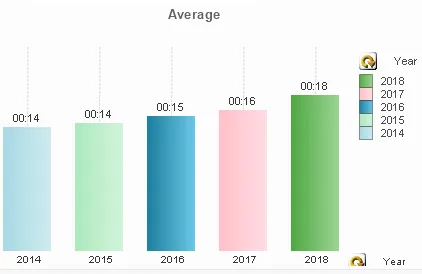
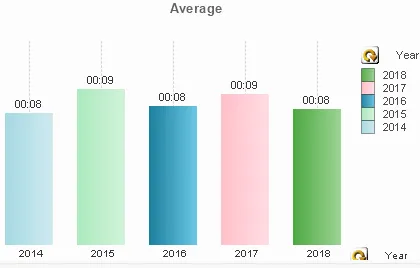
Our performance statistics for the past 5 years are provided below. Surrey Fire Dispatch continually meets and exceeds the NFPA 1221 standard year after year.
Standard is NFPA 1221 – 2016: Emergency call processing 64 seconds or less 90% of the time
90th % Call Processing in seconds
| Year | 2014 | 2015 | 2016 | 2017 | 2018 |
|---|---|---|---|---|---|
| Time | 00:30 | 00:31 | 00:34 | 00:36 | 00:39 |
90th % Dispatch in seconds
| Year | 2014 | 2015 | 2016 | 2017 | 2018 |
|---|---|---|---|---|---|
| Time | 00:11 | 00:12 | 00:13 | 00:12 | 00:11 |
| Average 90% Call Handling (5 year period) | Value |
|---|---|
| Call Handling | 34.0 seconds |
| Dispatch | 11.8 seconds |
| Total | 45.8 seconds |
Average Call Processing in seconds
| Year | 2014 | 2015 | 2016 | 2017 | 2018 |
|---|---|---|---|---|---|
| Time | 00:14 | 00:14 | 00:15 | 00:16 | 00:18 |
Average Call Dispatch in seconds
| Year | 2014 | 2015 | 2016 | 2017 | 2018 |
|---|---|---|---|---|---|
| Time | 00:08 | 00:09 | 00:08 | 00:09 | 00:08 |
| Average Call Handling (5 year period) | Value |
|---|---|
| Call Handling | 15.4 seconds |
| Dispatch | 8.4 seconds |
| Total | 23.8 seconds |
Dispatch Services Uptimes and Outages/Issues
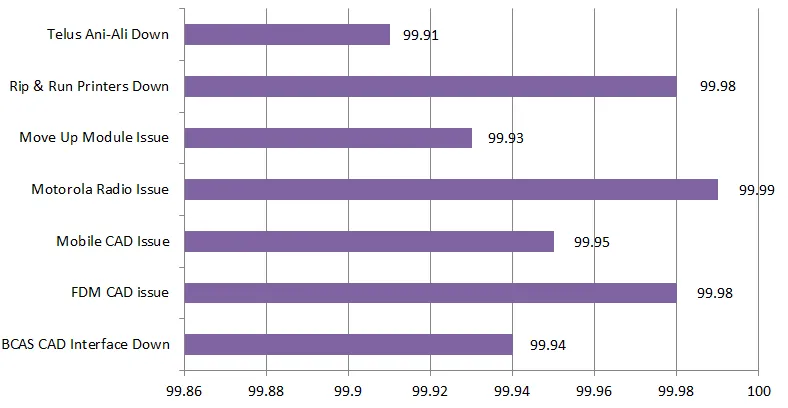
System uptimes are calculated to quantify the service that occurred in 2018.
% of Dispatch Service Availability - 2018
| Service | Percentage |
|---|---|
| Telus Ani-Ali Down | 99.91 |
| Rip & Run Printers Down | 99.98 |
| Move up Module Issue | 99.93 |
| Motorola Radio Issue | 99.99 |
| Mobile CAD Issue | 99.95 |
| FDM CAD issue | 99.98 |
| BCAS CAD Interface Down | 99.94 |
| 2018 Total System Downtime (hr:min) | Time |
|---|---|
| Telus Ani-Ali Down | 07:39 |
| Rip & Run Printers Down | 01:34 |
| Move up Module Issue | 05:57 |
| Motorola Radio Issue | 00:55 |
| Mobile CAD Issue | 04:05 |
| FDM CAD Issue | 02:05 |
| BCAS CAD Interface Down | 04:50 |
Dispatch Service and Equipment Upgrades
February
- Port Coquitlam Fire & Emergency Services transitioned to the Motorola P25 Radio System.
April
- Langley City Fire-Rescue Service transitioned to the Motorola P25 Radio System.
May
- Township of Langley Fire Department transitioned to the Motorola P25 Radio System.
- FDM CAD, originally installed in 2003, was upgraded to the latest version (13.1.29). We operate three databases:
- Production CAD (Live) - utilized by our Dispatch Staff for Incident Processing
- Development CAD (Dev) - for testing new processes, CAD logic, upgrades
- Demo CAD - utilized by the Dispatch Staff for training purposes
June
- For additional radio network failover redundancy, a new 100 MB dedicated layer 2 Telus fibre WAN connection has been installed by Telus for direct connection between Surrey Fire and Ecomm. Our back up is a Harris 12 Mb microwave radio.
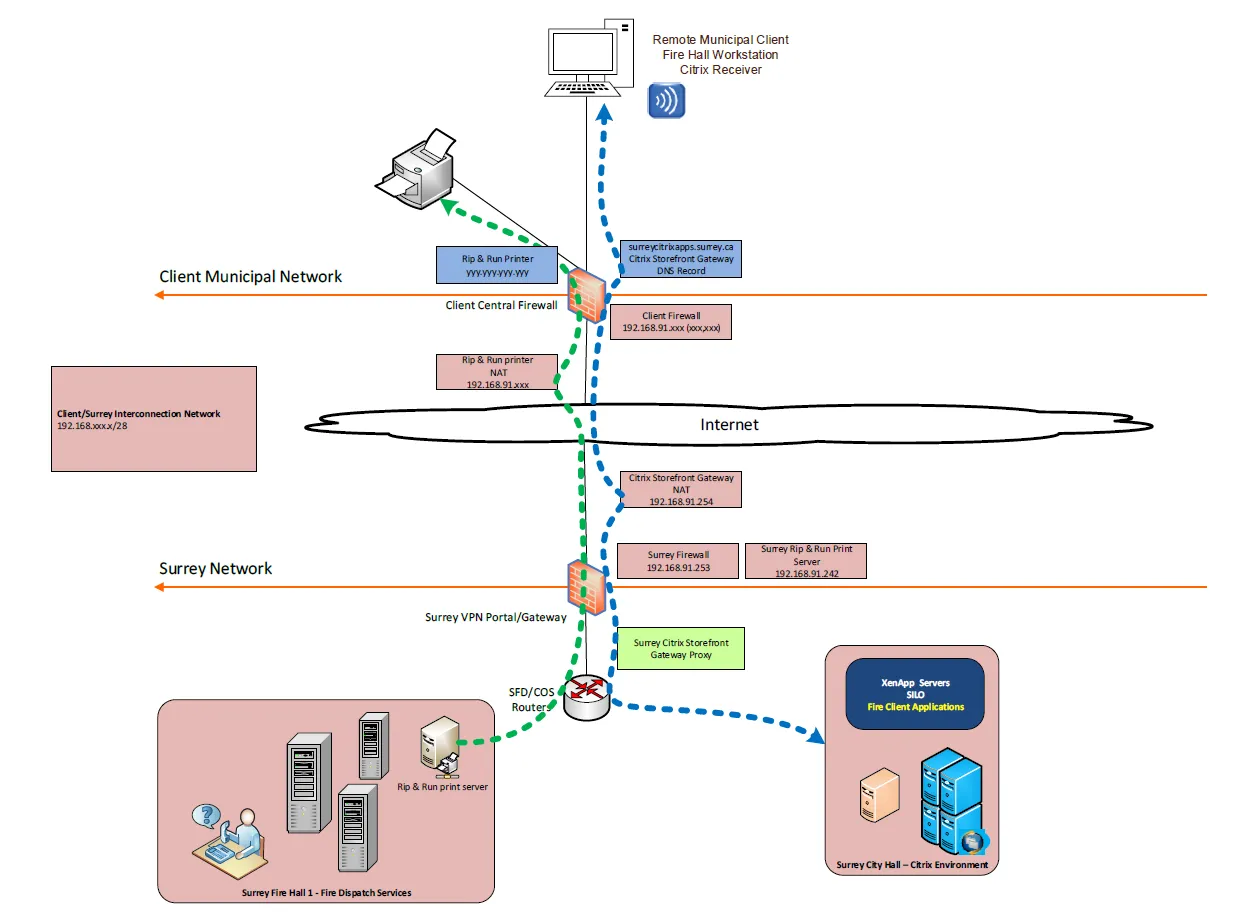
- To eliminate the use of physical Citrix security tokens for the Virtual Private Network (VPN), an alternative method to connect to Surrey applications was explored. A firewall to firewall connection enables users to use a login ID/password to connect the private network. For our clients, this allows the following applications to run seamlessly through the VPN on their network PC’s:
- Rip n Run printers
- Access to FDM RMS
- Access to CAD Active Monitor
- QlikView/QlikSense
- LiveMum 2.0
The new firewall to firewall VPN was implemented for our clients in the Capital Regional District on Vancouver Island.
July
- Telus reconfigured the Avaya Phone Sets to include hot keys to streamline the transfer of 911 callers to Ecomm and other PSAPs and SSAPs in Kamloops and Vancouver Island.
September
After several months of preparation including radio connectivity to the CREST network on Vancouver Island, re-programing phone system, programming of Motorola paging consoles, site visits and training Dispatch staff, we successfully transitioned five (5) new clients from the Capital Regional District (CRD) into our centre (Colwood, Esquimalt, North Saanich, Sidney & View Royal) bringing our total to 39 fire departments, 8 engineering departments and one bylaws representing Metro Vancouver, SLRD, CSRD and CRD.
With the addition of the CRD clients, the staffing model increased to add an eight hour dispatch position (15:00 – 23:00) 7 days a week.
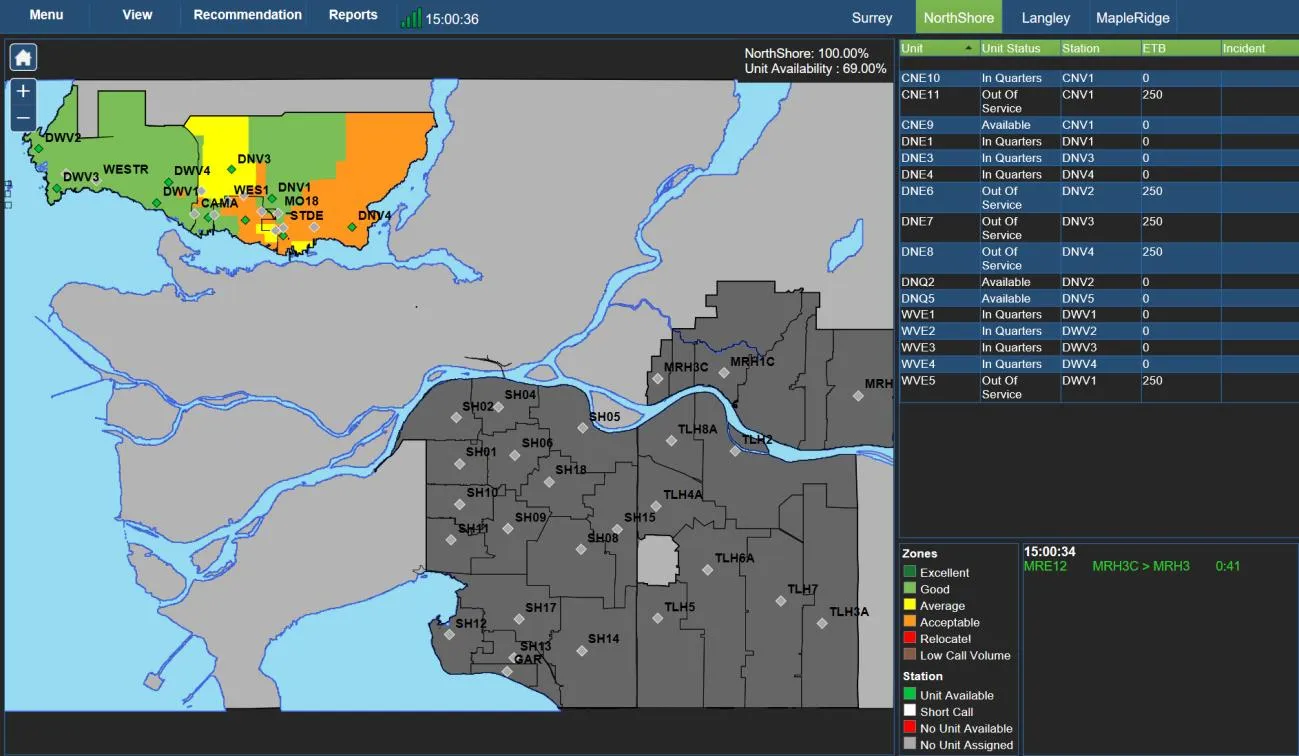
LiveMUM software is provided by Deccan international. It is used for ensuring the City has adequate fire response coverage when an area is depleted of apparatus due to a significant call with numerous apparatus, or several calls in the same area.
On September 18th, Surrey Fire Dispatch moved to LiveMUM software, Version 2. This is a web client based application that will allow for Surrey and our clients using LiveMUM to monitor the recommendations and call volumes in the various areas of their City.
2019 Upcoming Projects and Initiatives
- We will work with our existing clients to configure firewall connections, thus eliminating the use of a physical Citrix token while accessing Surrey applications from their department network computers. Access through personal computers (not on a city network) will still require use of Citrix tokens.
- We will be upgrading QlikView and implementing QlikSense
- We will be upgrading Mobile CAD to MDS
- Fire Active Incident is under development. This online mapping application will display where incidents are located for your department.
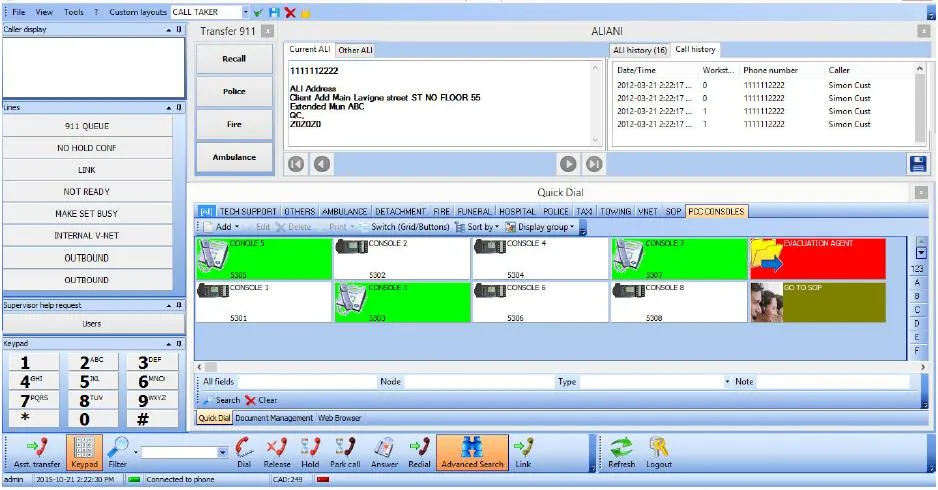
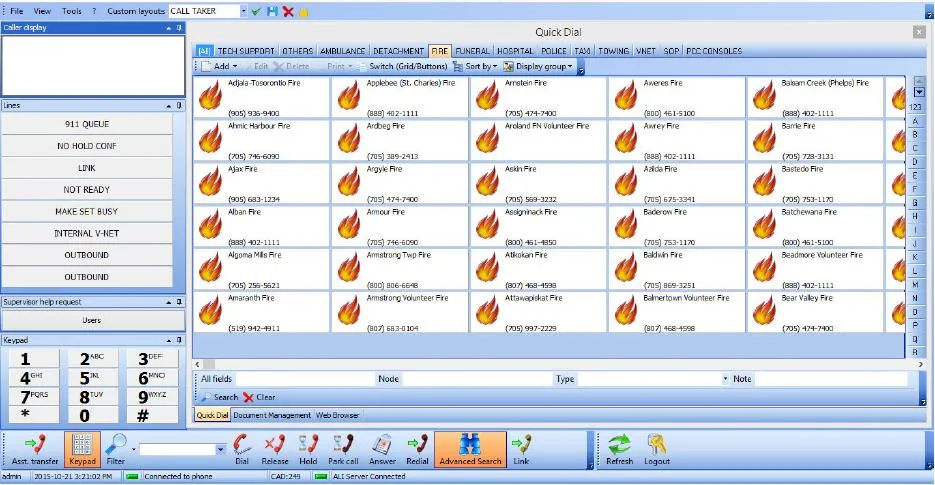
- With Next Gen 9-1-1 on the horizon, we will be transitioning our phone system to one that provides interoperability between CAD, PBX and IP Ali Dmarc. The new softphone system will allow for smooth operational continuity and reliability with the future NG 9-1-1 evolution, and will enable us to be prepared for the first transition of NG 9-1-1 Voice (June 2020).
Example of a softphone application below:
Document Images
(3)