RCMP General Duty Staffing Assessment West Shore 2017
An analysis of General Duty Constable workload to determine resource requirements and performance against targets.
Royal Canadian Mounted Police "E" Division Business Intelligence Program General Duty Staffing Assessment West Shore 2017 Version 0.6 January 2019
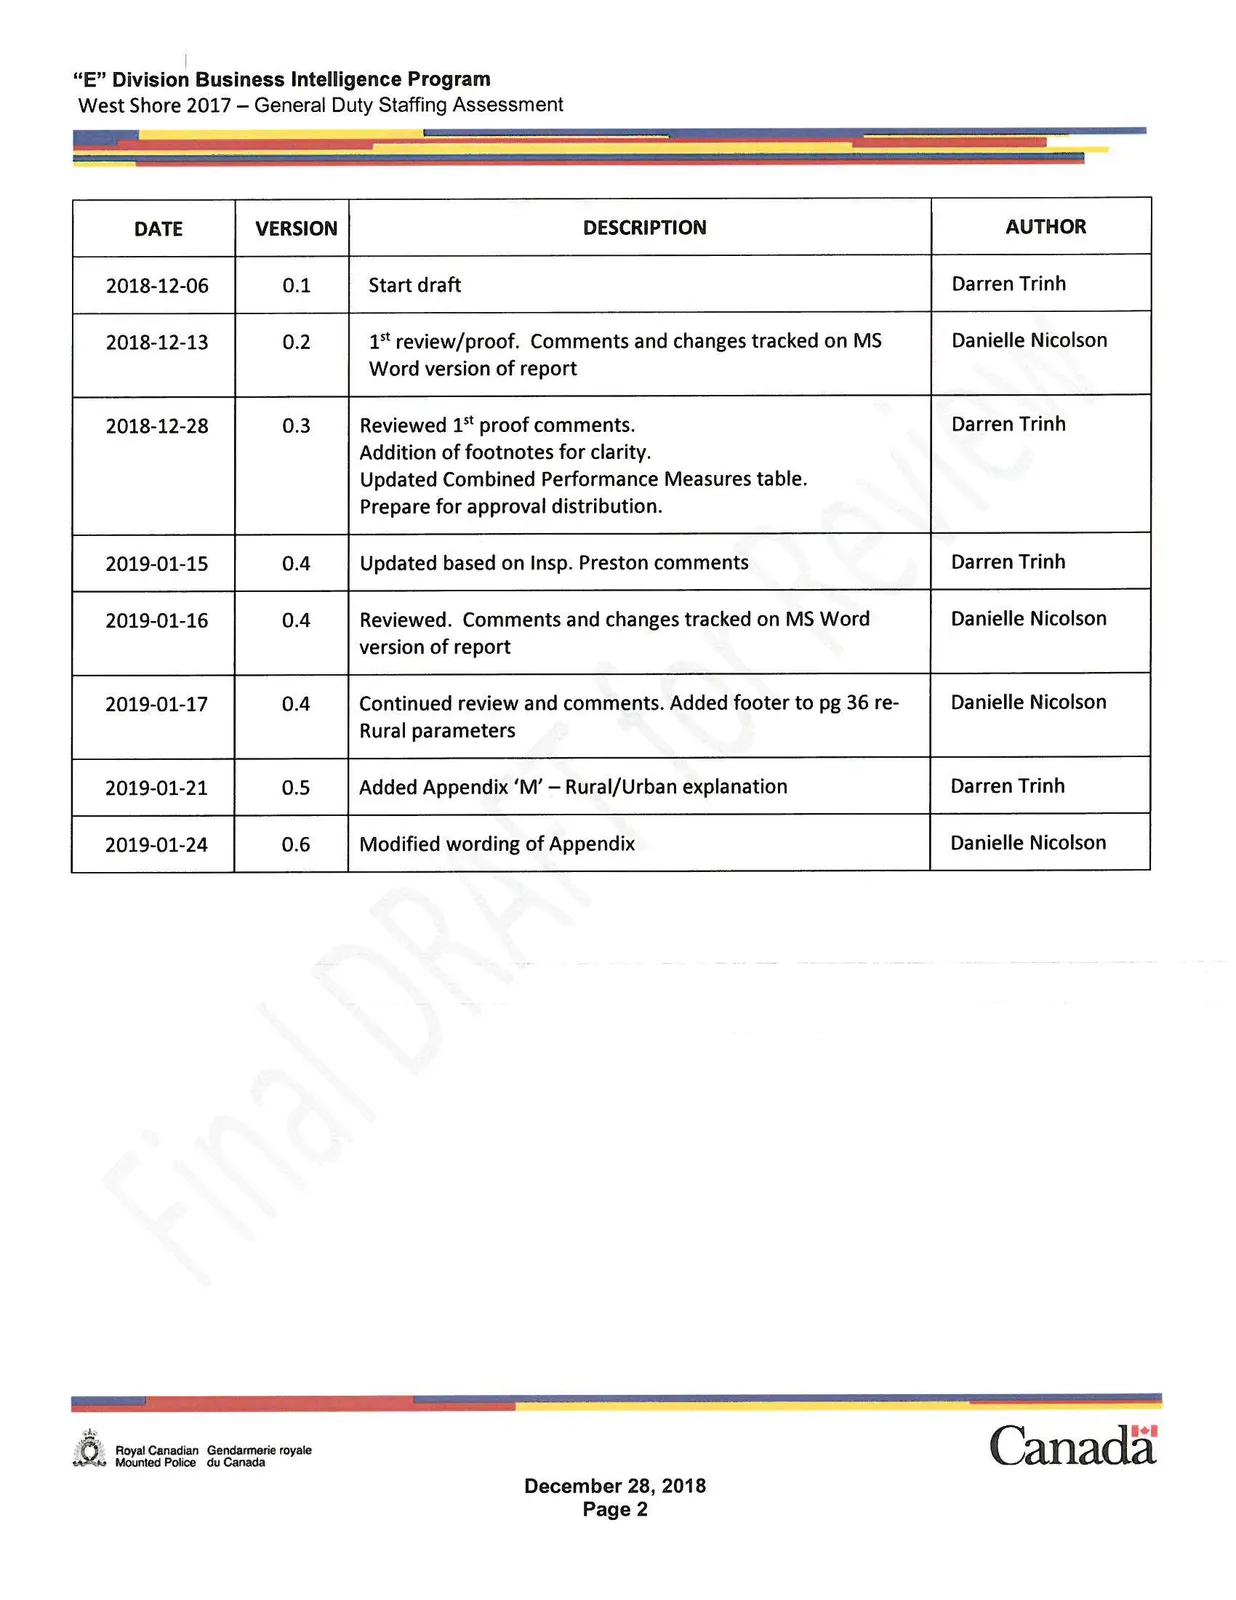
Revision History
| DATE | VERSION | DESCRIPTION | AUTHOR |
|---|---|---|---|
| 2018-12-06 | 0.1 | Start draft | Darren Trinh |
| 2018-12-13 | 0.2 | 1st review/proof. Comments and changes tracked on MS Word version of report | Danielle Nicolson |
| 2018-12-28 | 0.3 | Reviewed 1st proof comments. Addition of footnotes for clarity. Updated Combined Performance Measures table. Prepare for approval distribution. | Darren Trinh |
| 2019-01-15 | 0.4 | Updated based on Insp. Preston comments | Darren Trinh |
| 2019-01-16 | 0.4 | Reviewed. Comments and changes tracked on MS Word version of report | Danielle Nicolson |
| 2019-01-17 | 0.4 | Continued review and comments. Added footer to pg 36 re-Rural parameters | Danielle Nicolson |
| 2019-01-21 | 0.5 | Added Appendix ‘M’ – Rural/Urban explanation | Darren Trinh |
| 2019-01-24 | 0.6 | Modified wording of Appendix | Danielle Nicolson |
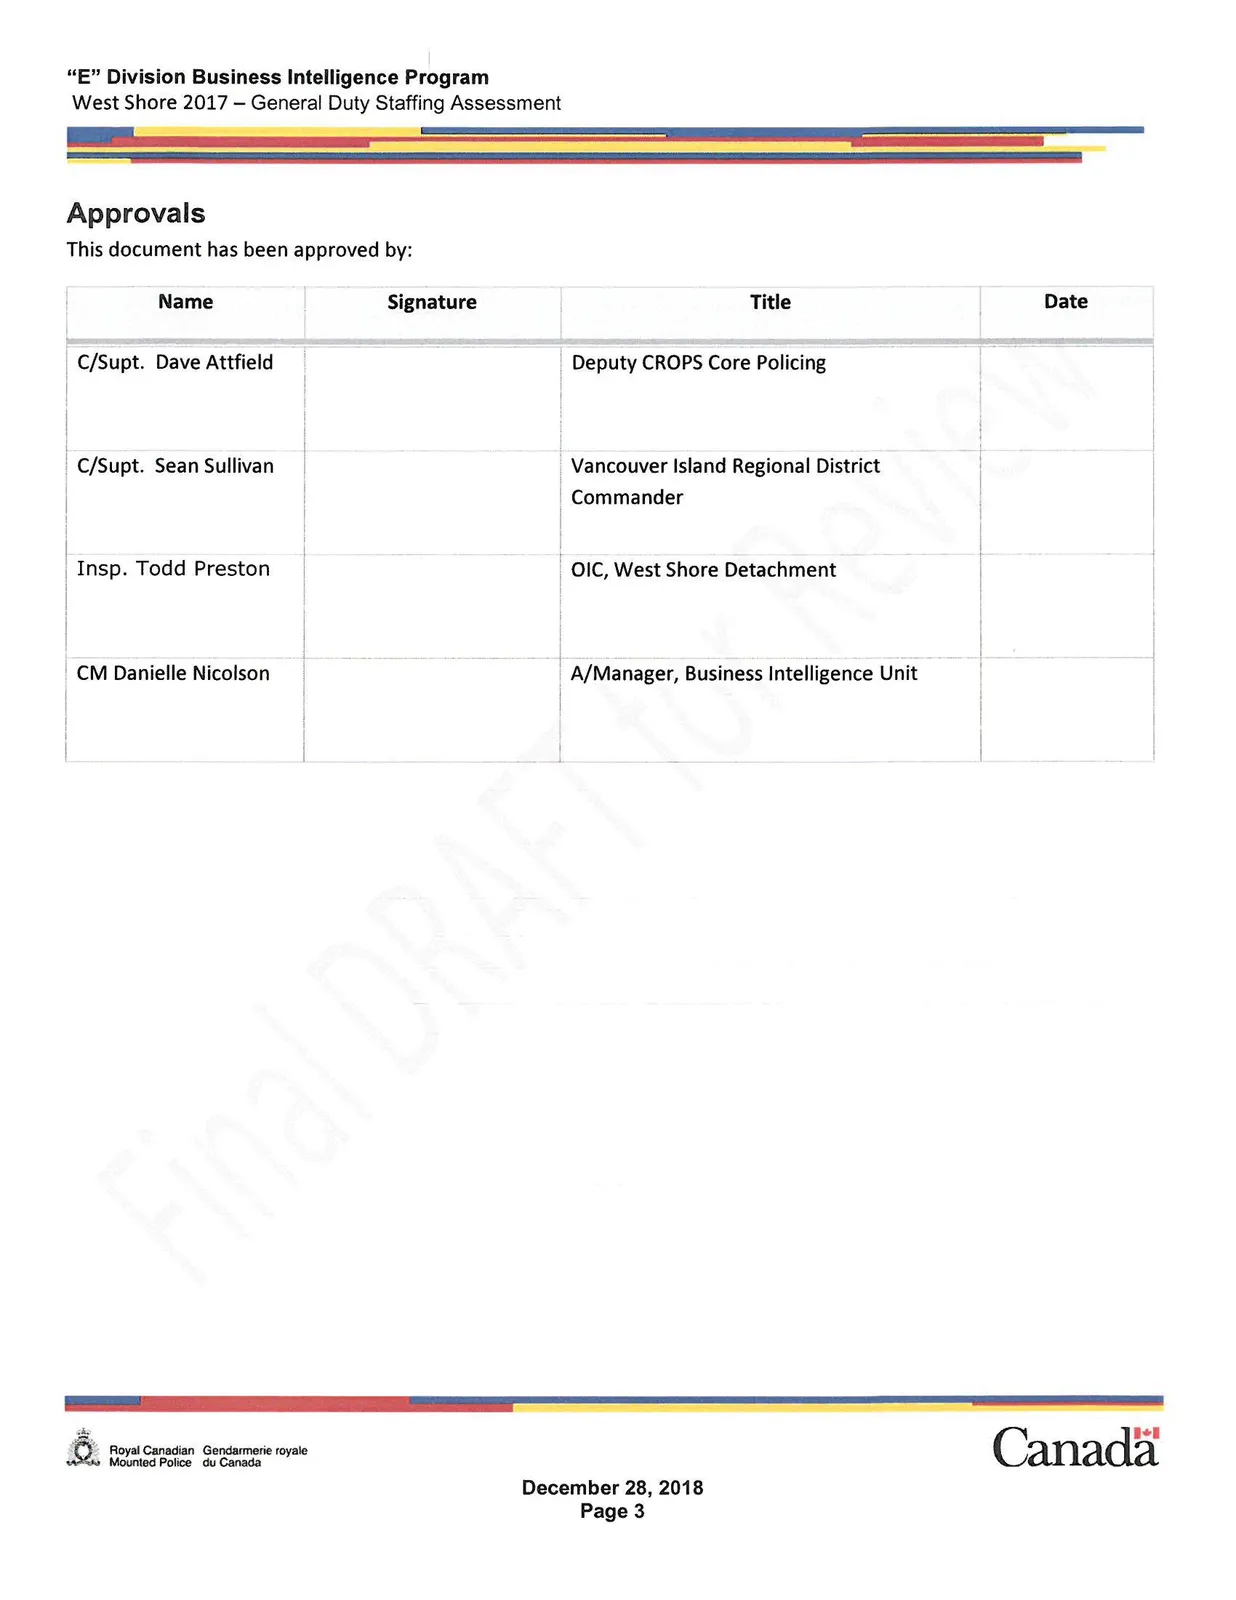
Approvals
This document has been approved by:
| Name | Signature | Title | Date |
|---|---|---|---|
| C/Supt. Dave Attfield | Deputy CROPS Core Policing | ||
| C/Supt. Sean Sullivan | Vancouver Island Regional District Commander | ||
| Insp. Todd Preston | OIC, West Shore Detachment | ||
| CM Danielle Nicolson | A/Manager, Business Intelligence Unit |
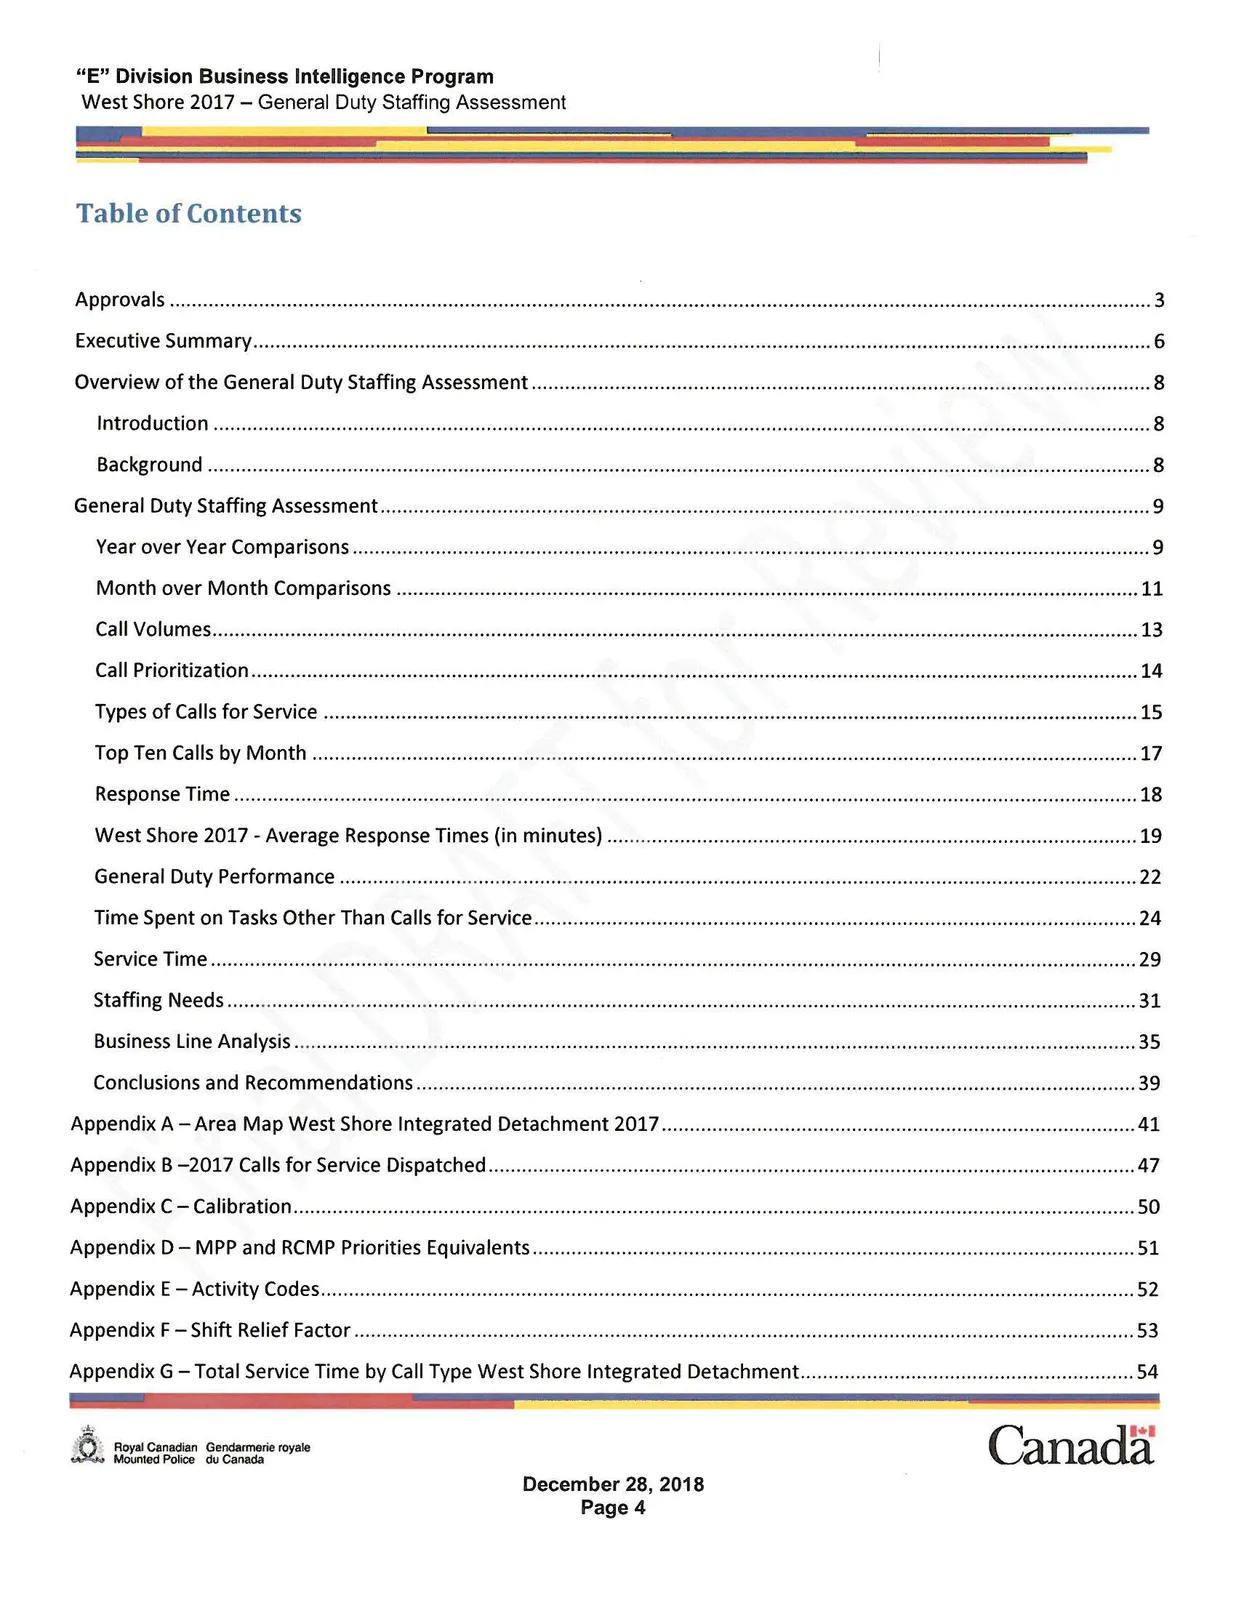
Table of Contents
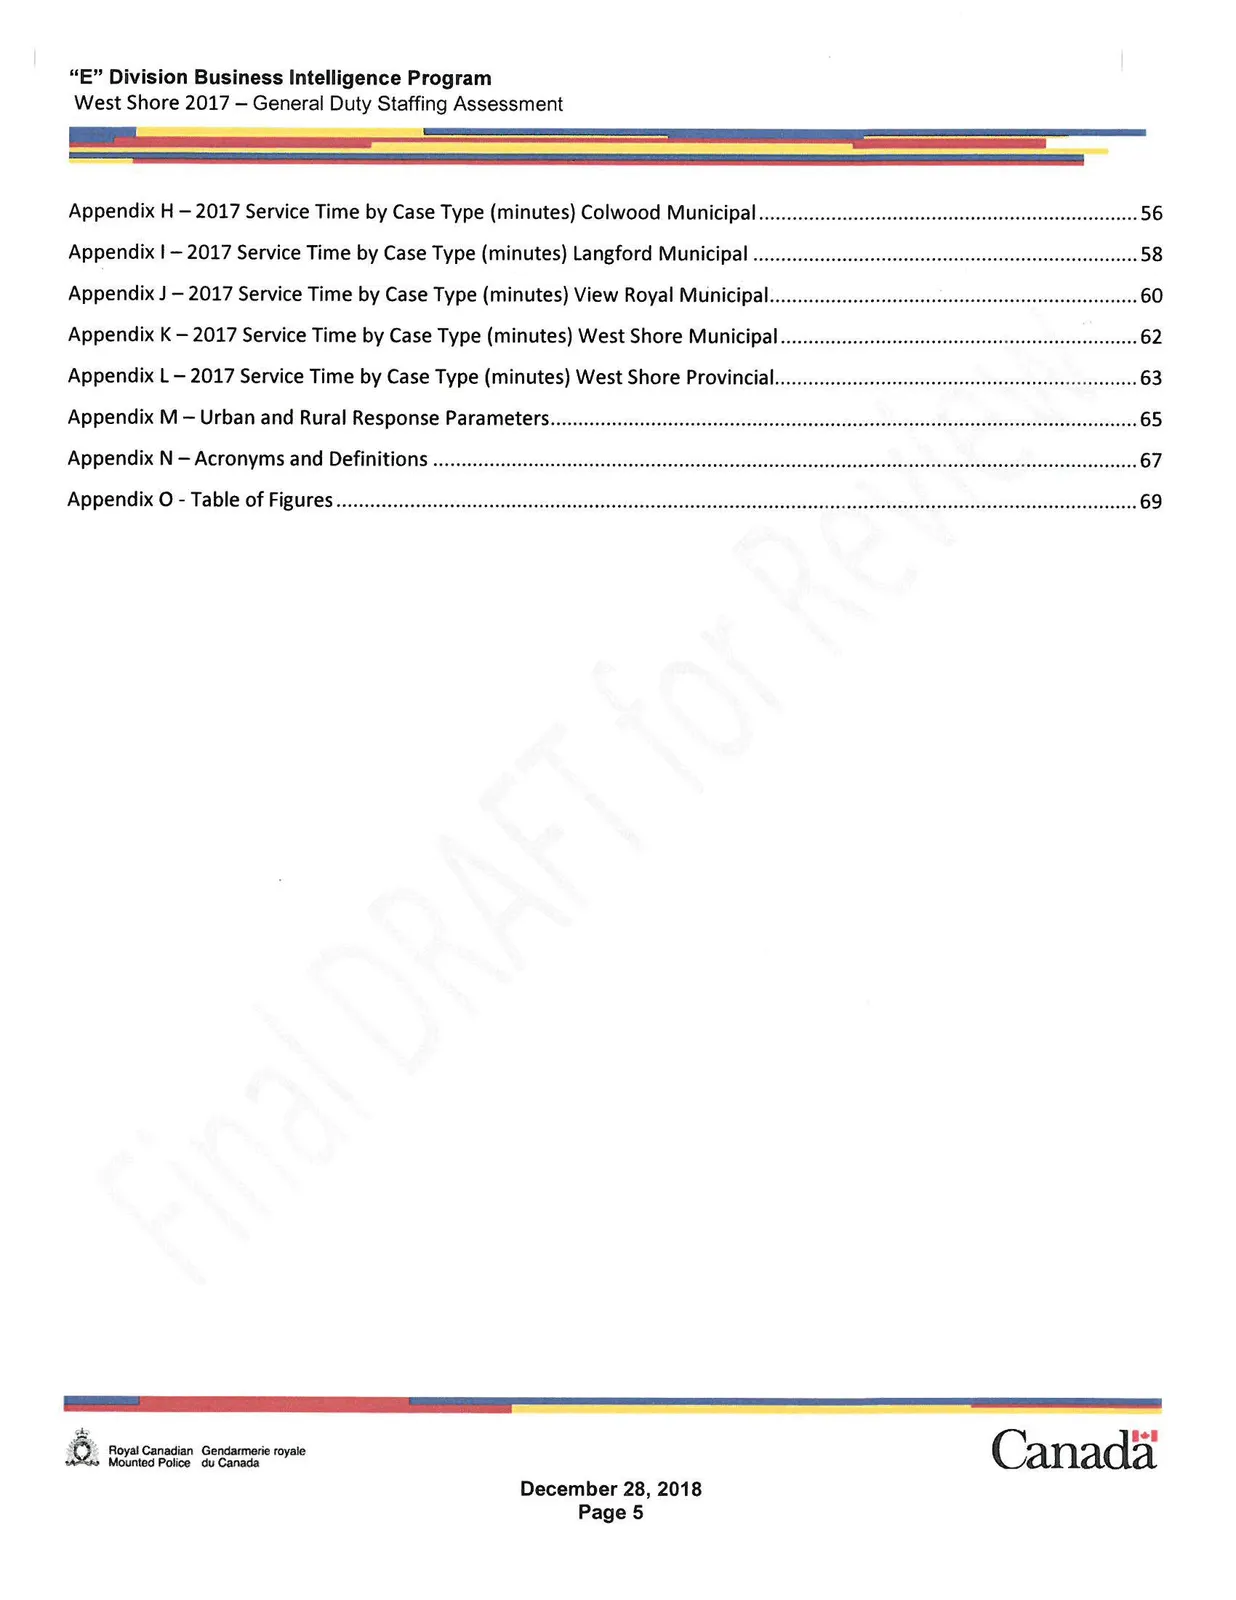
Approvals ..................................................................................................................... 3 Executive Summary........................................................................................................ 6 Overview of the General Duty Staffing Assessment ................................................................ 8 Introduction ............................................................................................................... 8 Background ............................................................................................................... 8 General Duty Staffing Assessment .................................................................................... 9 Year over Year Comparisons ........................................................................................... 9 Month over Month Comparisons ...................................................................................... 11 Call Volumes............................................................................................................. 13 Call Prioritization....................................................................................................... 14 Types of Calls for Service ............................................................................................ 15 Top Ten Calls by Month ............................................................................................... 17 Response Time........................................................................................................... 18 West Shore 2017 - Average Response Times (in minutes) ......................................................... 19 General Duty Performance ............................................................................................ 22 Time Spent on Tasks Other Than Calls for Service ................................................................. 24 Service Time ............................................................................................................ 29 Staffing Needs ........................................................................................................... 31 Business Line Analysis ................................................................................................. 35 Conclusions and Recommendations ................................................................................... 39 Appendix A – Area Map West Shore Integrated Detachment 2017 ................................................ 41 Appendix B – 2017 Calls for Service Dispatched ................................................................... 47 Appendix C – Calibration ............................................................................................... 50 Appendix D – MPP and RCMP Priorities Equivalents ................................................................ 51 Appendix E – Activity Codes ........................................................................................... 52 Appendix F – Shift Relief Factor ....................................................................................... 53 Appendix G – Total Service Time by Call Type West Shore Integrated Detachment .............................. 54 Appendix H – 2017 Service Time by Case Type (minutes) Colwood Municipal ................................... 56 Appendix I - 2017 Service Time by Case Type (minutes) Langford Municipal ...................................... 58 Appendix J - 2017 Service Time by Case Type (minutes) View Royal Municipal ................................... 60 Appendix K – 2017 Service Time by Case Type (minutes) West Shore Municipal .................................. 62 Appendix L – 2017 Service Time by Case Type (minutes) West Shore Provincial .................................. 63 Appendix M – Urban and Rural Response Parameters .............................................................. 65 Appendix N – Acronyms and Definitions ............................................................................. 67 Appendix O – Table of Figures ........................................................................................ 69
Executive Summary
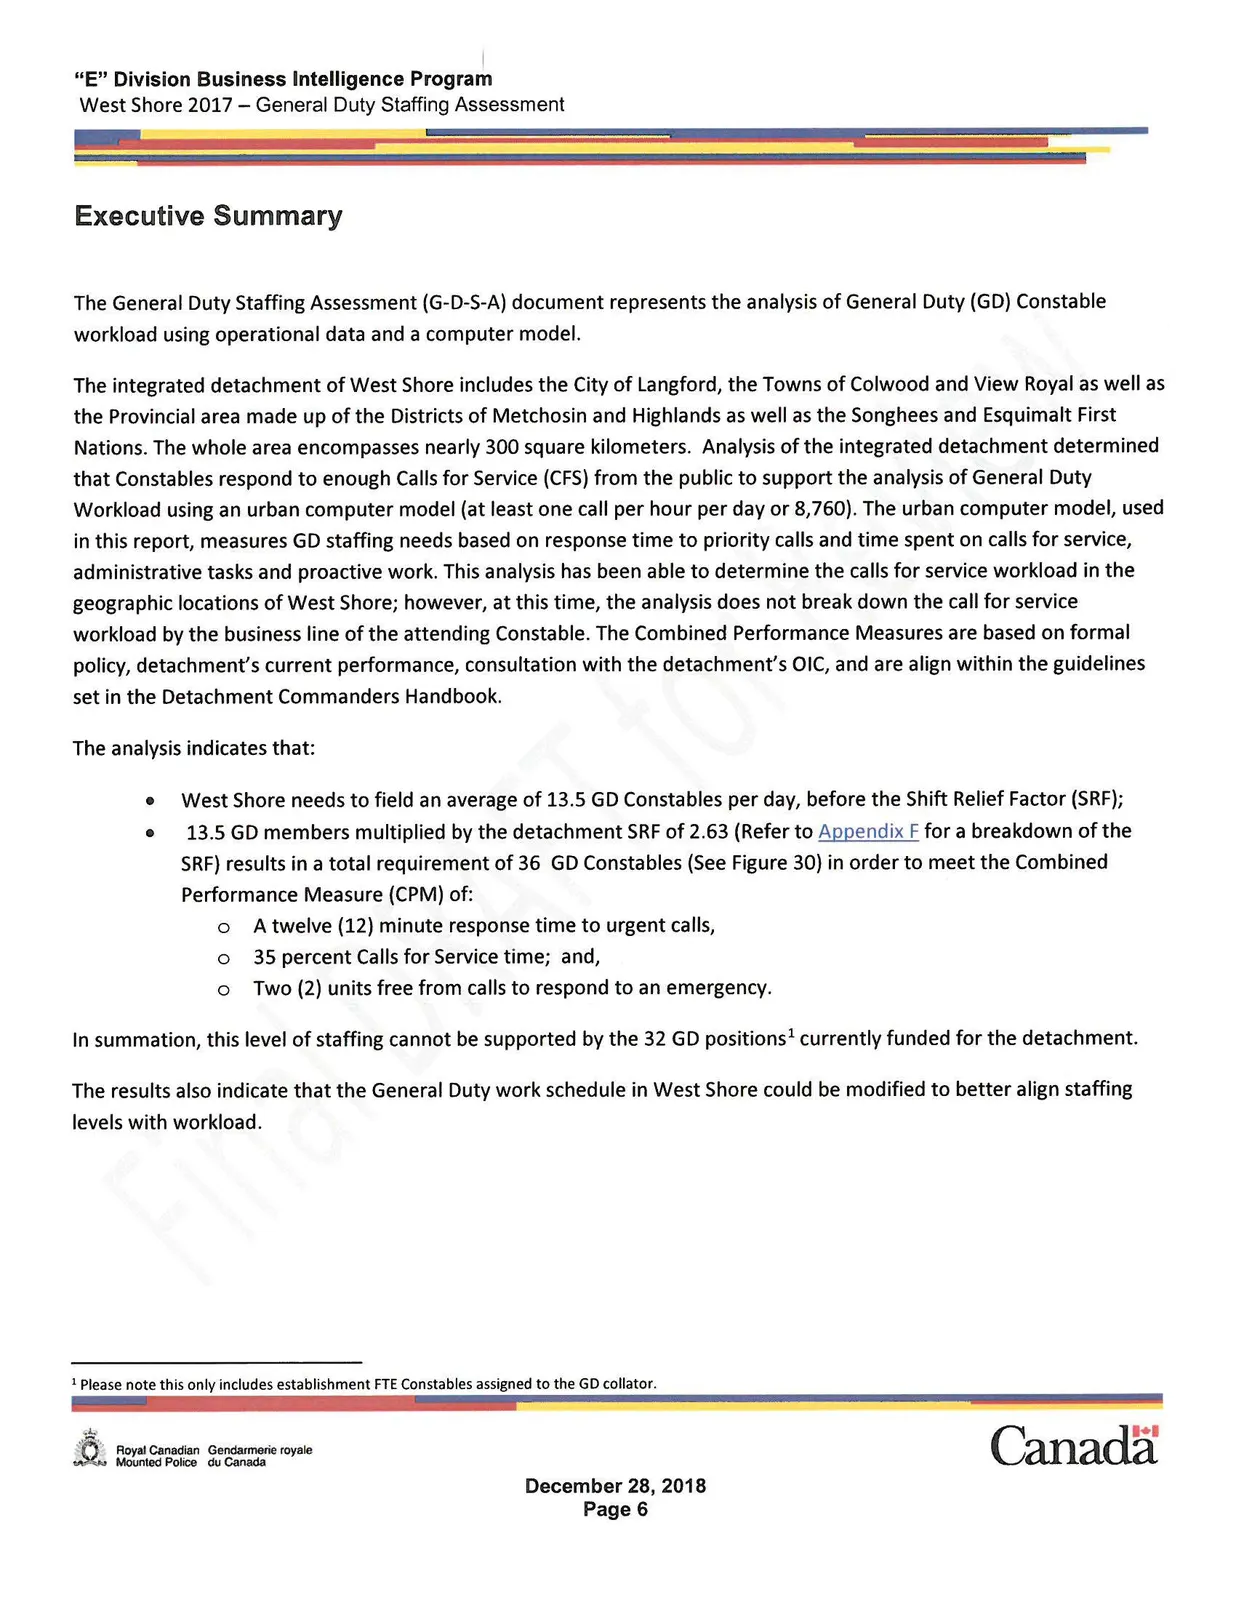
The General Duty Staffing Assessment (G-D-S-A) document represents the analysis of General Duty (GD) Constable workload using operational data and a computer model.
The integrated detachment of West Shore includes the City of Langford, the Towns of Colwood and View Royal as well as the Provincial area made up of the Districts of Metchosin and Highlands as well as the Songhees and Esquimalt First Nations. The whole area encompasses nearly 300 square kilometers. Analysis of the integrated detachment determined that Constables respond to enough Calls for Service (CFS) from the public to support the analysis of General Duty Workload using an urban computer model (at least one call per hour per day or 8,760). The urban computer model, used in this report, measures GD staffing needs based on response time to priority calls and time spent on calls for service, administrative tasks and proactive work. This analysis has been able to determine the calls for service workload in the geographic locations of West Shore; however, at this time, the analysis does not break down the call for service workload by the business line of the attending Constable. The Combined Performance Measures are based on formal policy, detachment’s current performance, consultation with the detachment’s OIC, and are align within the guidelines set in the Detachment Commanders Handbook.
The analysis indicates that:
- West Shore needs to field an average of 13.5 GD Constables per day, before the Shift Relief Factor (SRF);
- 13.5 GD members multiplied by the detachment SRF of 2.63 (Refer to Appendix F for a breakdown of the SRF) results in a total requirement of 36 GD Constables (See Figure 30) in order to meet the Combined Performance Measure (CPM) of:
- A twelve (12) minute response time to urgent calls,
- 35 percent Calls for Service time; and,
- Two (2) units free from calls to respond to an emergency.
In summation, this level of staffing cannot be supported by the 32 GD positions¹ currently funded for the detachment.
The results also indicate that the General Duty work schedule in West Shore could be modified to better align staffing levels with workload.
¹ Please note this only includes establishment FTE Constables assigned to the GD collator.
Figure 1 - Distribution of CFS and Service Time and Proposed Cost Sharing across Business Lines
| Business Line | Total Calls Dispatched² | Percentage of Total Calls Dispatched | Total Service Time (minutes) | Percentage of Total Service Time | Total Calls and Service Time Percentages | Established FTEs | Proposed FTEs Cost Sharing |
|---|---|---|---|---|---|---|---|
| Colwood - Municipal | 2636 | 17.38 | 159,018 | 17.04 | 17.21 | 9 (28.13%) | 6 (16.67%) |
| Langford - Municipal | 7622 | 50.27 | 454,588 | 48.73 | 49.50 | 13 (40.63%) | 18 (50%) |
| View Royal - Municipal | 2107 | 13.90 | 138,712 | 14.87 | 14.38 | 6 (18.75%) | 5 (13.89%) |
| West Shore - Municipal | 73 | 0.48 | 4,117 | 0.44 | 0.46 | 0 | 0 |
| West Shore - Provincial | 2707 | 17.85 | 175,347 | 18.79 | 18.32 | 4 (12.5%) | 7 (19.44%) |
| West Shore - Unknown | 18 | 0.12 | 1165.00 | 0.12 | 0.12 | 0 | 0 |
| Totals | 15163 | 100.00 | 932,947 | 100.00 | 100.00 | 32 | 36 |
The GDSA does not include the number of Criminal Case (CC) files carried by GD Constables. Further analysis of the origin (business line), number and type of CC files carried by the GD Constables in West Shore may be considered.
In the course of this analysis it was determined that GD Constables in West Shore spend time on tasks that may not be recorded in PRIME CAD, and therefore not considered in this analysis, for example: National Sex Offender Registry (NSOR) entries and updates, the collection of DNA samples; Real time Identification (RTID) electronic fingerprint entries; and, tasks related to the confinement of persons under the authority of the BC Sherriff Service. It is recommended that the detachment consider the use of the SPAT (Special Attention/Detail/Event) Call Type to capture the time spent performing the above noted activities.
In addition, the detachment may consider the deployment of watch clerks (municipal employees) that could assist in the triage and management of tasks currently not captured in the CAD. The watch clerk (s) may carry out or divert those tasks that do not require the attendance of a GD Constable.
² Total Calls Dispatched displayed are for GD Constable only.
Overview of the General Duty Staffing Assessment
Introduction
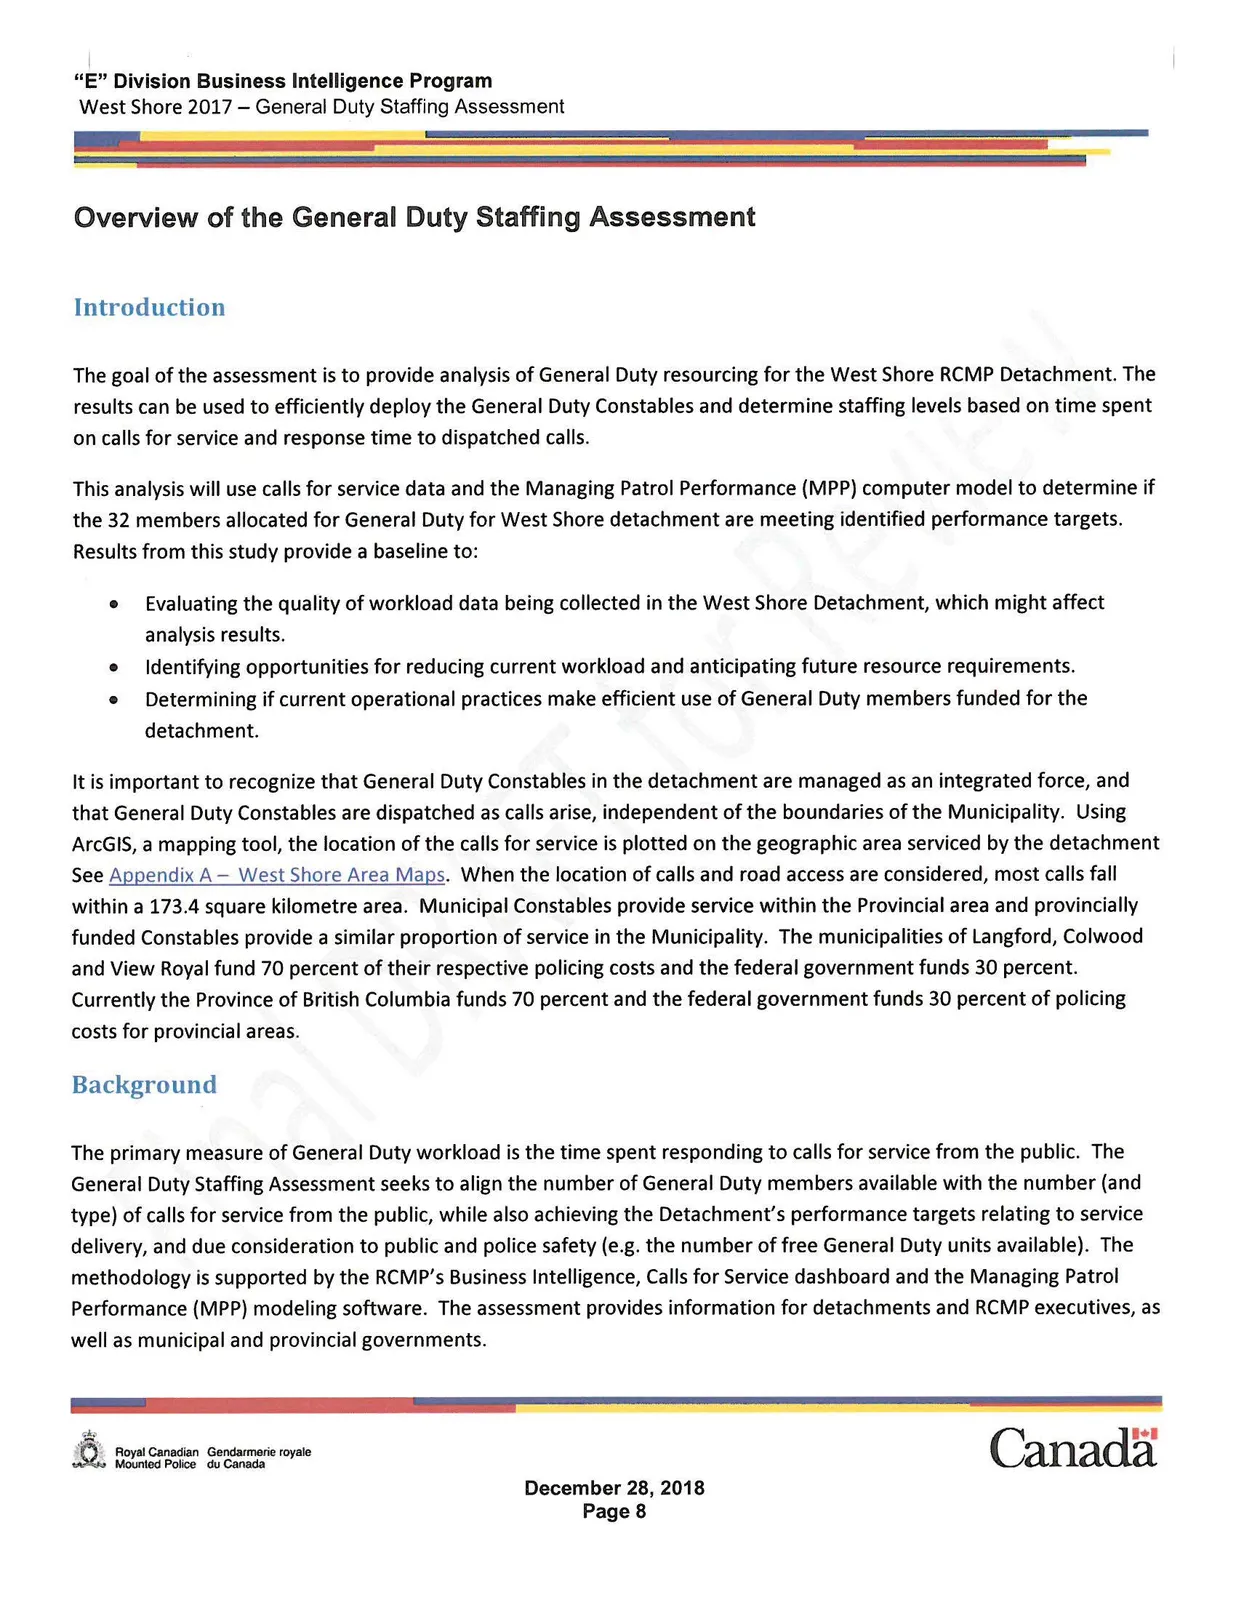
The goal of the assessment is to provide analysis of General Duty resourcing for the West Shore RCMP Detachment. The results can be used to efficiently deploy the General Duty Constables and determine staffing levels based on time spent on calls for service and response time to dispatched calls.
This analysis will use calls for service data and the Managing Patrol Performance (MPP) computer model to determine if the 32 members allocated for General Duty for West Shore detachment are meeting identified performance targets. Results from this study provide a baseline to:
- Evaluating the quality of workload data being collected in the West Shore Detachment, which might affect analysis results.
- Identifying opportunities for reducing current workload and anticipating future resource requirements.
- Determining if current operational practices make efficient use of General Duty members funded for the detachment.
It is important to recognize that General Duty Constables in the detachment are managed as an integrated force, and that General Duty Constables are dispatched as calls arise, independent of the boundaries of the Municipality. Using ArcGIS, a mapping tool, the location of the calls for service is plotted on the geographic area serviced by the detachment See Appendix A – West Shore Area Maps. When the location of calls and road access are considered, most calls fall within a 173.4 square kilometre area. Municipal Constables provide service within the Provincial area and provincially funded Constables provide a similar proportion of service in the Municipality. The municipalities of Langford, Colwood and View Royal fund 70 percent of their respective policing costs and the federal government funds 30 percent. Currently the Province of British Columbia funds 70 percent and the federal government funds 30 percent of policing costs for provincial areas.
Background
The primary measure of General Duty workload is the time spent responding to calls for service from the public. The General Duty Staffing Assessment seeks to align the number of General Duty members available with the number (and type) of calls for service from the public, while also achieving the Detachment’s performance targets relating to service delivery, and due consideration to public and police safety (e.g. the number of free General Duty units available). The methodology is supported by the RCMP’s Business Intelligence, Calls for Service dashboard and the Managing Patrol Performance (MPP) modeling software. The assessment provides information for detachments and RCMP executives, as well as municipal and provincial governments.
General Duty Staffing Assessment
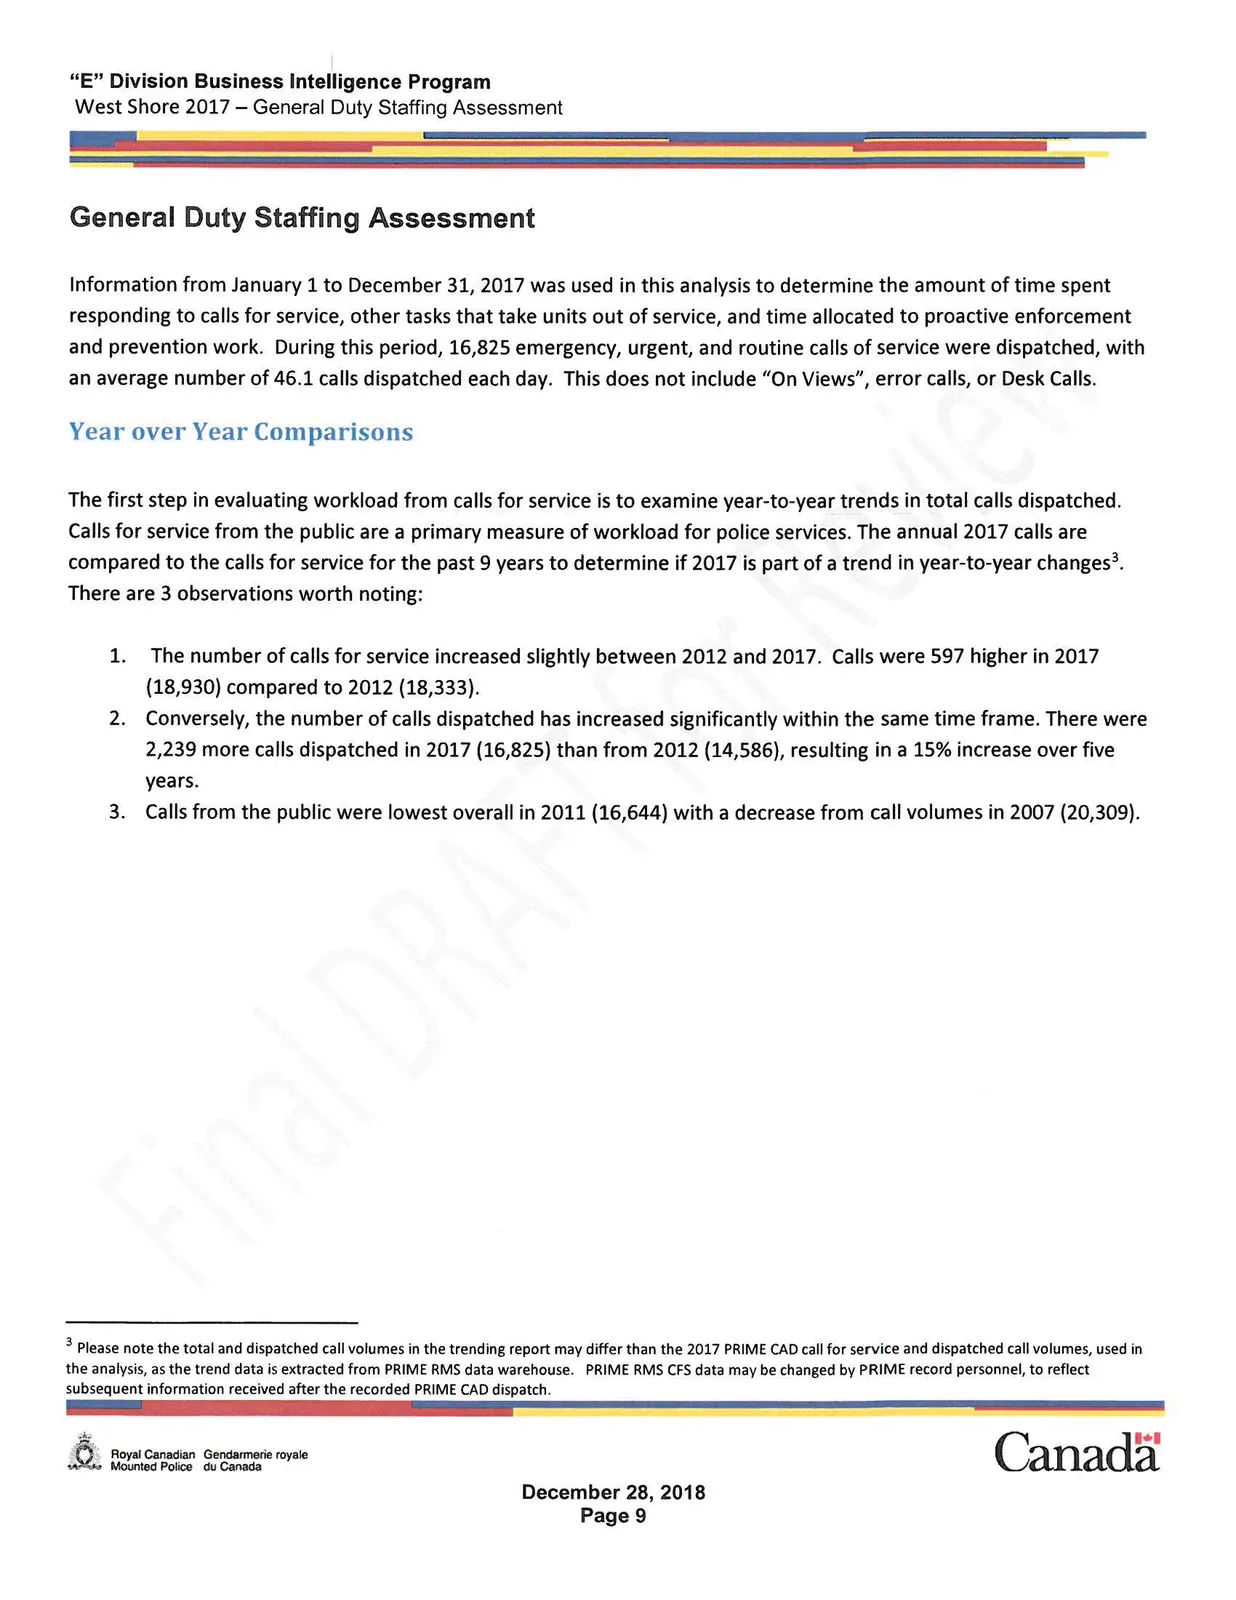
Information from January 1 to December 31, 2017 was used in this analysis to determine the amount of time spent responding to calls for service, other tasks that take units out of service, and time allocated to proactive enforcement and prevention work. During this period, 16,825 emergency, urgent, and routine calls of service were dispatched, with an average number of 46.1 calls dispatched each day. This does not include "On Views", error calls, or Desk Calls.
Year over Year Comparisons
The first step in evaluating workload from calls for service is to examine year-to-year trends in total calls dispatched. Calls for service from the public are a primary measure of workload for police services. The annual 2017 calls are compared to the calls for service for the past 9 years to determine if 2017 is part of a trend in year-to-year changes³. There are 3 observations worth noting:
- The number of calls for service increased slightly between 2012 and 2017. Calls were 597 higher in 2017 (18,930) compared to 2012 (18,333).
- Conversely, the number of calls dispatched has increased significantly within the same time frame. There were 2,239 more calls dispatched in 2017 (16,825) than from 2012 (14,586), resulting in a 15% increase over five years.
- Calls from the public were lowest overall in 2011 (16,644) with a decrease from call volumes in 2007 (20,309).
³ Please note the total and dispatched call volumes in the trending report may differ than the 2017 PRIME CAD call for service and dispatched call volumes, used in the analysis, as the trend data is extracted from PRIME RMS data warehouse. PRIME RMS CFS data may be changed by PRIME record personnel, to reflect subsequent information received after the recorded PRIME CAD dispatch.
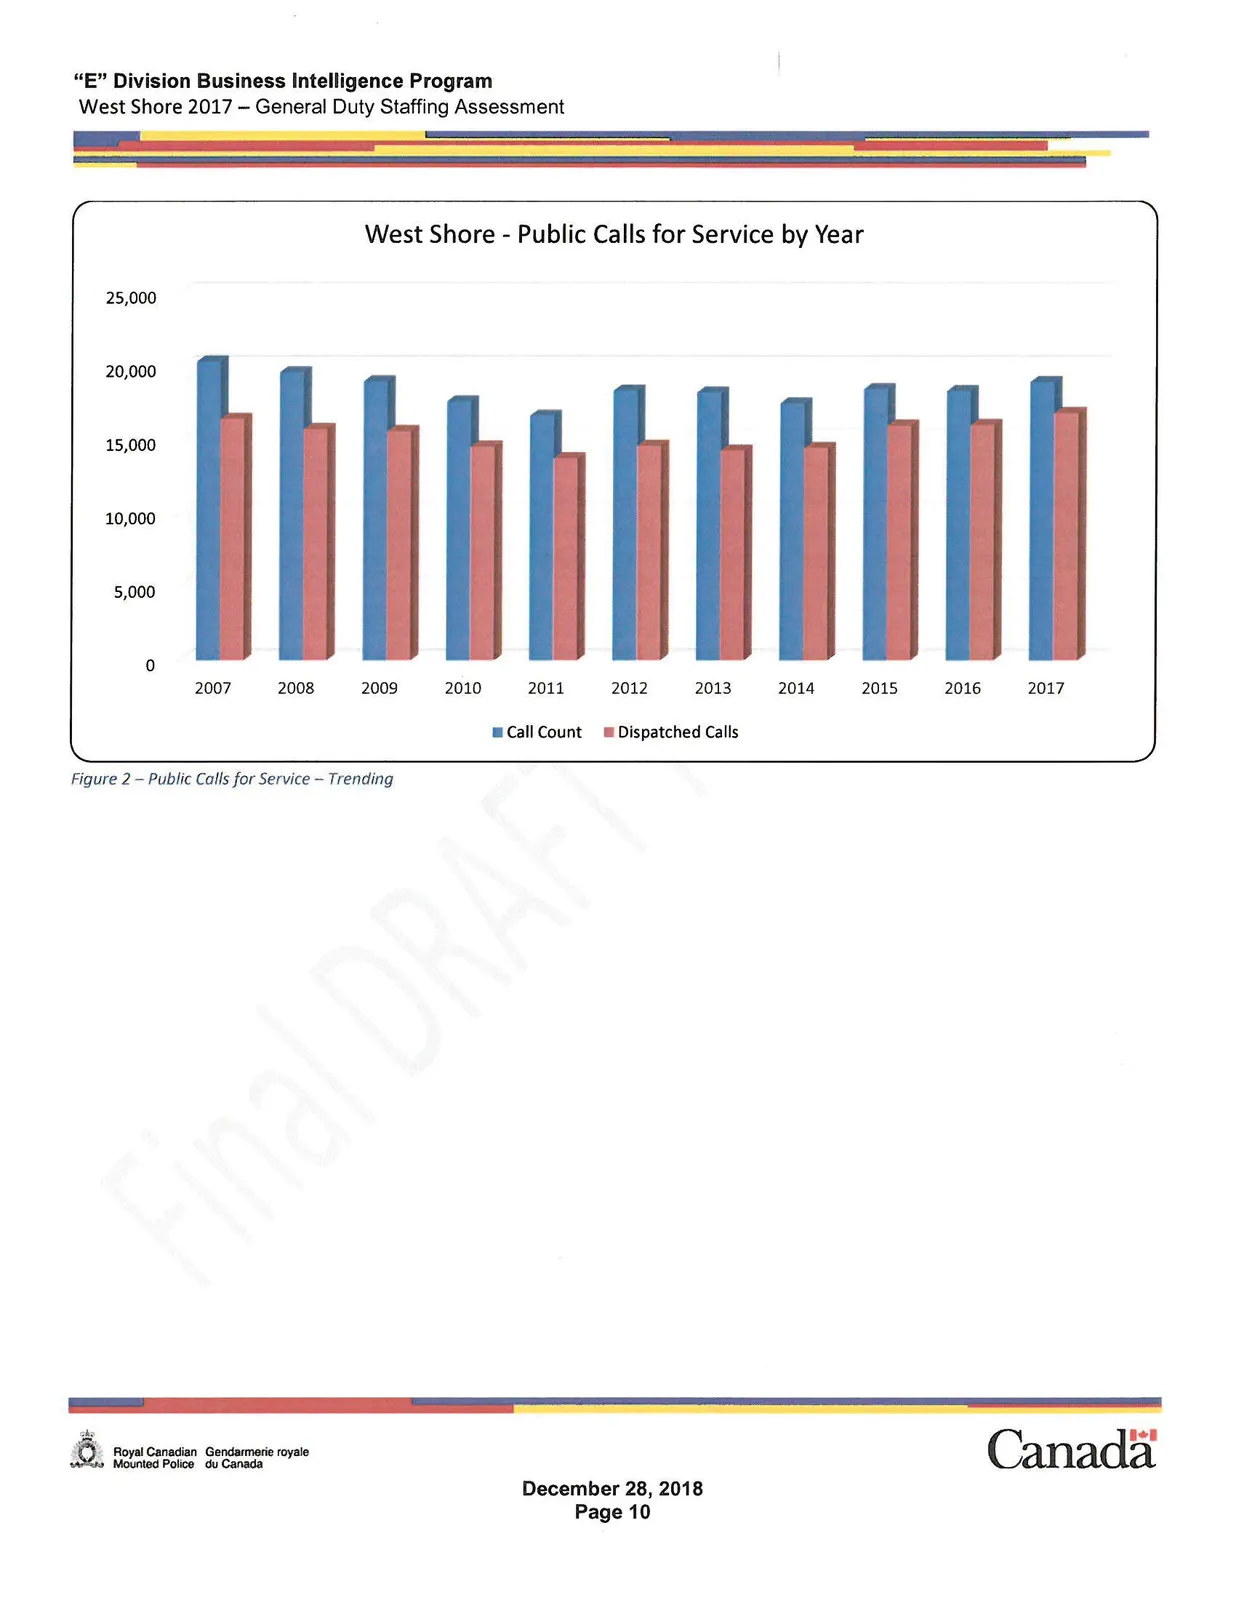
Figure 2 – Public Calls for Service – Trending
Month over Month Comparisons
The following graph shows that in the past five years call dispatched steadily increased from April and peak in July and August, then taper off in September. There is a noticeable increase in the volume of calls in latter months July to December compared to the previous years.
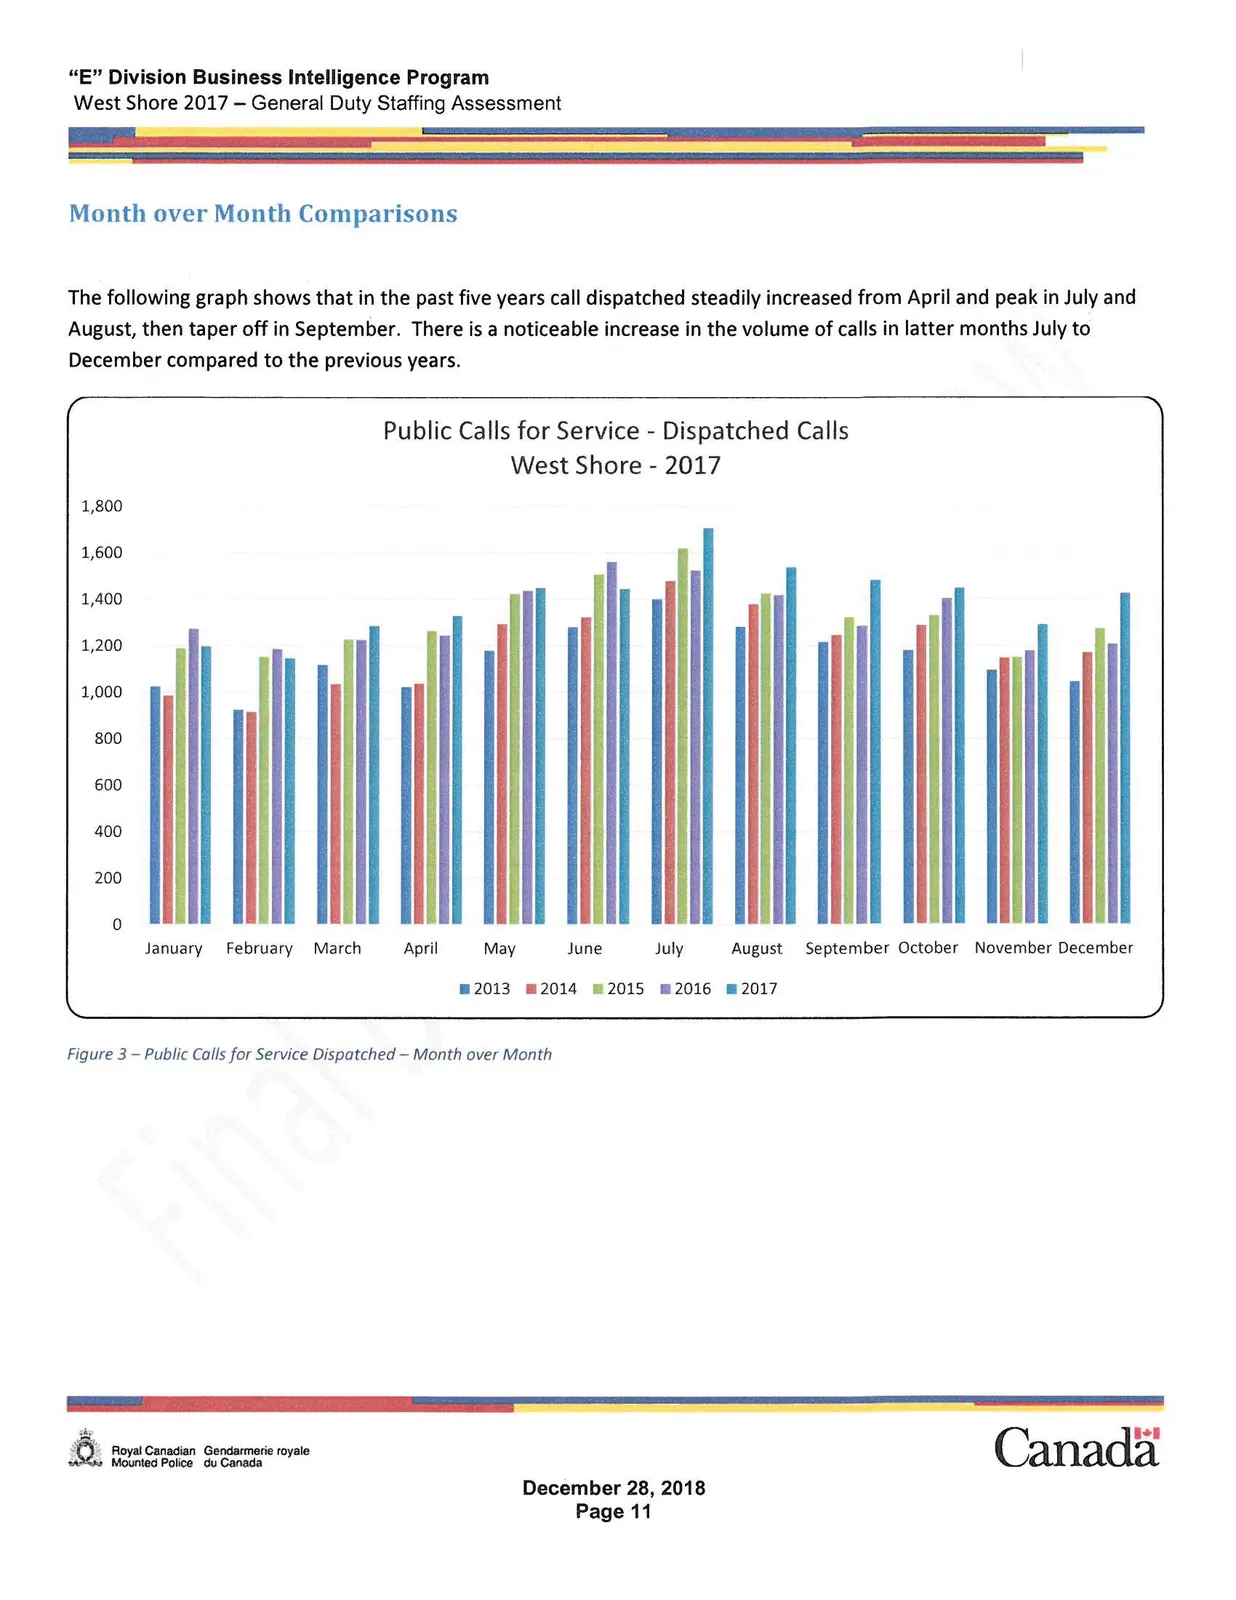
Figure 3 – Public Calls for Service Dispatched – Month over Month
The next graph reveals that the number of public calls for service is lowest during 0300-0559 time block and highest during 1500-1759 time block.
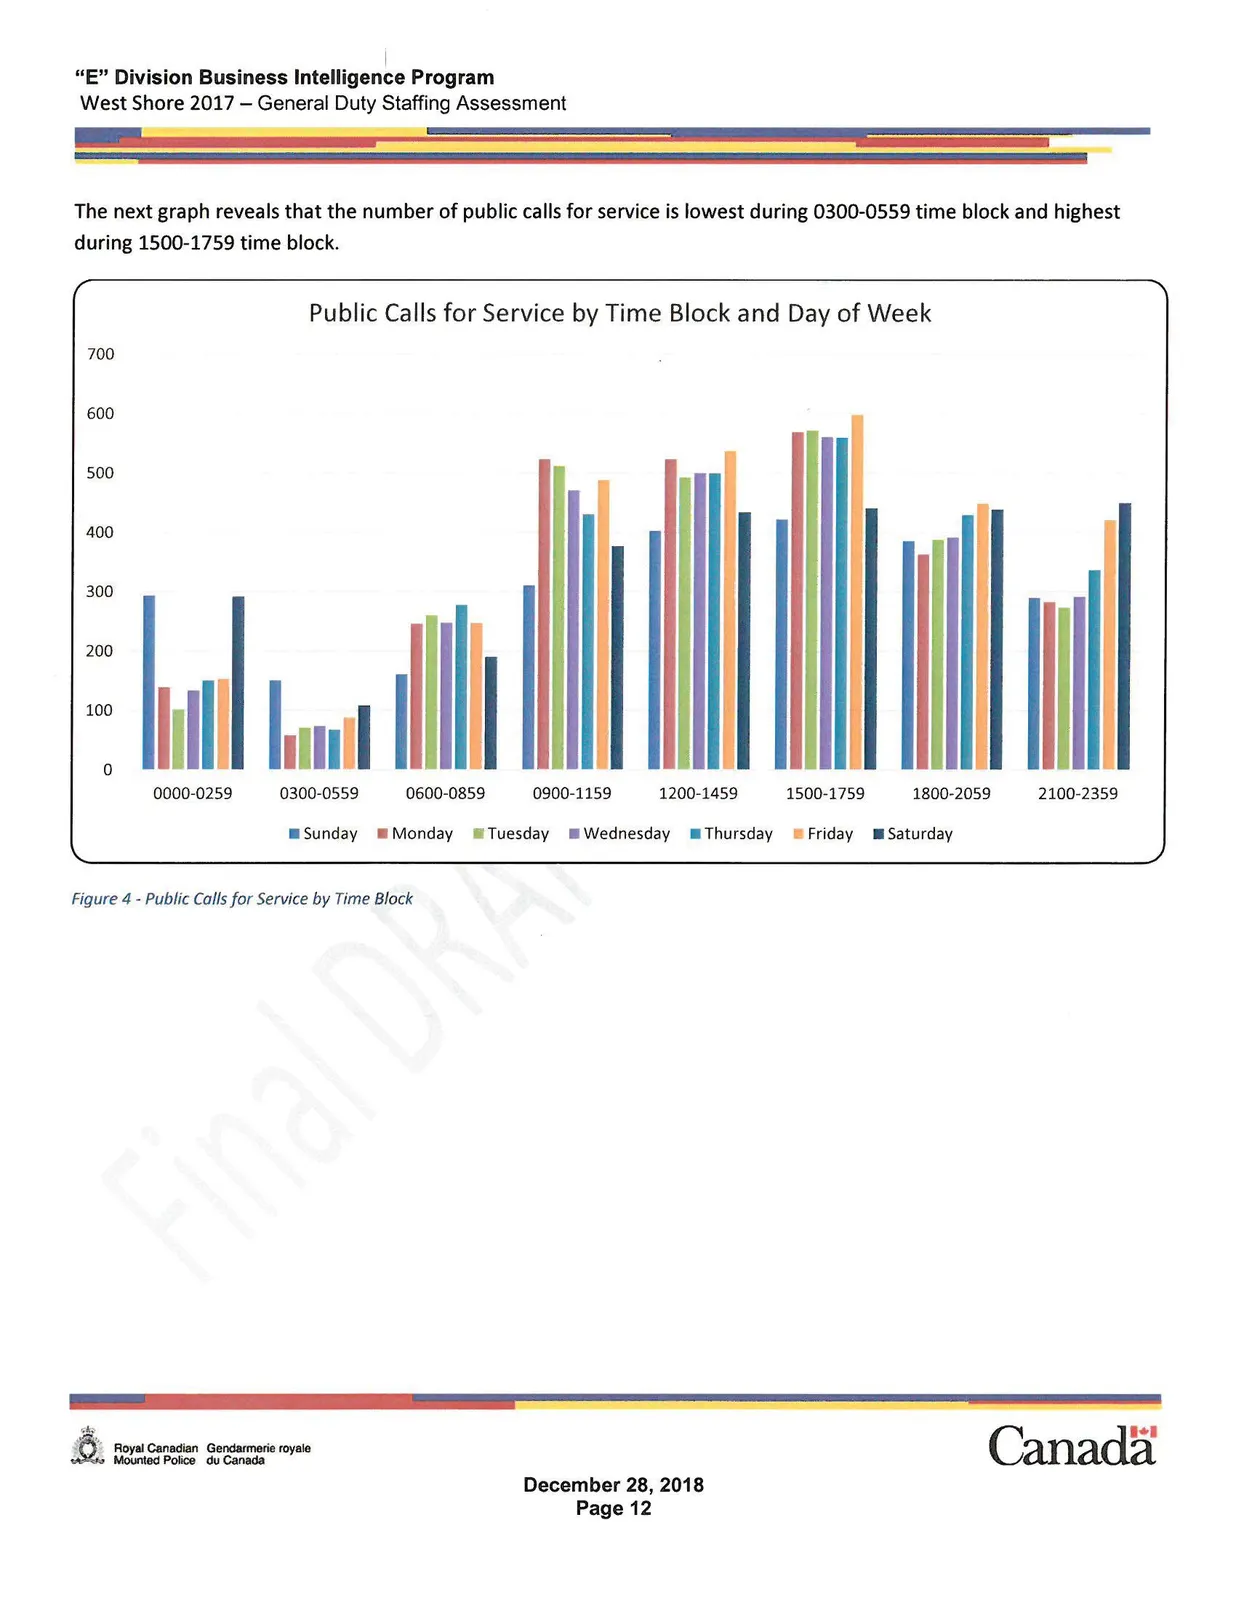
Figure 4 - Public Calls for Service by Time Block
Call Volumes
The number of calls received by hour-of-day and day-of-week is analyzed to determine the workload and create an optimal schedule. The following graph indicates three observations worth noting:
- Call volumes steadily increase from 0500-0600 and peak on most days at 1600-1700.
- Friday and Saturday evenings displays a second peak of calls around midnight. In addition, the weekend between midnight and 0500 displays the largest difference between call volumes. Saturday and Sunday early morning experience almost .5 more calls per hour than compared to the weekday equivalent.
- Call volumes tends to decrease around 1800-1900 every day of the week. On weekends, the least number of dispatched calls occurs at 0500-0600. The number of calls dispatched does not account for the severity of the call and the amount of time it takes for the Constables to respond. These factors are taken into account in the Response Time and Service Time sections.
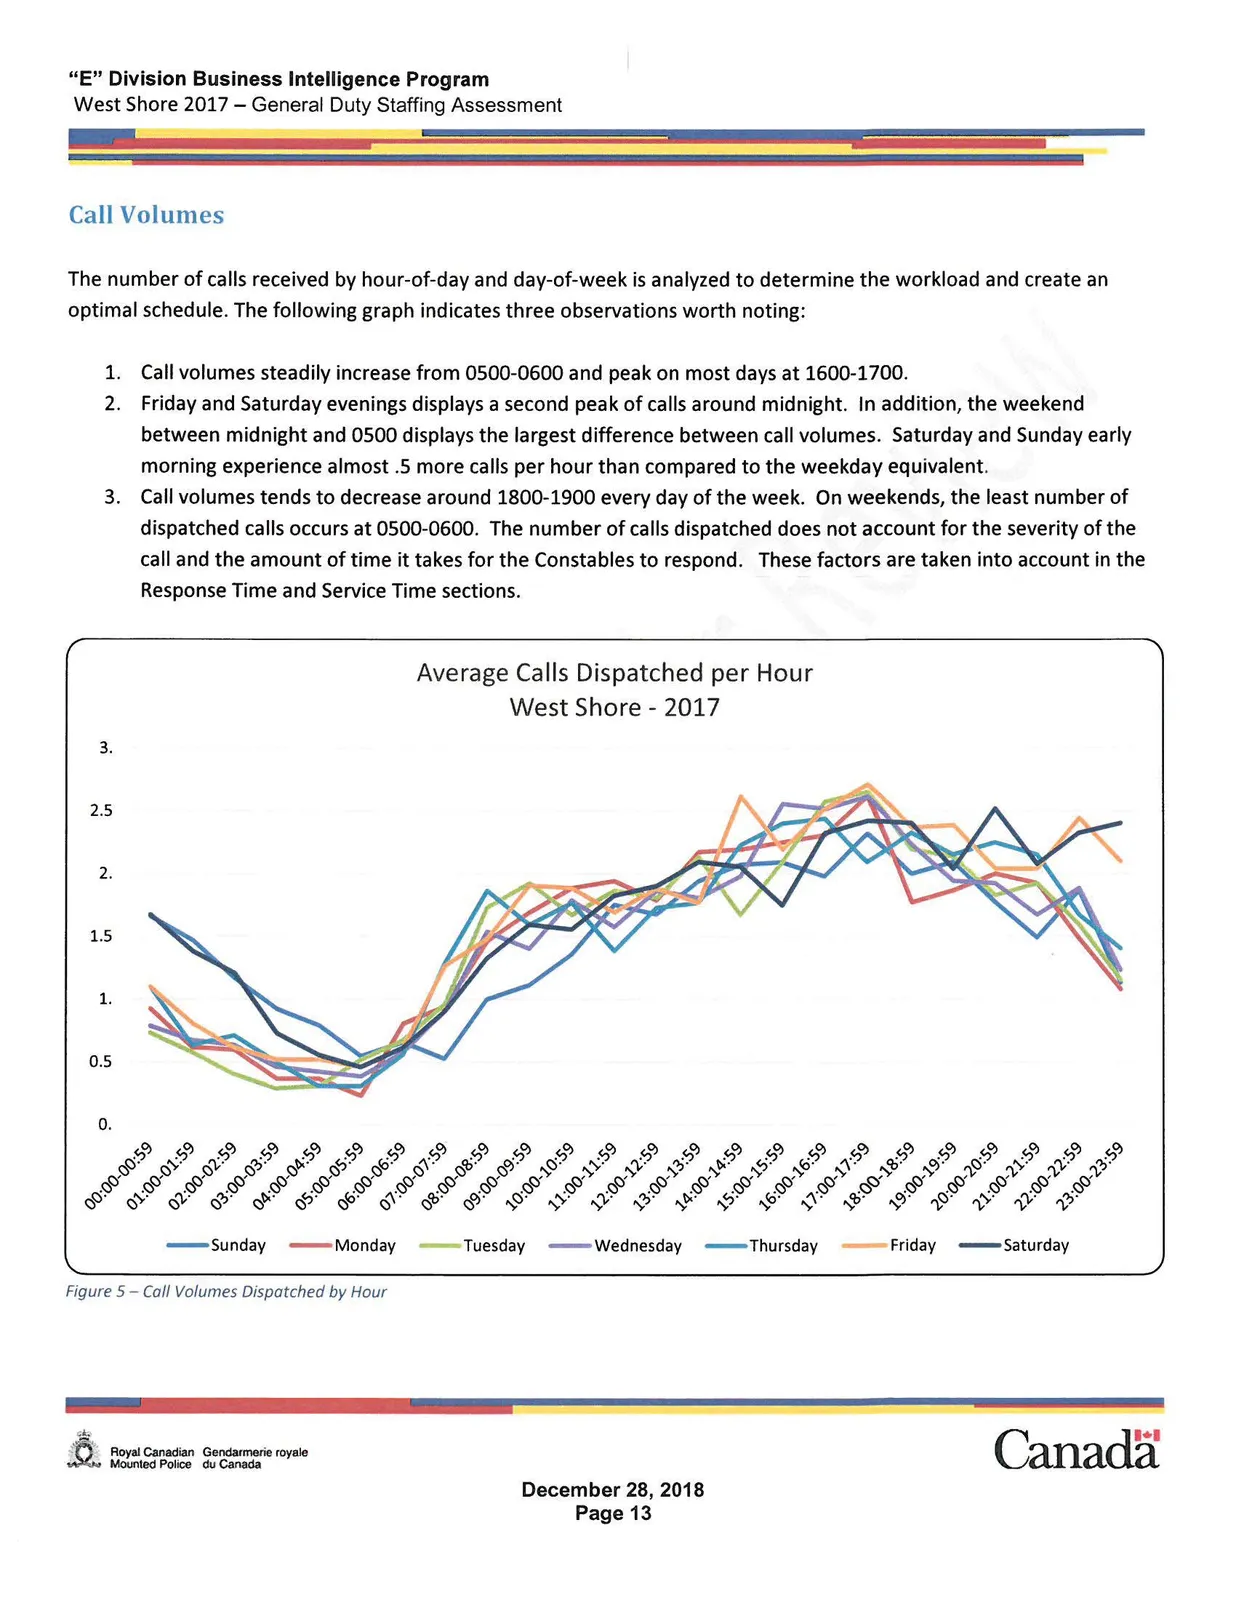
Figure 5 – Call Volumes Dispatched by Hour
Call Prioritization
Call Prioritization is critical for identifying emergency calls that represent a risk to the welfare of people or calls for which a response time is vital to protect lives. The Managing Patrol Performance (MPP) software used in this analysis uses the terms of Emergency, Urgent, and Routine. Appendix D explains the definitions of Emergency, Urgent, and Routine and the RCMP equivalents.
The bar graph that follows shows the number of calls dispatched by priority in West Shore for 2017 by time of day. Emergency, Urgent and Routine calls fluctuate across the different time periods. All three priorities display the least amount of calls from 0300-0559. Appendix B contains the call data dispatched by type and priority that is consistent with the definitions for those priorities.
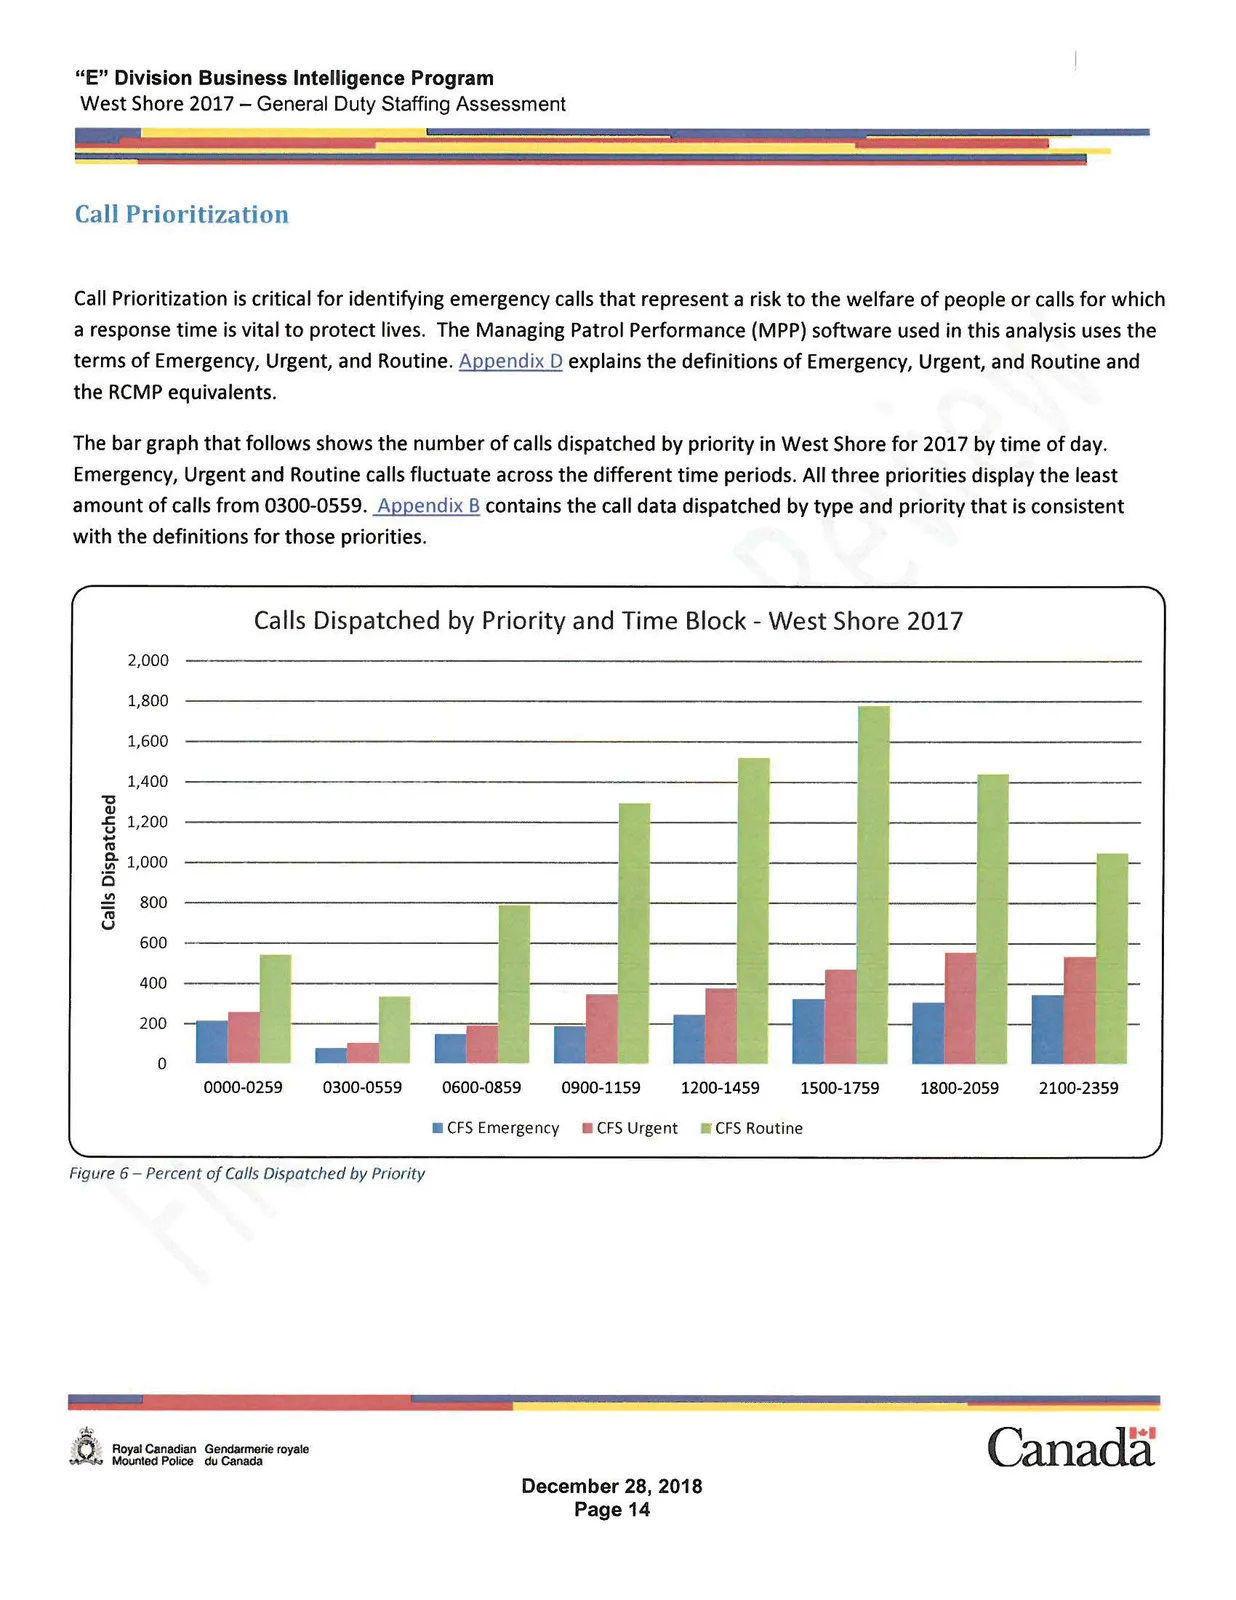
Figure 6 – Percent of Calls Dispatched by Priority
Types of Calls for Service
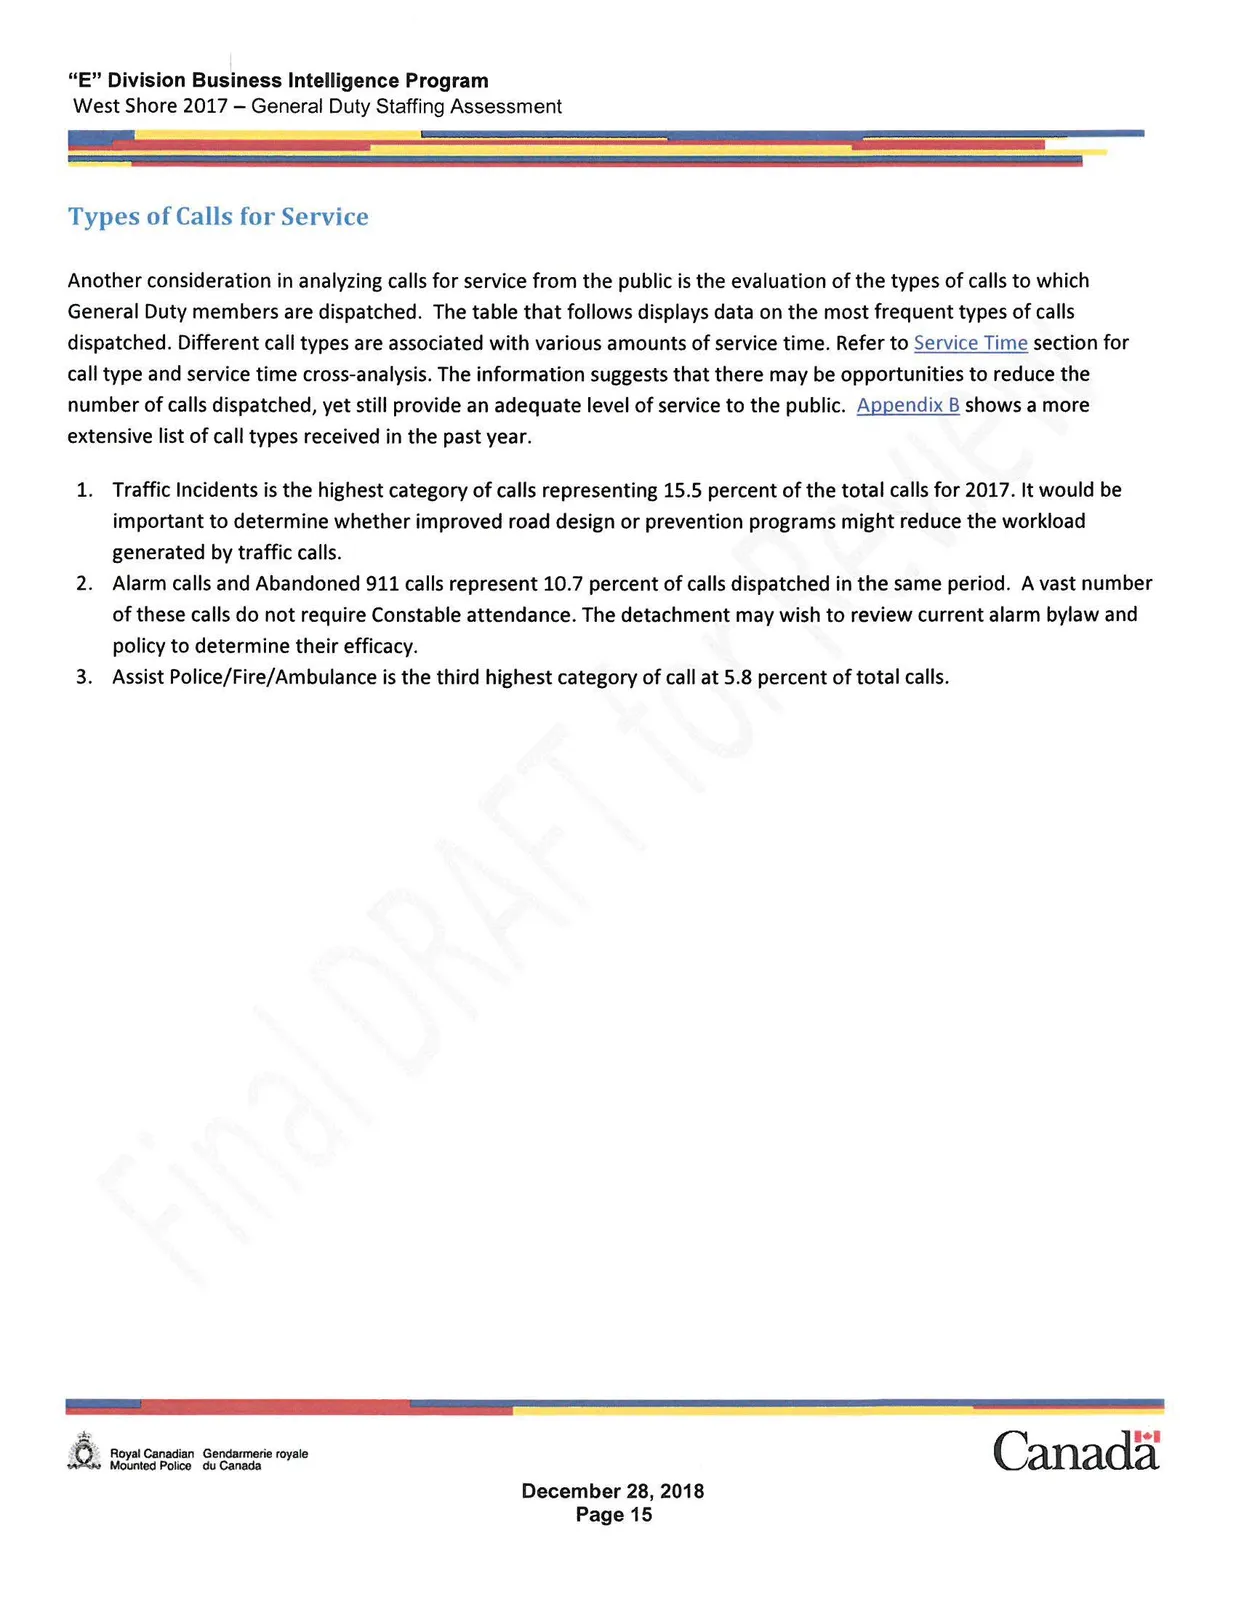
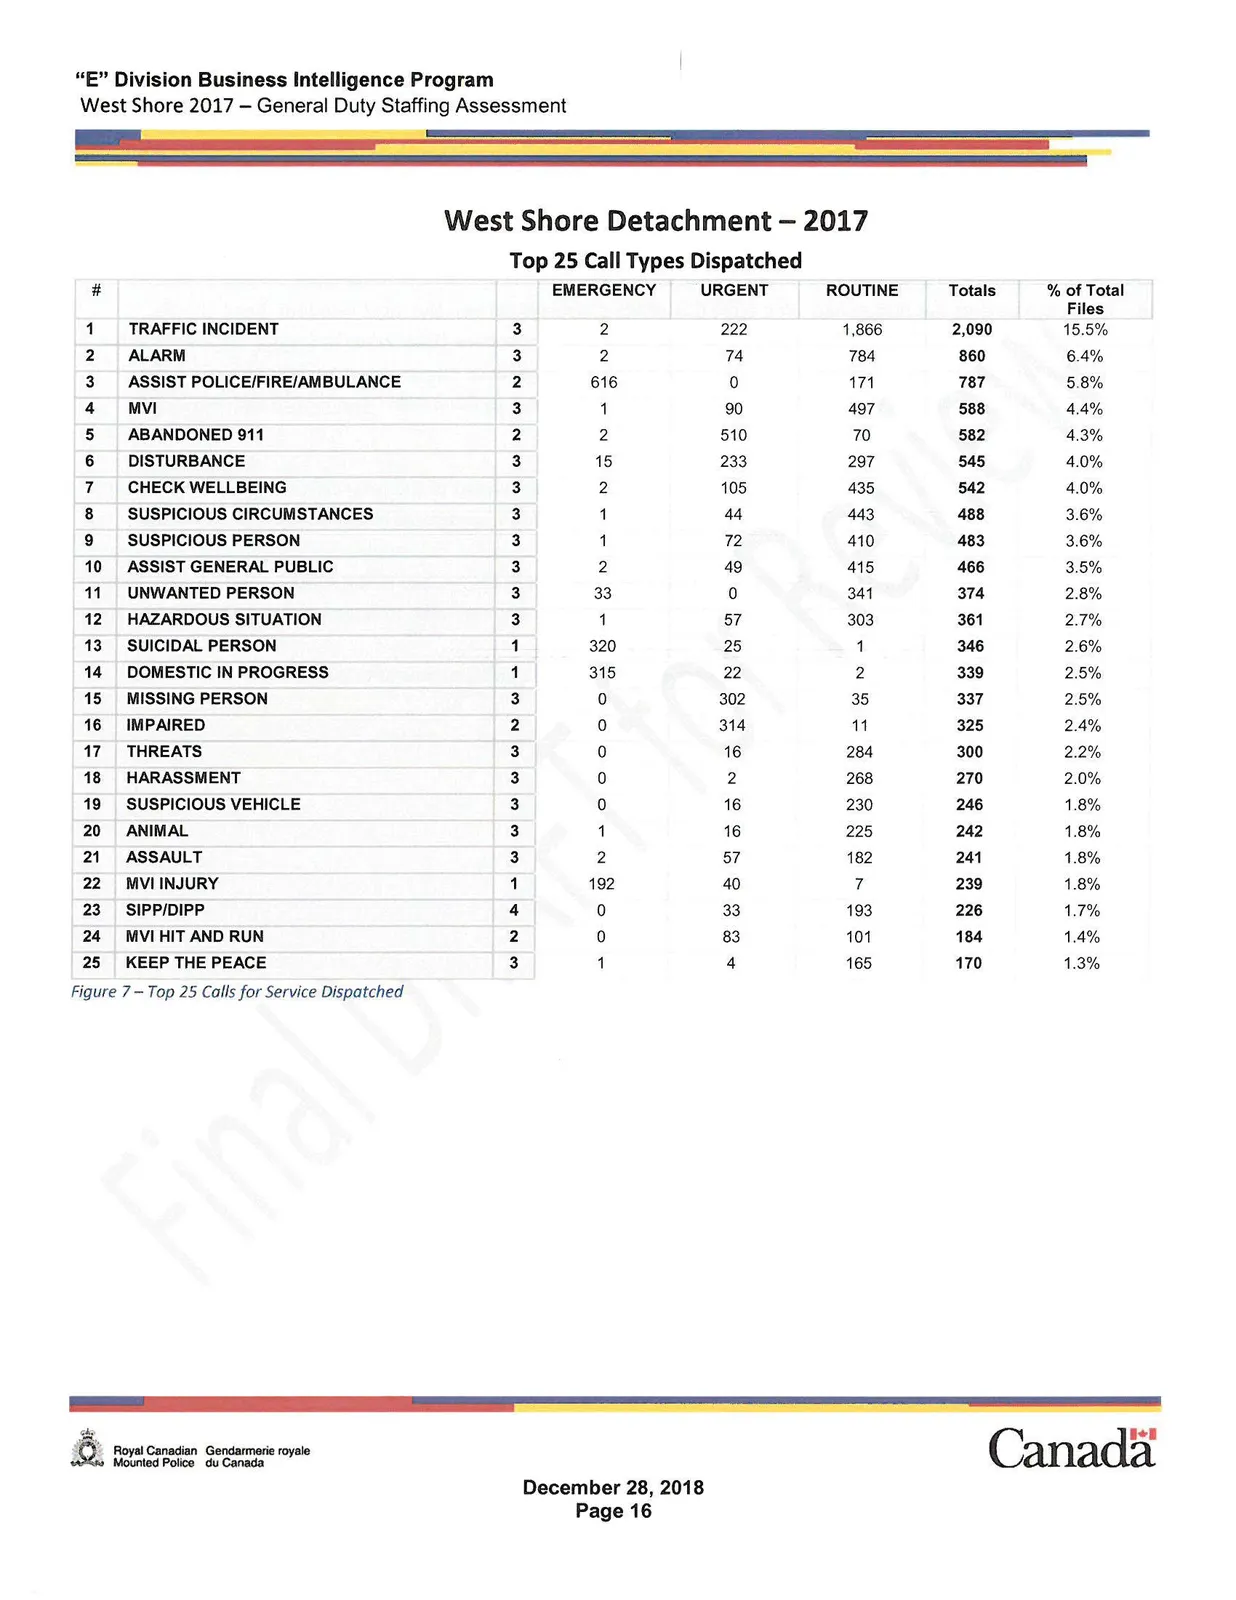
Another consideration in analyzing calls for service from the public is the evaluation of the types of calls to which General Duty members are dispatched. The table that follows displays data on the most frequent types of calls dispatched. Different call types are associated with various amounts of service time. Refer to Service Time section for call type and service time cross-analysis. The information suggests that there may be opportunities to reduce the number of calls dispatched, yet still provide an adequate level of service to the public. Appendix B shows a more extensive list of call types received in the past year.
- Traffic Incidents is the highest category of calls representing 15.5 percent of the total calls for 2017. It would be important to determine whether improved road design or prevention programs might reduce the workload generated by traffic calls.
- Alarm calls and Abandoned 911 calls represent 10.7 percent of calls dispatched in the same period. A vast number of these calls do not require Constable attendance. The detachment may wish to review current alarm bylaw and policy to determine their efficacy.
- Assist Police/Fire/Ambulance is the third highest category of call at 5.8 percent of total calls.
West Shore Detachment — 2017
Top 25 Call Types Dispatched
| # | CALL TYPE | EMERGENCY | URGENT | ROUTINE | Totals | % of Total Files |
|---|---|---|---|---|---|---|
| 1 | TRAFFIC INCIDENT | 2 | 222 | 1,866 | 2,090 | 15.5% |
| 2 | ALARM | 2 | 74 | 784 | 860 | 6.4% |
| 3 | ASSIST POLICE/FIRE/AMBULANCE | 616 | 0 | 171 | 787 | 5.8% |
| 4 | MVI | 1 | 90 | 497 | 588 | 4.4% |
| 5 | ABANDONED 911 | 2 | 510 | 70 | 582 | 4.3% |
| 6 | DISTURBANCE | 15 | 233 | 297 | 545 | 4.0% |
| 7 | CHECK WELLBEING | 2 | 105 | 435 | 542 | 4.0% |
| 8 | SUSPICIOUS CIRCUMSTANCES | 1 | 44 | 443 | 488 | 3.6% |
| 9 | SUSPICIOUS PERSON | 1 | 72 | 410 | 483 | 3.6% |
| 10 | ASSIST GENERAL PUBLIC | 2 | 49 | 415 | 466 | 3.5% |
| 11 | UNWANTED PERSON | 33 | 0 | 341 | 374 | 2.8% |
| 12 | HAZARDOUS SITUATION | 1 | 57 | 303 | 361 | 2.7% |
| 13 | SUICIDAL PERSON | 320 | 25 | 1 | 346 | 2.6% |
| 14 | DOMESTIC IN PROGRESS | 315 | 22 | 2 | 339 | 2.5% |
| 15 | MISSING PERSON | 0 | 302 | 35 | 337 | 2.5% |
| 16 | IMPAIRED | 0 | 314 | 11 | 325 | 2.4% |
| 17 | THREATS | 0 | 16 | 284 | 300 | 2.2% |
| 18 | HARASSMENT | 0 | 2 | 268 | 270 | 2.0% |
| 19 | SUSPICIOUS VEHICLE | 0 | 16 | 230 | 246 | 1.8% |
| 20 | ANIMAL | 1 | 16 | 225 | 242 | 1.8% |
| 21 | ASSAULT | 2 | 57 | 182 | 241 | 1.8% |
| 22 | MVI INJURY | 192 | 40 | 7 | 239 | 1.8% |
| 23 | SIPP/DIPP | 0 | 33 | 193 | 226 | 1.7% |
| 24 | MVI HIT AND RUN | 0 | 83 | 101 | 184 | 1.4% |
| 25 | KEEP THE PEACE | 1 | 4 | 165 | 170 | 1.3% |
Figure 7 – Top 25 Calls for Service Dispatched
Top Ten Calls by Month
The graph below depicts the top 10 types of calls for service dispatched by month. This analysis may be used to target public awareness campaigns at certain times of the year. In addition, the analysis may indicate a need for additional (seasonal) policing during the summer months. The number of dispatched Traffic Incidents trends upwards starting in January and reaching its peak in July (220). Furthermore, the number of Traffic Incidents remain notably high with second and third peaks in September (211) and December (188) respectively. The detachment may want to examine this further to determine if road design or community awareness campaigns may reduce the number of Traffic calls.
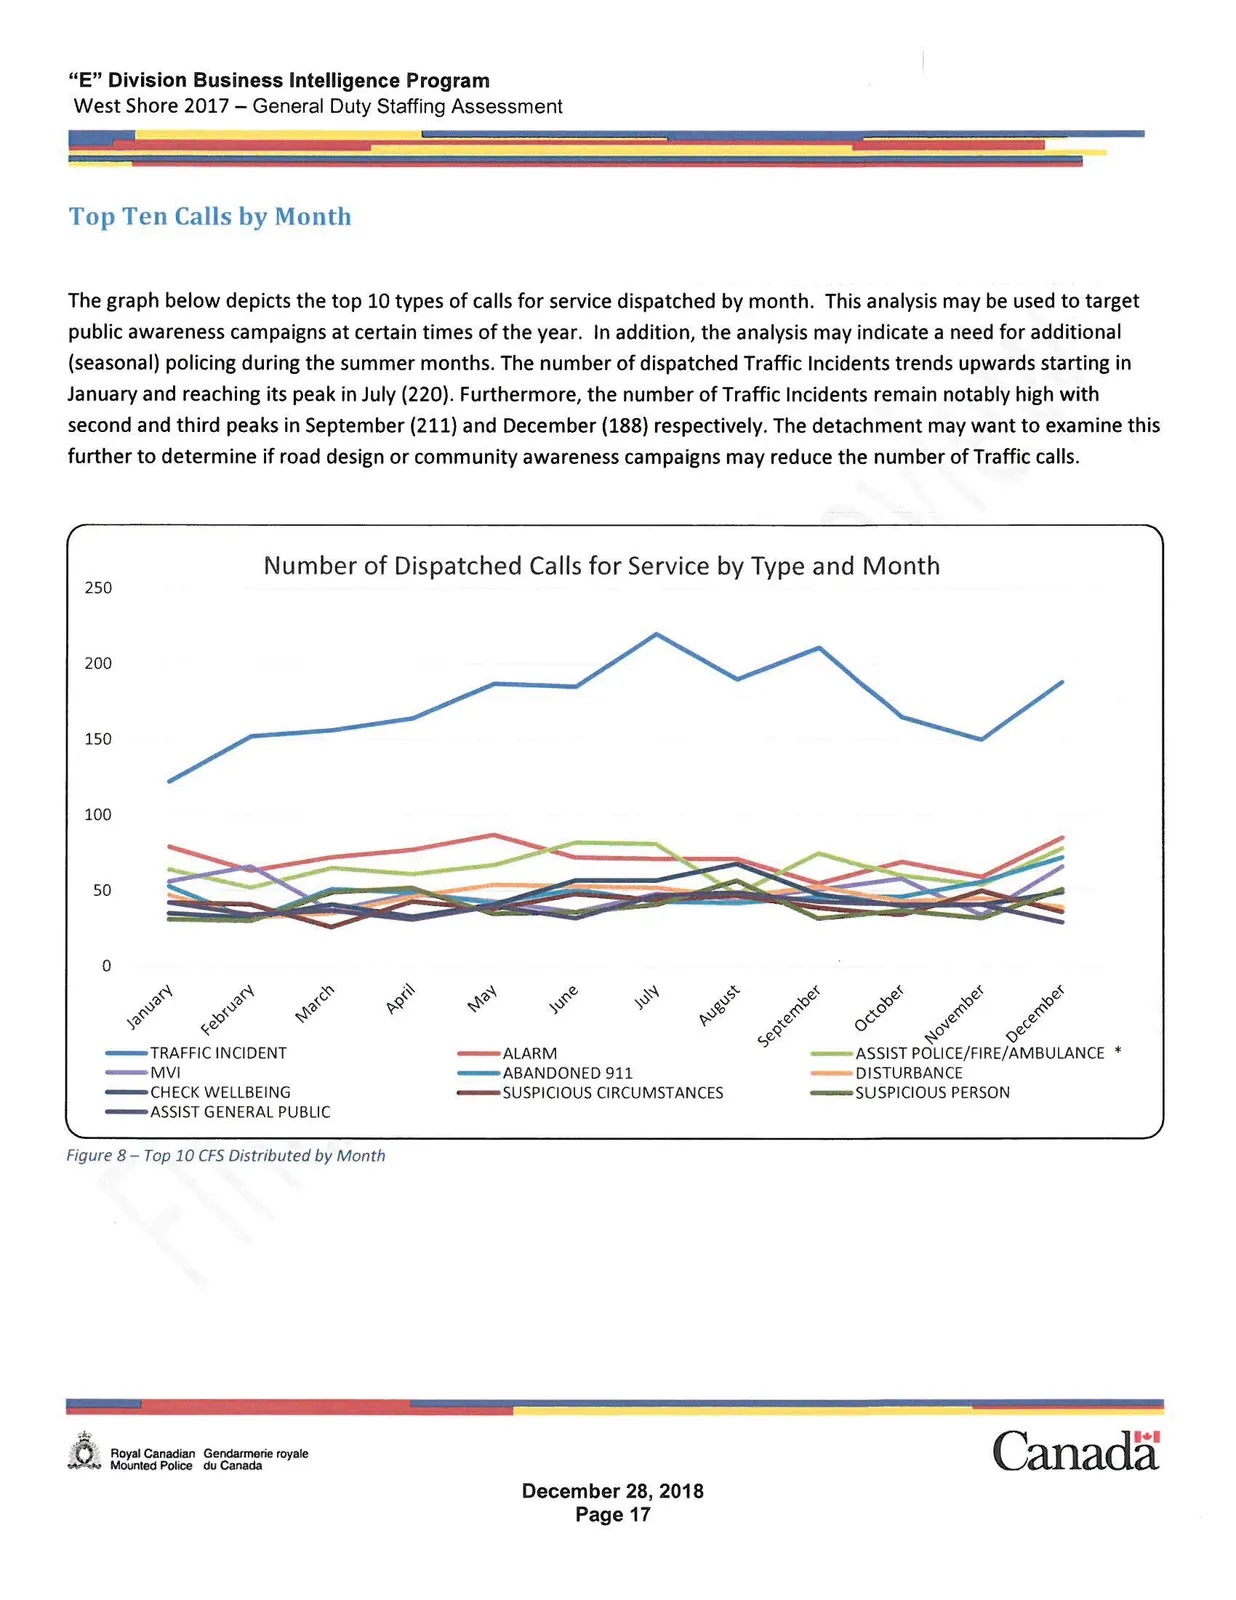
Figure 8 – Top 10 CFS Distributed by Month
Response Time
To meet the expectations of the public and maintain a consistent level of service, the number of General Duty Members on duty by hour of the day and day of week must meet the fluctuating change of workload. The graphic below illustrates the sequence of events described by the definitions used for the time mileposts and time intervals that make up General Duty response to a call for service.
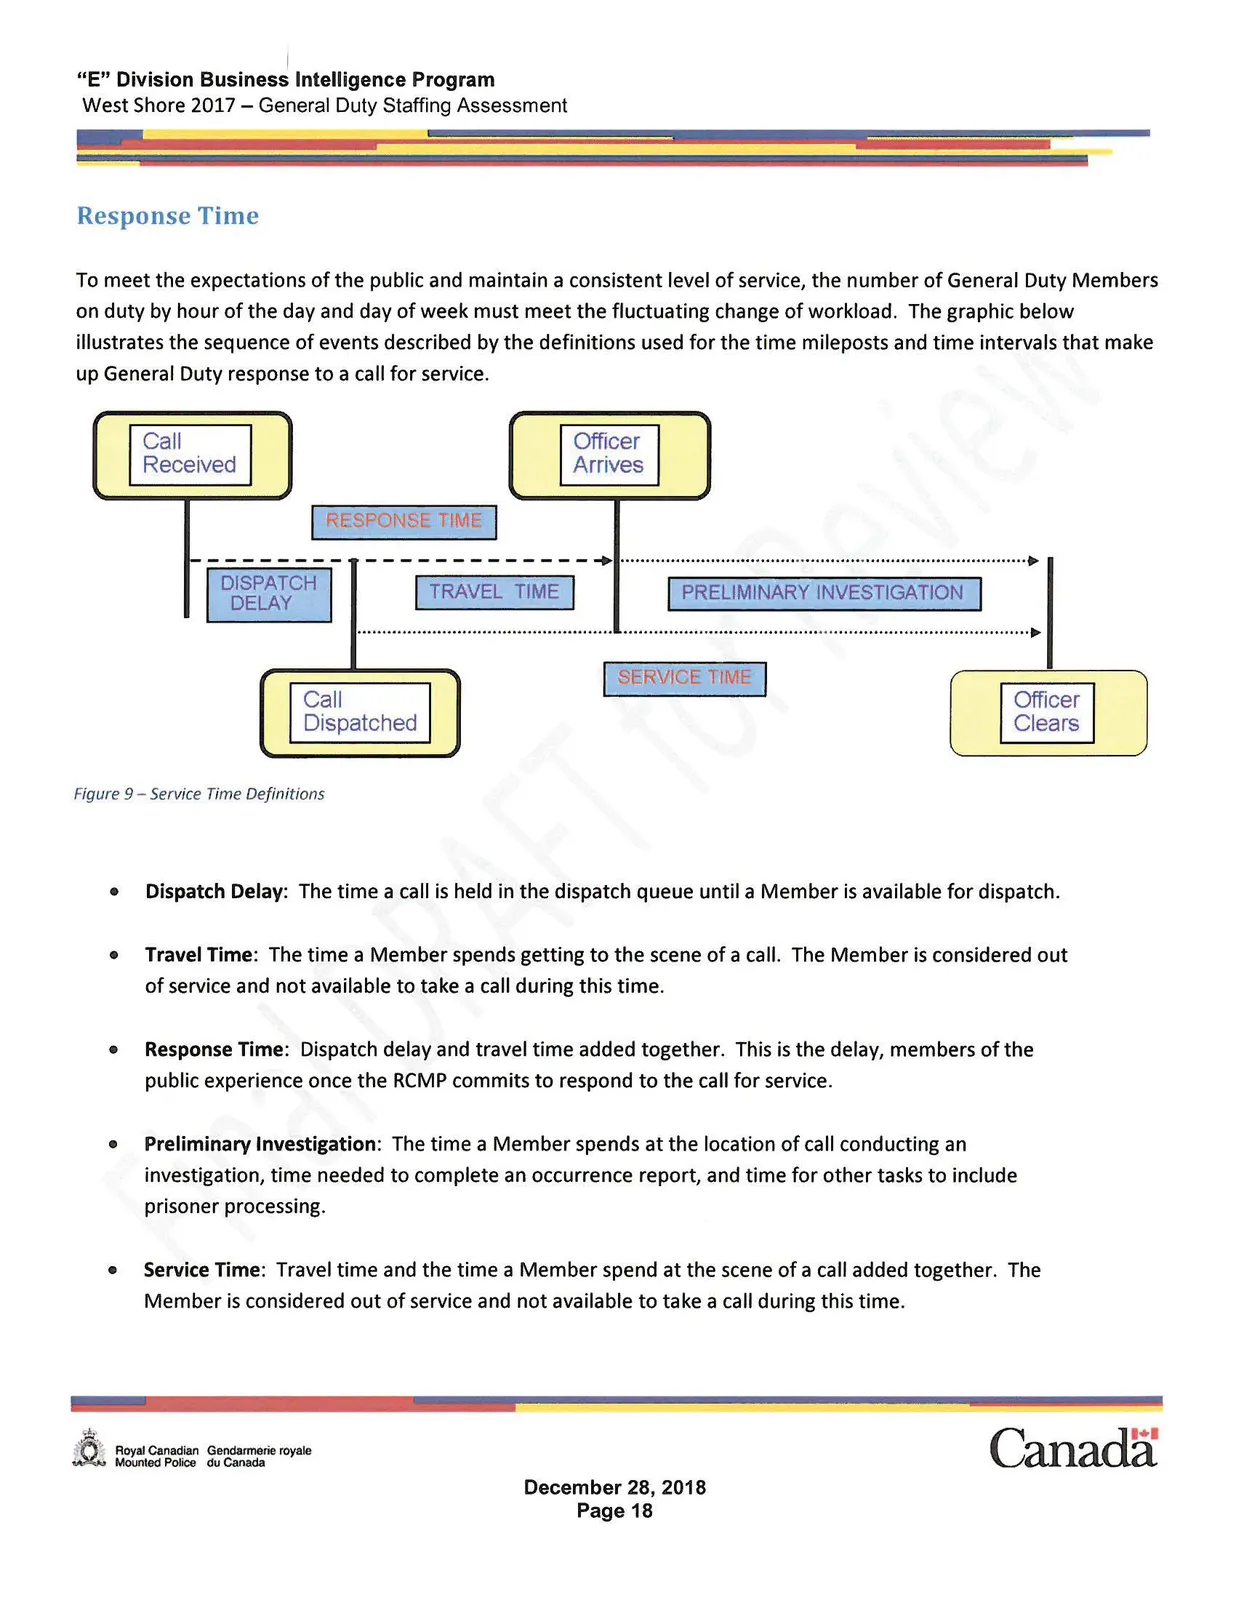
Figure 9 – Service Time Definitions
- Dispatch Delay: The time a call is held in the dispatch queue until a Member is available for dispatch.
- Travel Time: The time a Member spends getting to the scene of a call. The Member is considered out of service and not available to take a call during this time.
- Response Time: Dispatch delay and travel time added together. This is the delay, members of the public experience once the RCMP commits to respond to the call for service.
- Preliminary Investigation: The time a Member spends at the location of call conducting an investigation, time needed to complete an occurrence report, and time for other tasks to include prisoner processing.
- Service Time: Travel time and the time a Member spend at the scene of a call added together. The Member is considered out of service and not available to take a call during this time.
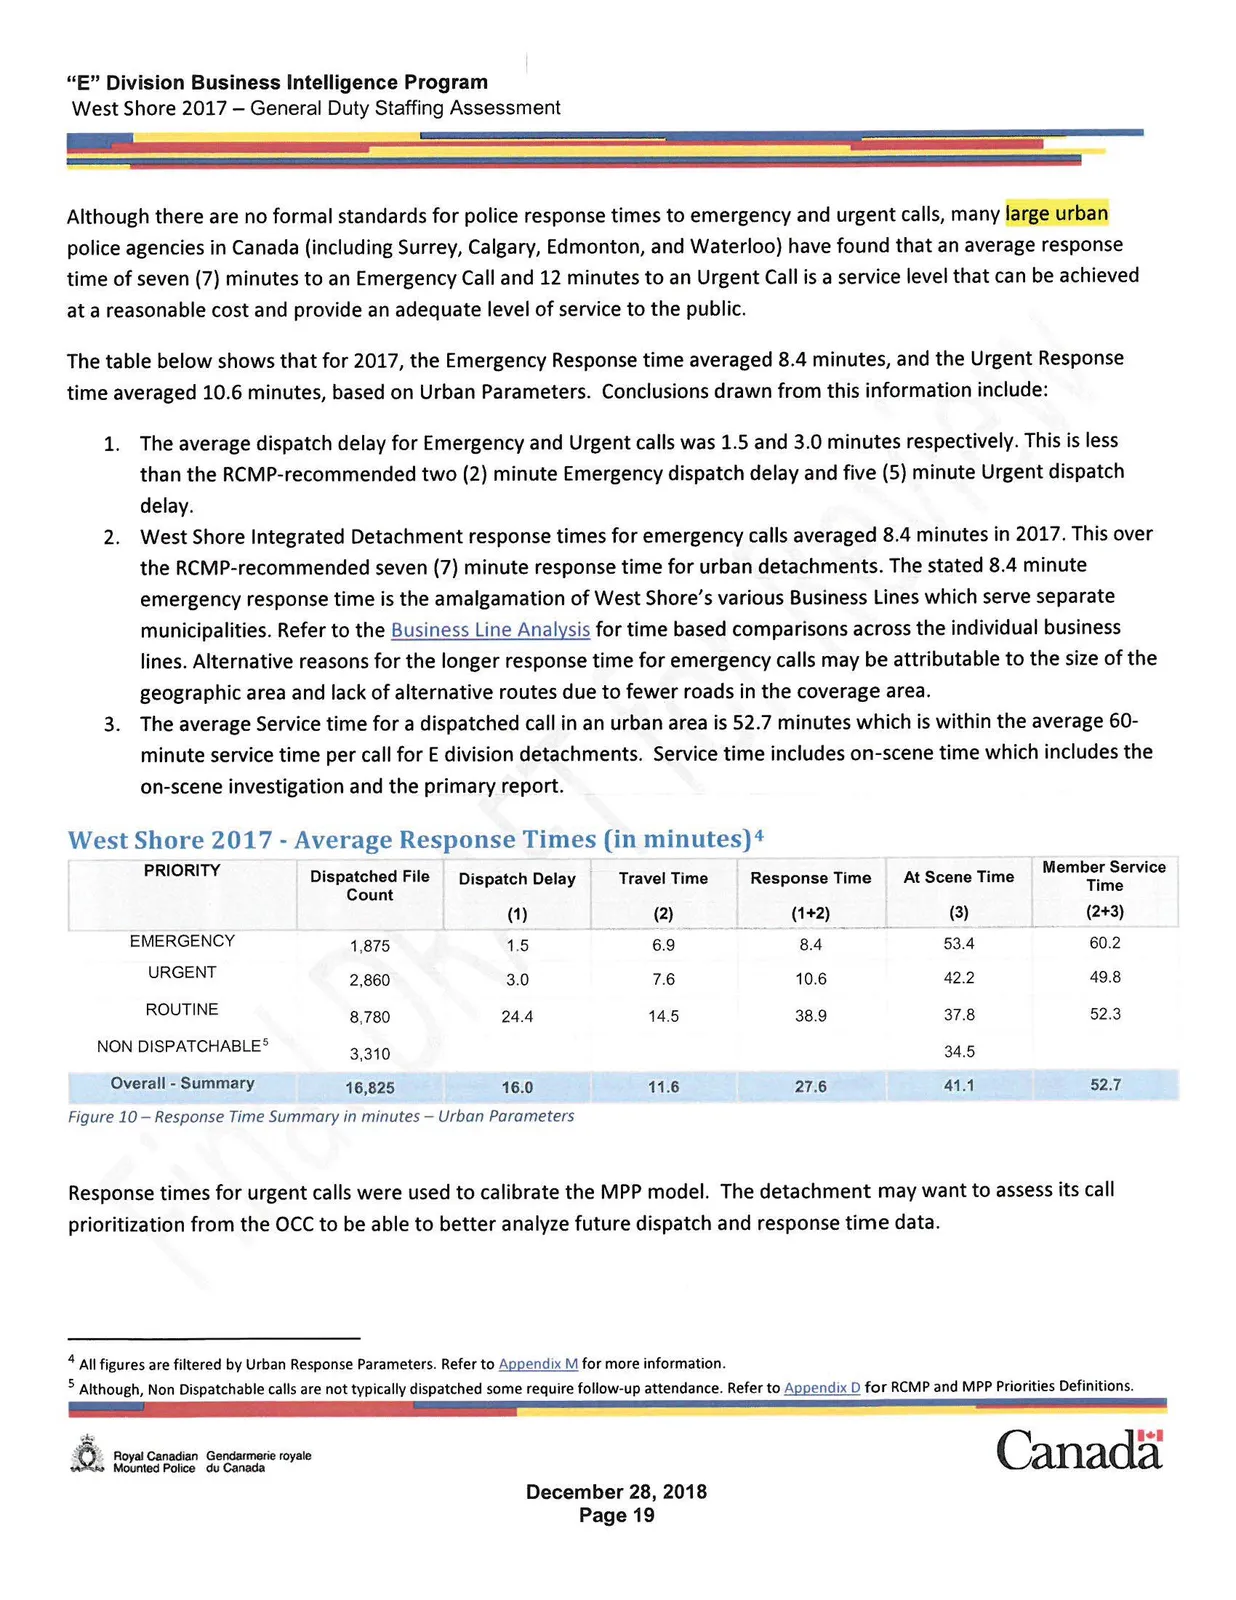
Although there are no formal standards for police response times to emergency and urgent calls, many large urban police agencies in Canada (including Surrey, Calgary, Edmonton, and Waterloo) have found that an average response time of seven (7) minutes to an Emergency Call and 12 minutes to an Urgent Call is a service level that can be achieved at a reasonable cost and provide an adequate level of service to the public.
The table below shows that for 2017, the Emergency Response time averaged 8.4 minutes, and the Urgent Response time averaged 10.6 minutes, based on Urban Parameters. Conclusions drawn from this information include:
- The average dispatch delay for Emergency and Urgent calls was 1.5 and 3.0 minutes respectively. This is less than the RCMP-recommended two (2) minute Emergency dispatch delay and five (5) minute Urgent dispatch delay.
- West Shore Integrated Detachment response times for emergency calls averaged 8.4 minutes in 2017. This over the RCMP-recommended seven (7) minute response time for urban detachments. The stated 8.4 minute emergency response time is the amalgamation of West Shore's various Business Lines which serve separate municipalities. Refer to the Business Line Analysis for time based comparisons across the individual business lines. Alternative reasons for the longer response time for emergency calls may be attributable to the size of the geographic area and lack of alternative routes due to fewer roads in the coverage area.
- The average Service time for a dispatched call in an urban area is 52.7 minutes which is within the average 60-minute service time per call for E division detachments. Service time includes on-scene time which includes the on-scene investigation and the primary report.
West Shore 2017 - Average Response Times (in minutes)⁴
| PRIORITY | Dispatched File Count | Dispatch Delay (1) | Travel Time (2) | Response Time (1+2) | At Scene Time (3) | Member Service Time (2+3) |
|---|---|---|---|---|---|---|
| EMERGENCY | 1,875 | 1.5 | 6.9 | 8.4 | 53.4 | 60.2 |
| URGENT | 2,860 | 3.0 | 7.6 | 10.6 | 42.2 | 49.8 |
| ROUTINE | 8,780 | 24.4 | 14.5 | 38.9 | 37.8 | 52.3 |
| NON DISPATCHABLE⁵ | 3,310 | 34.5 | ||||
| Overall - Summary | 16,825 | 16.0 | 11.6 | 27.6 | 41.1 | 52.7 |
Figure 10 – Response Time Summary in minutes – Urban Parameters
Response times for urgent calls were used to calibrate the MPP model. The detachment may want to assess its call prioritization from the OCC to be able to better analyze future dispatch and response time data.
⁴ All figures are filtered by Urban Response Parameters. Refer to Appendix M for more information. ⁵ Although, Non Dispatchable calls are not typically dispatched some require follow-up attendance. Refer to Appendix D for RCMP and MPP Priorities Definitions.
The two bar graphs below illustrate the average, emergency, and urgent response times by hour-of-day (3-hour time blocks) and day-of-week. When staffing levels match workload levels, emergency and urgent response times are consistent during each time period.
- Emergency response times averaged 8.4 minutes which is above the RCMP-recommended 7 minutes. The reason for this may be the attributed to the longer distances that Constable may have to travel in West Shore as compared to urban detachments in the Lower Mainland District. (See Appendix A to view the total CFS plotted on the geographic area covered by West Shore detachment)
- Response times are also above 7 minutes, for all time blocks and days of the week with the exception of Sunday 0000-0259, Tuesday 0300-0559 and Thursday 0000-0259.
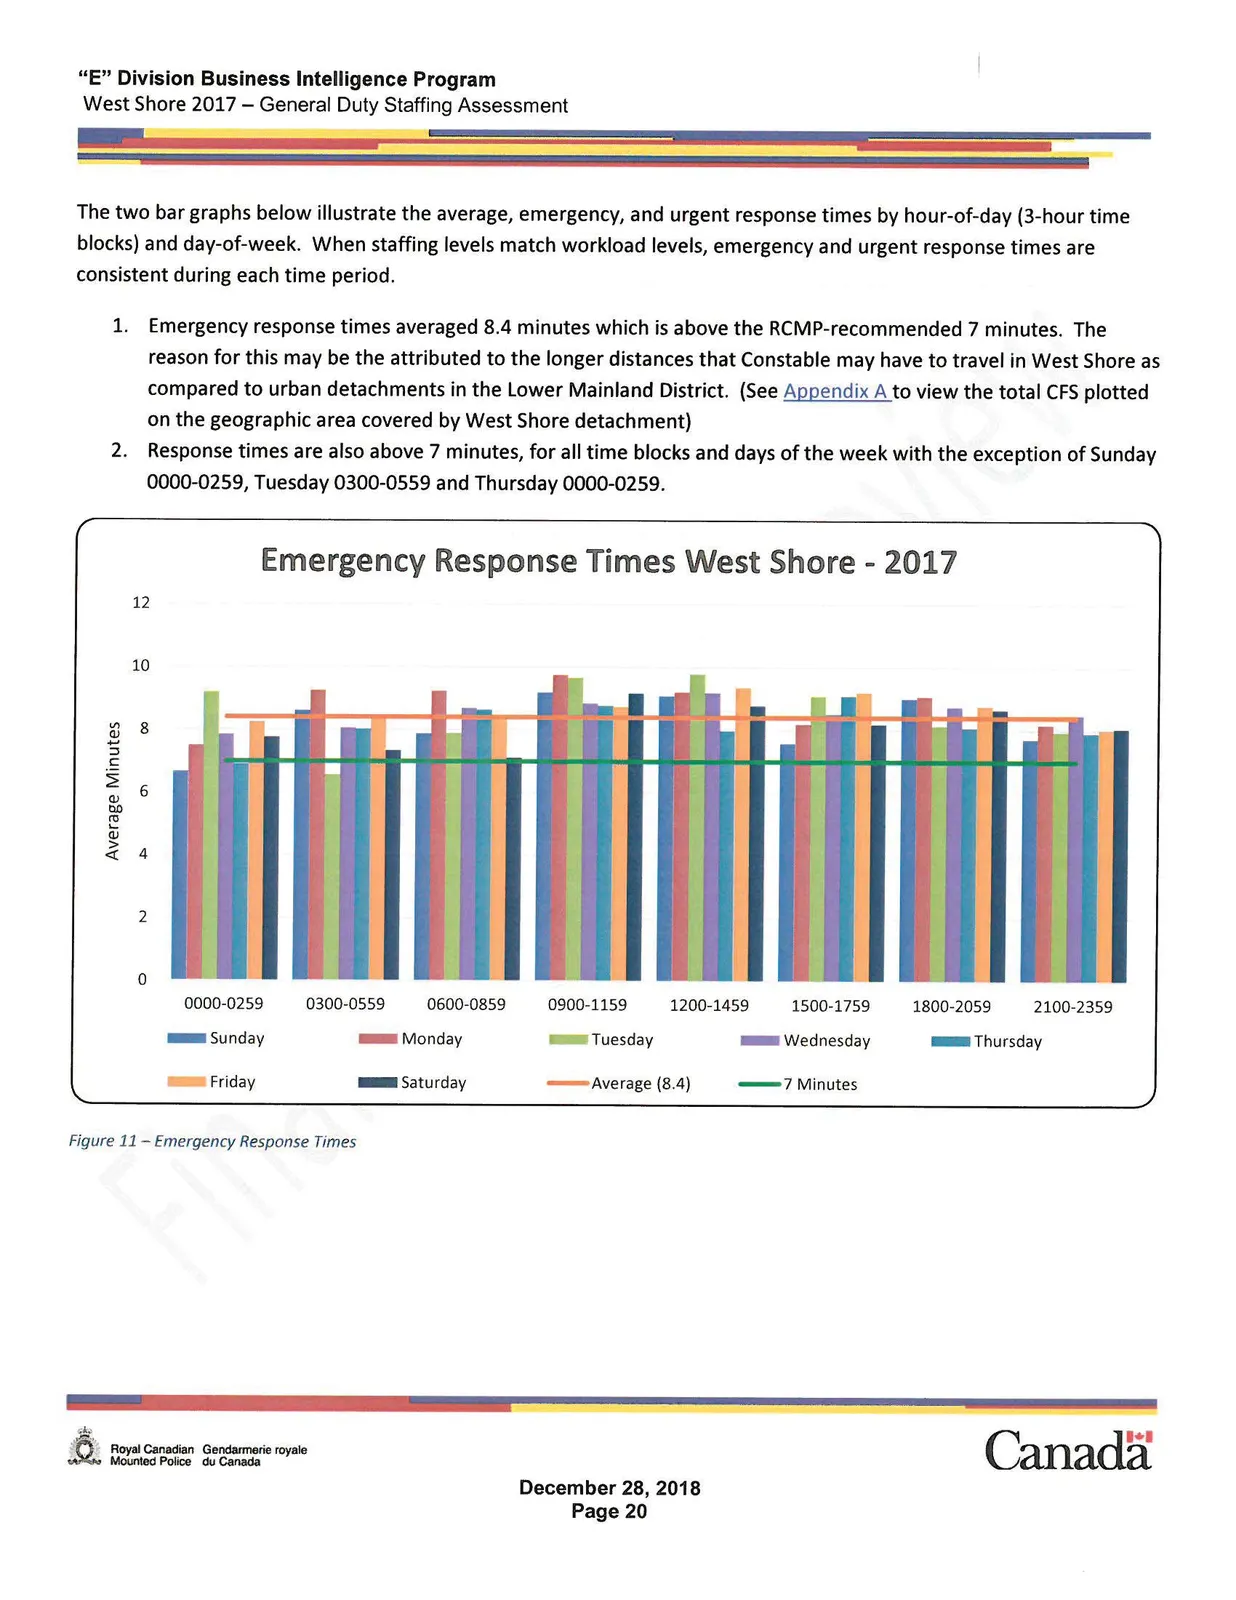
Figure 11 – Emergency Response Times
The next graph shows the average urgent response times by hour of day (3-hour time blocks) and day-of-week.
- Urgent response times averaged 10.6 minutes which is below the RCMP recommended 12-minute response time for urgent calls every day of the week in all time periods
- Friday's time blocks 0900-1159, 1200-1459 and 1500-1759 all exceed the recommended 12-minute response time.
- Wednesday's time block 0900-1159 exceeds the recommended 12-minute response time.
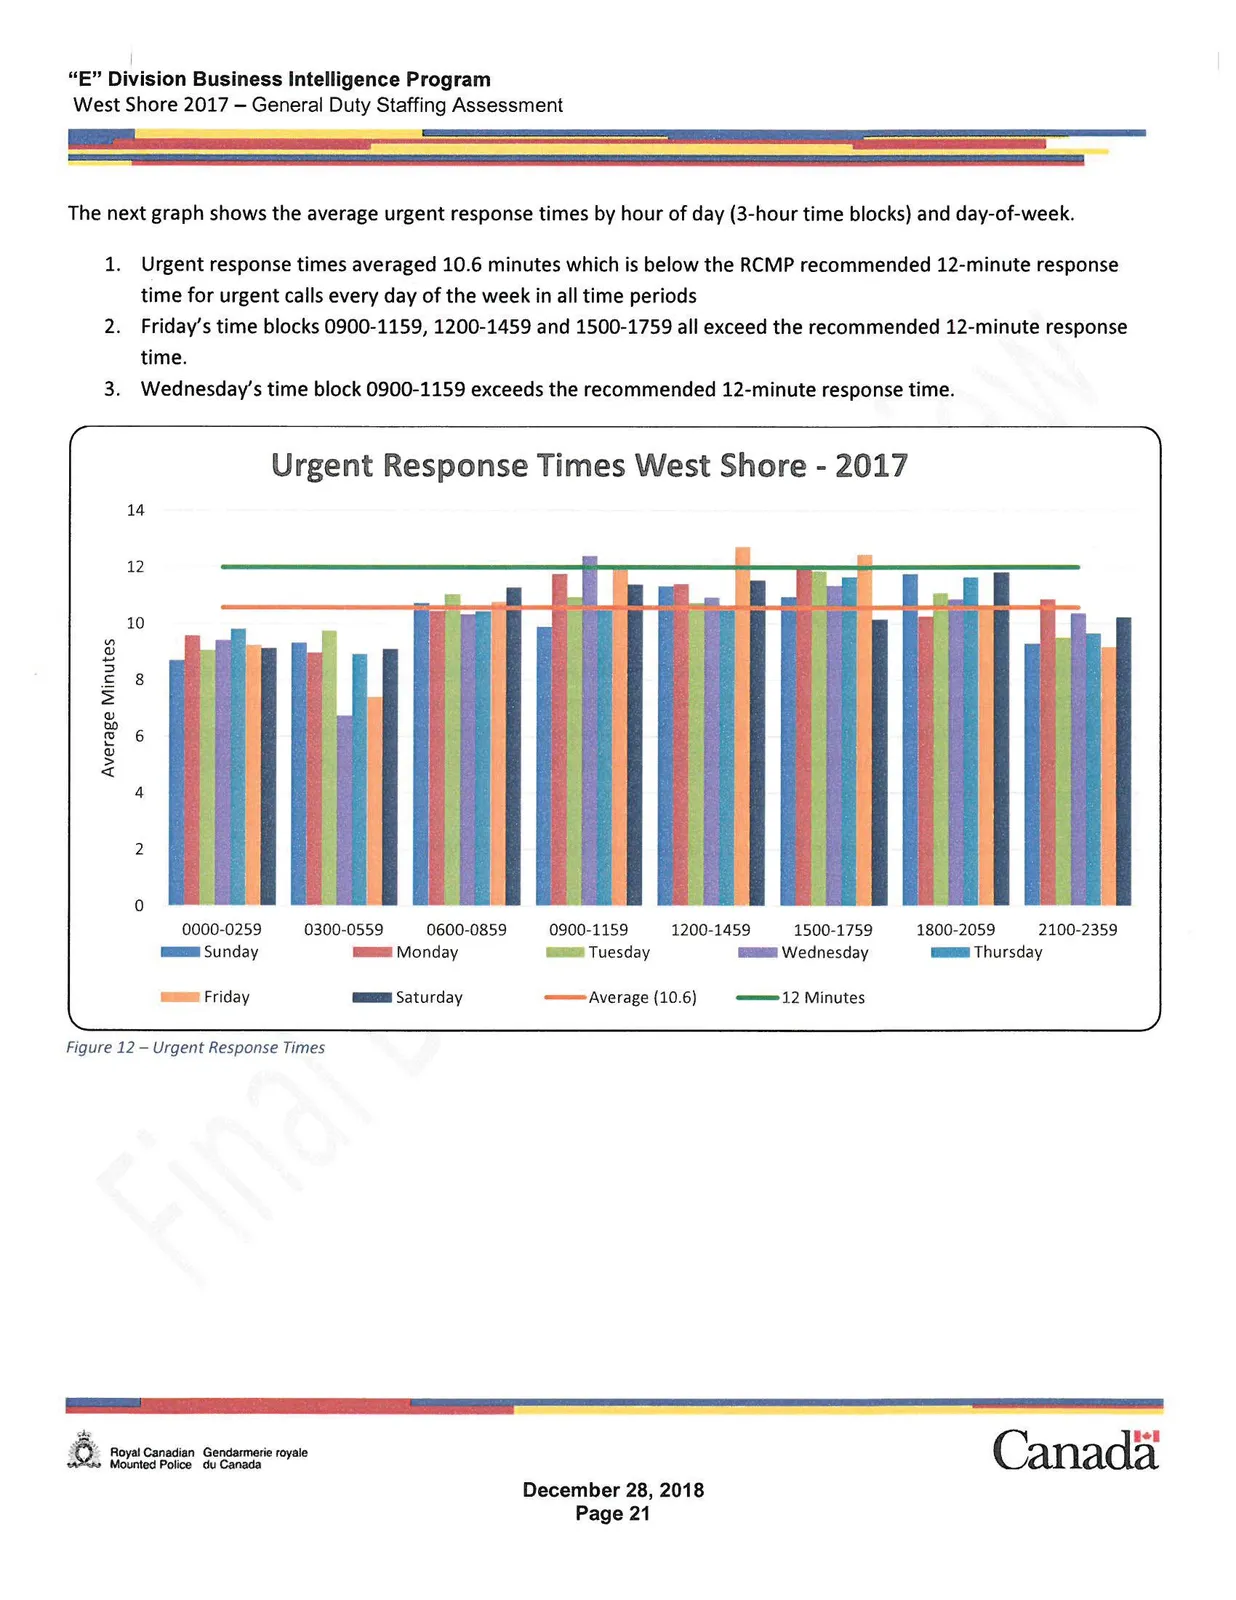
Figure 12 – Urgent Response Times
General Duty Performance
General Duty performance data from BC PRIME CAD is imported into The Managing Patrol Performance (MPP) modeling software. The fielded units are adjusted to match actual members fielded as entered in the TEAM shift scheduling module. The model is then calibrated to match the actual response times from the Business Intelligence (CAD) Response Time reports. If the results do not meet the prescribed tolerances, the following adjustments are made:
- If MPP calculated emergency response times are slower than those in the response time reports, units are added because additional non-GD units must have supplemented primary response units to achieve the faster times.
- If MPP calculated emergency response times are faster than those in the response time reports, administrative time is increased on the premise that some units were not available because of the time spent on out of service related work.
No units were added in the calibration process.
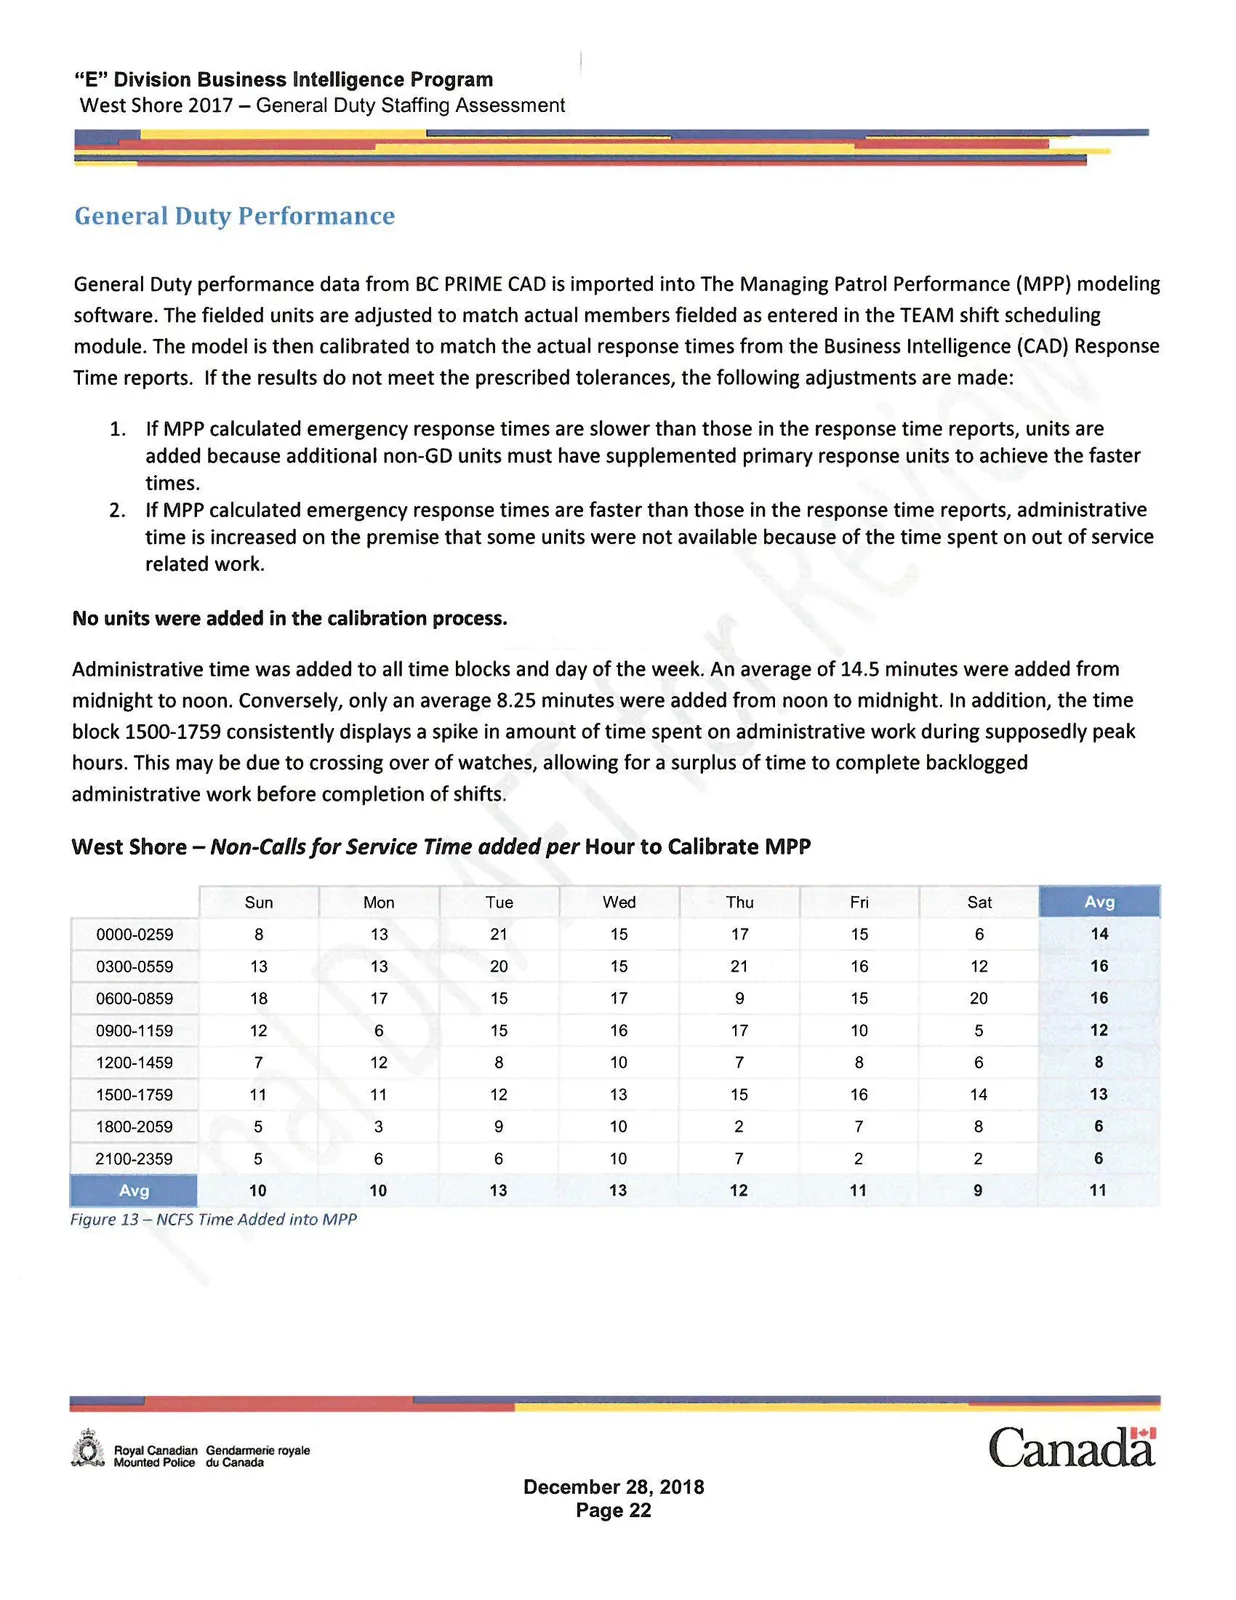
Administrative time was added to all time blocks and day of the week. An average of 14.5 minutes were added from midnight to noon. Conversely, only an average 8.25 minutes were added from noon to midnight. In addition, the time block 1500-1759 consistently displays a spike in amount of time spent on administrative work during supposedly peak hours. This may be due to crossing over of watches, allowing for a surplus of time to complete backlogged administrative work before completion of shifts.
West Shore – Non-Calls for Service Time added per Hour to Calibrate MPP
| Sun | Mon | Tue | Wed | Thu | Fri | Sat | Avg | |
|---|---|---|---|---|---|---|---|---|
| 0000-0259 | 8 | 13 | 21 | 15 | 17 | 15 | 6 | 14 |
| 0300-0559 | 13 | 13 | 20 | 15 | 21 | 16 | 12 | 16 |
| 0600-0859 | 18 | 17 | 15 | 17 | 9 | 15 | 20 | 16 |
| 0900-1159 | 12 | 6 | 15 | 16 | 17 | 10 | 5 | 12 |
| 1200-1459 | 7 | 12 | 8 | 10 | 7 | 8 | 6 | 8 |
| 1500-1759 | 11 | 11 | 12 | 13 | 15 | 16 | 14 | 13 |
| 1800-2059 | 5 | 3 | 9 | 10 | 2 | 7 | 8 | 6 |
| 2100-2359 | 5 | 6 | 6 | 10 | 7 | 2 | 2 | 6 |
| Avg | 10 | 10 | 13 | 13 | 12 | 11 | 9 | 11 |
Figure 13 – NCFS Time Added into MPP
MPP takes into account the amount of time units are not available because of investigative and administrative tasks that keep General Duty (GD) members from responding to Calls for Service (CFS). This is defined as Out of Service (OOS) Time, which includes court time, meals, breaks, and follow-up investigation that occurs after a call is cleared. Out of Service Time is determined by busy codes entered into the BC PRIME dispatch system.
Once MPP input information is calibrated, it is used to measure how GD members’ time is being utilized. Appendix C, Calibration, offers further explanation on the calibration performed for West Shore detachment.
Time Spent on Tasks Other Than Calls for Service
While calls for service and response times are important, the measure of General Duty (GD) workload is how time much time is spent on tasks. The following reports obtained from MPP indicate the percentage of time all responding units at the West Shore detachment spent on the three main categories of time:
Calls for Service (CFS): This is the time spent by GD members that respond to calls for service from the public. This includes the time from when the member is dispatched to the call until the time the member has completed the preliminary investigation and report and cleared the call. This time is captured through the use of status and busy codes entered into the CAD by OCC and GD members.
Out of Service (OOS): This time is made up of tasks other than calls for service that prevent members from responding to calls. Activities include court, training, vehicle maintenance, break, etc.
Available Proactive time (PROAC): This is the time that remains when CFS and Out of Service work are deducted from the work day. Proactive time includes officer initiated activities such as bar checks, street checks, foot patrol, and traffic stops, etc. (See Appendix D for the list of busy codes entered into the CAD by Members that make up Available proactive time).
These results show that all responding units at the West Shore detachment spend 34.8 percent of their time on calls for service, spend 51.3 percent on out of service work, and 13.5 percent of time on proactive work. CFS, OOS, and PROAC officer activity is coded so that it is possible to know what tasks were being completed with that time. For the activity breakdown exclusively for GD members, refer to Appendix D.
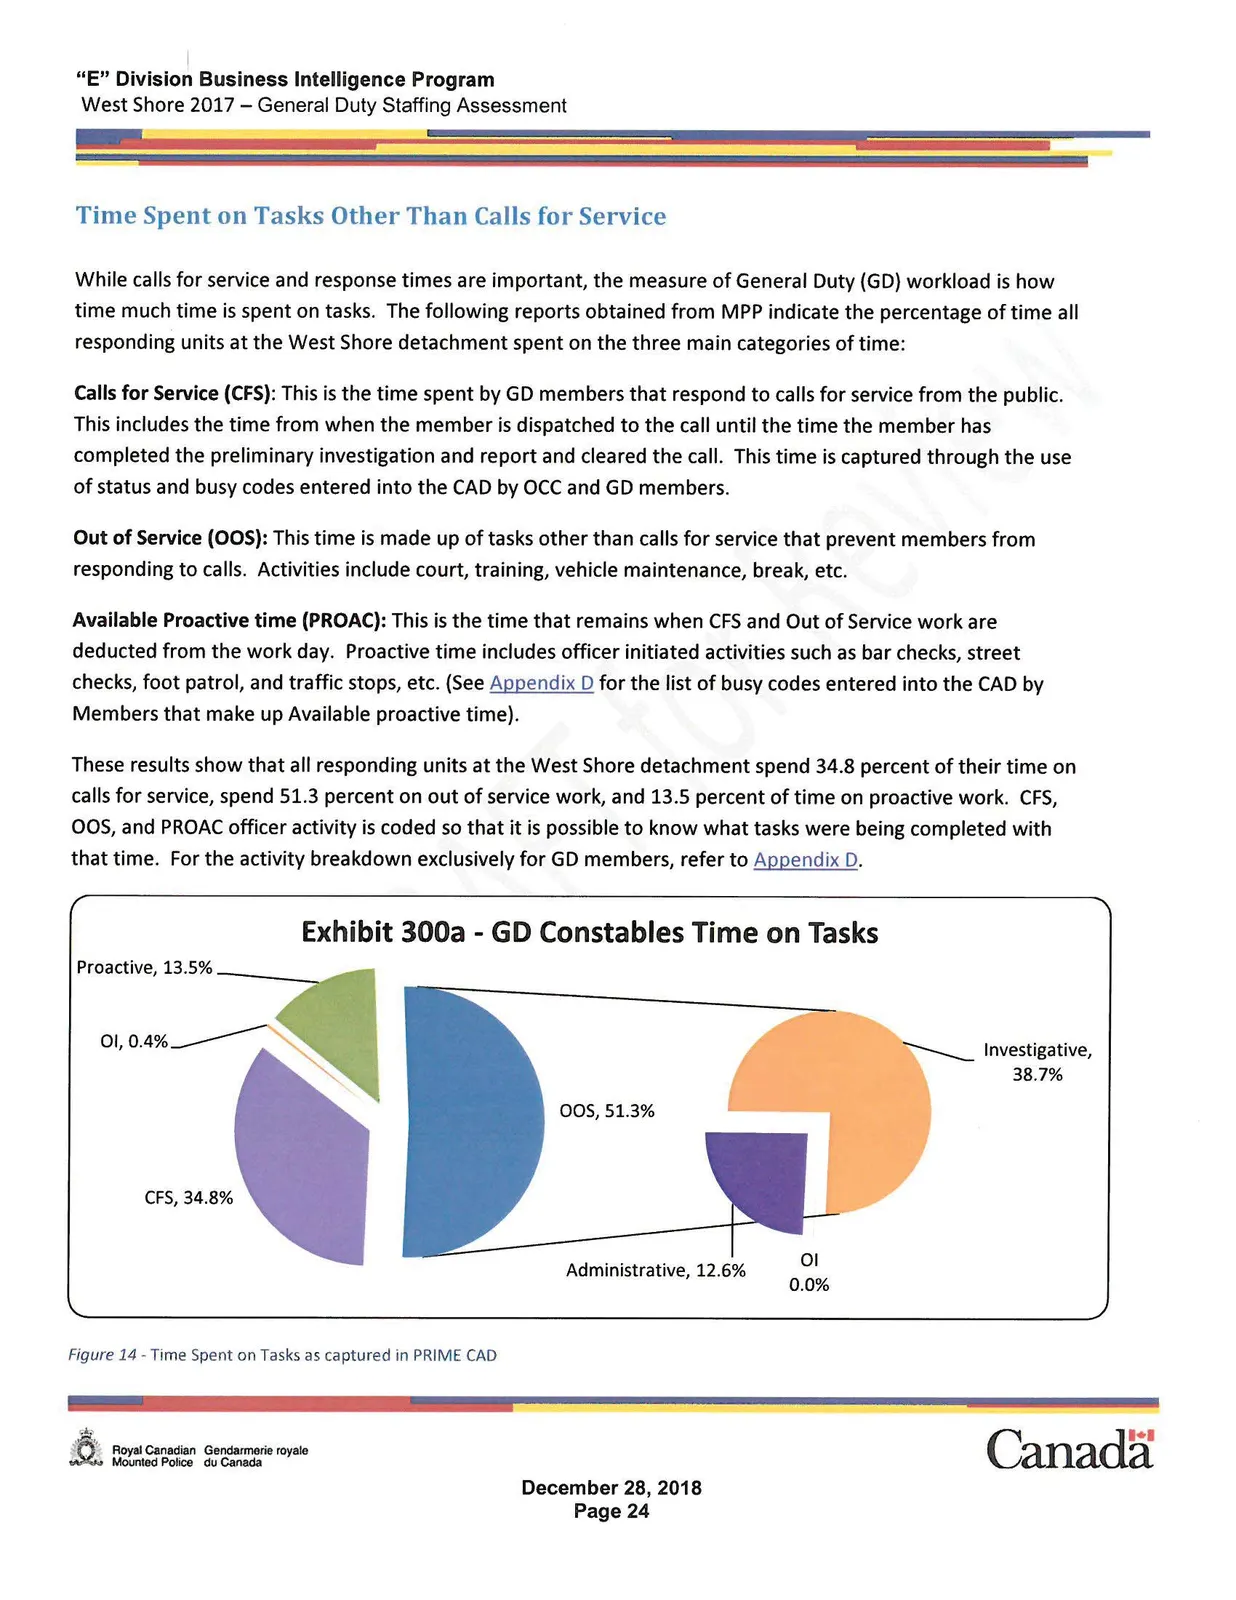
Figure 14 - Time Spent on Tasks as captured in PRIME CAD
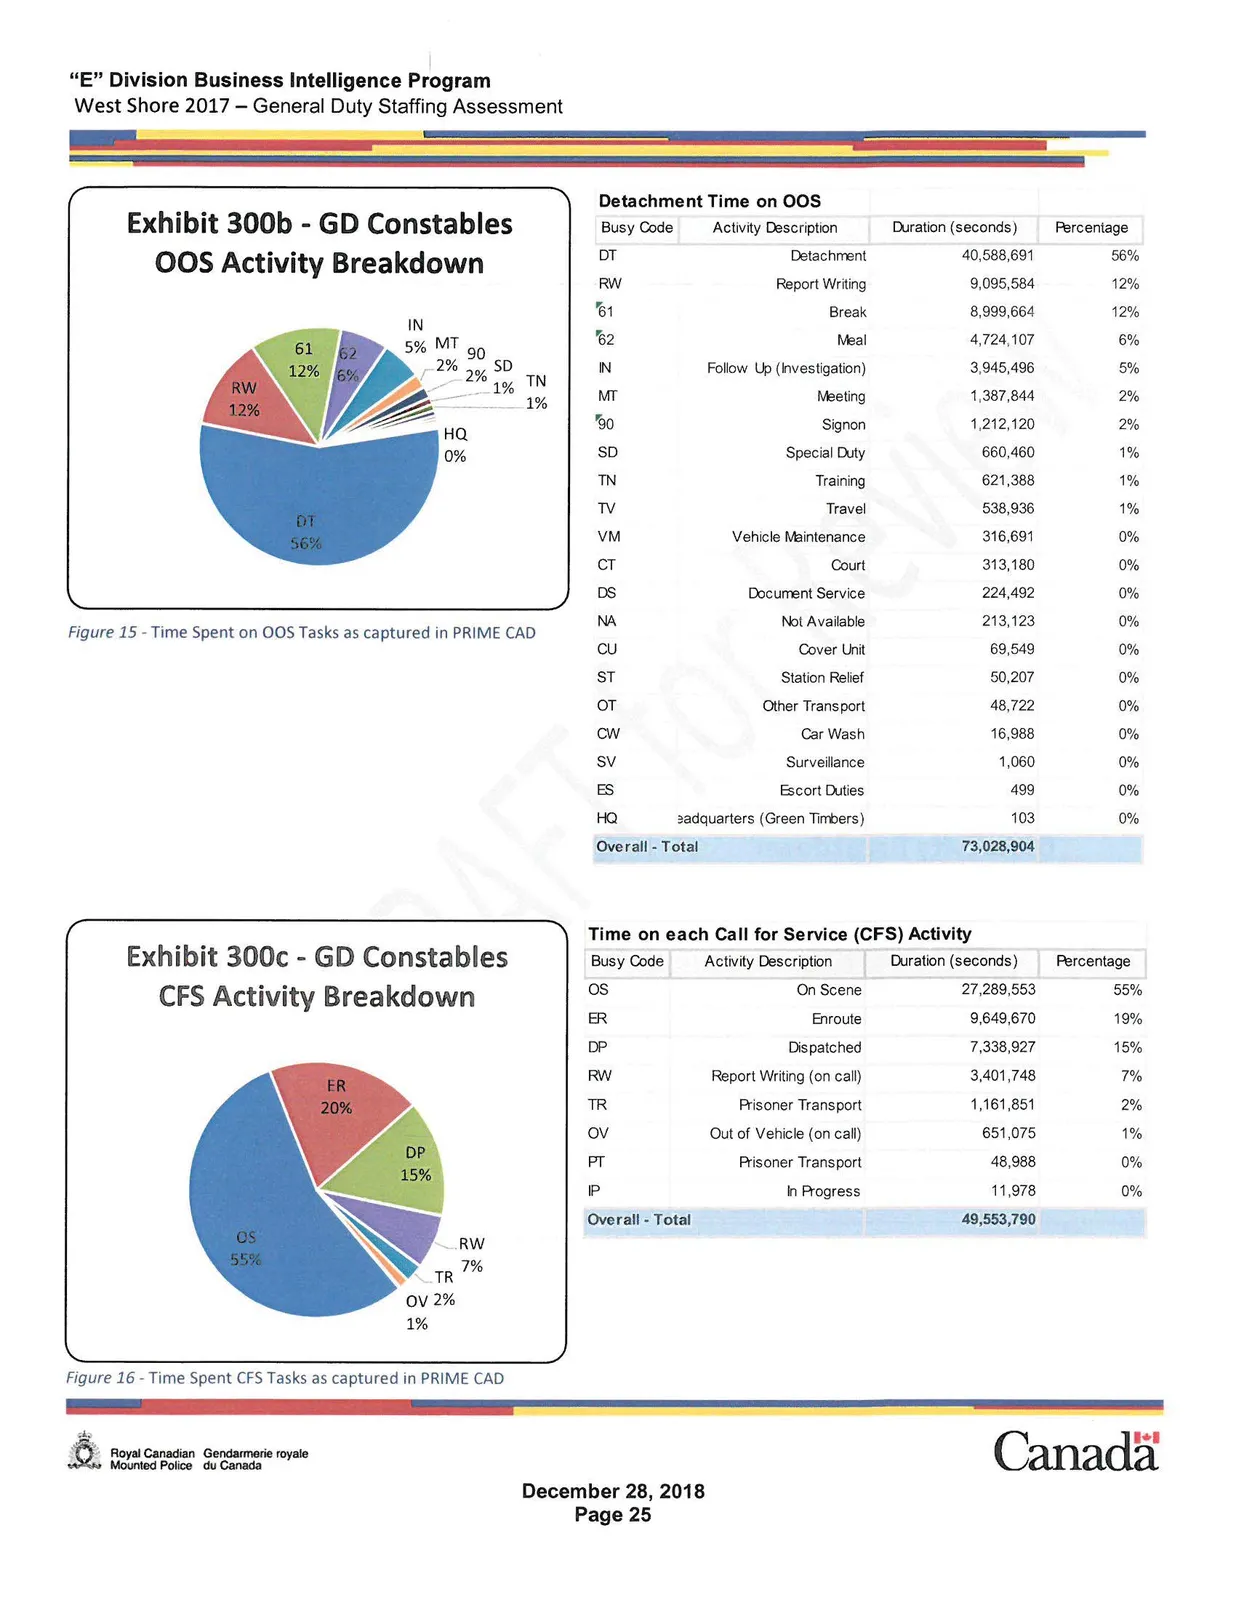
[Image 25a: Pie chart labeled Exhibit 300b - GD Constables OOS Activity Breakdown]
Figure 15 - Time Spent on OOS Tasks as captured in PRIME CAD
Detachment Time on OOS
| Busy Code | Activity Description | Duration (seconds) | Percentage |
|---|---|---|---|
| DT | Detachment | 40,588,691 | 56% |
| RW | Report Writing | 9,095,584 | 12% |
| 61 | Break | 8,999,664 | 12% |
| 62 | Meal | 4,724,107 | 6% |
| IN | Follow Up (Investigation) | 3,945,496 | 5% |
| MT | Meeting | 1,387,844 | 2% |
| 90 | Signon | 1,212,120 | 2% |
| SD | Special Duty | 660,460 | 1% |
| TN | Training | 621,388 | 1% |
| TV | Travel | 538,936 | 1% |
| VM | Vehicle Maintenance | 316,691 | 0% |
| CT | Court | 313,180 | 0% |
| DS | Document Service | 224,492 | 0% |
| NA | Not Available | 213,123 | 0% |
| CU | Cover Unit | 69,549 | 0% |
| ST | Station Relief | 50,207 | 0% |
| OT | Other Transport | 48,722 | 0% |
| CW | Car Wash | 16,988 | 0% |
| SV | Surveillance | 1,060 | 0% |
| ES | Escort Duties | 499 | 0% |
| HQ | Headquarters (Green Timbers) | 103 | 0% |
| Overall - Total | 73,028,904 |
[Image 25b: Pie chart labeled Exhibit 300c - GD Constables CFS Activity Breakdown]
Figure 16 - Time Spent CFS Tasks as captured in PRIME CAD
Time on each Call for Service (CFS) Activity
| Busy Code | Activity Description | Duration (seconds) | Percentage |
|---|---|---|---|
| OS | On Scene | 27,289,553 | 55% |
| ER | Enroute | 9,649,670 | 19% |
| DP | Dispatched | 7,338,927 | 15% |
| RW | Report Writing (on call) | 3,401,748 | 7% |
| TR | Prisoner Transport | 1,161,851 | 2% |
| OV | Out of Vehicle (on call) | 651,075 | 1% |
| PT | Prisoner Transport | 48,988 | 0% |
| IP | In Progress | 11,978 | 0% |
| Overall - Total | 49,553,790 |
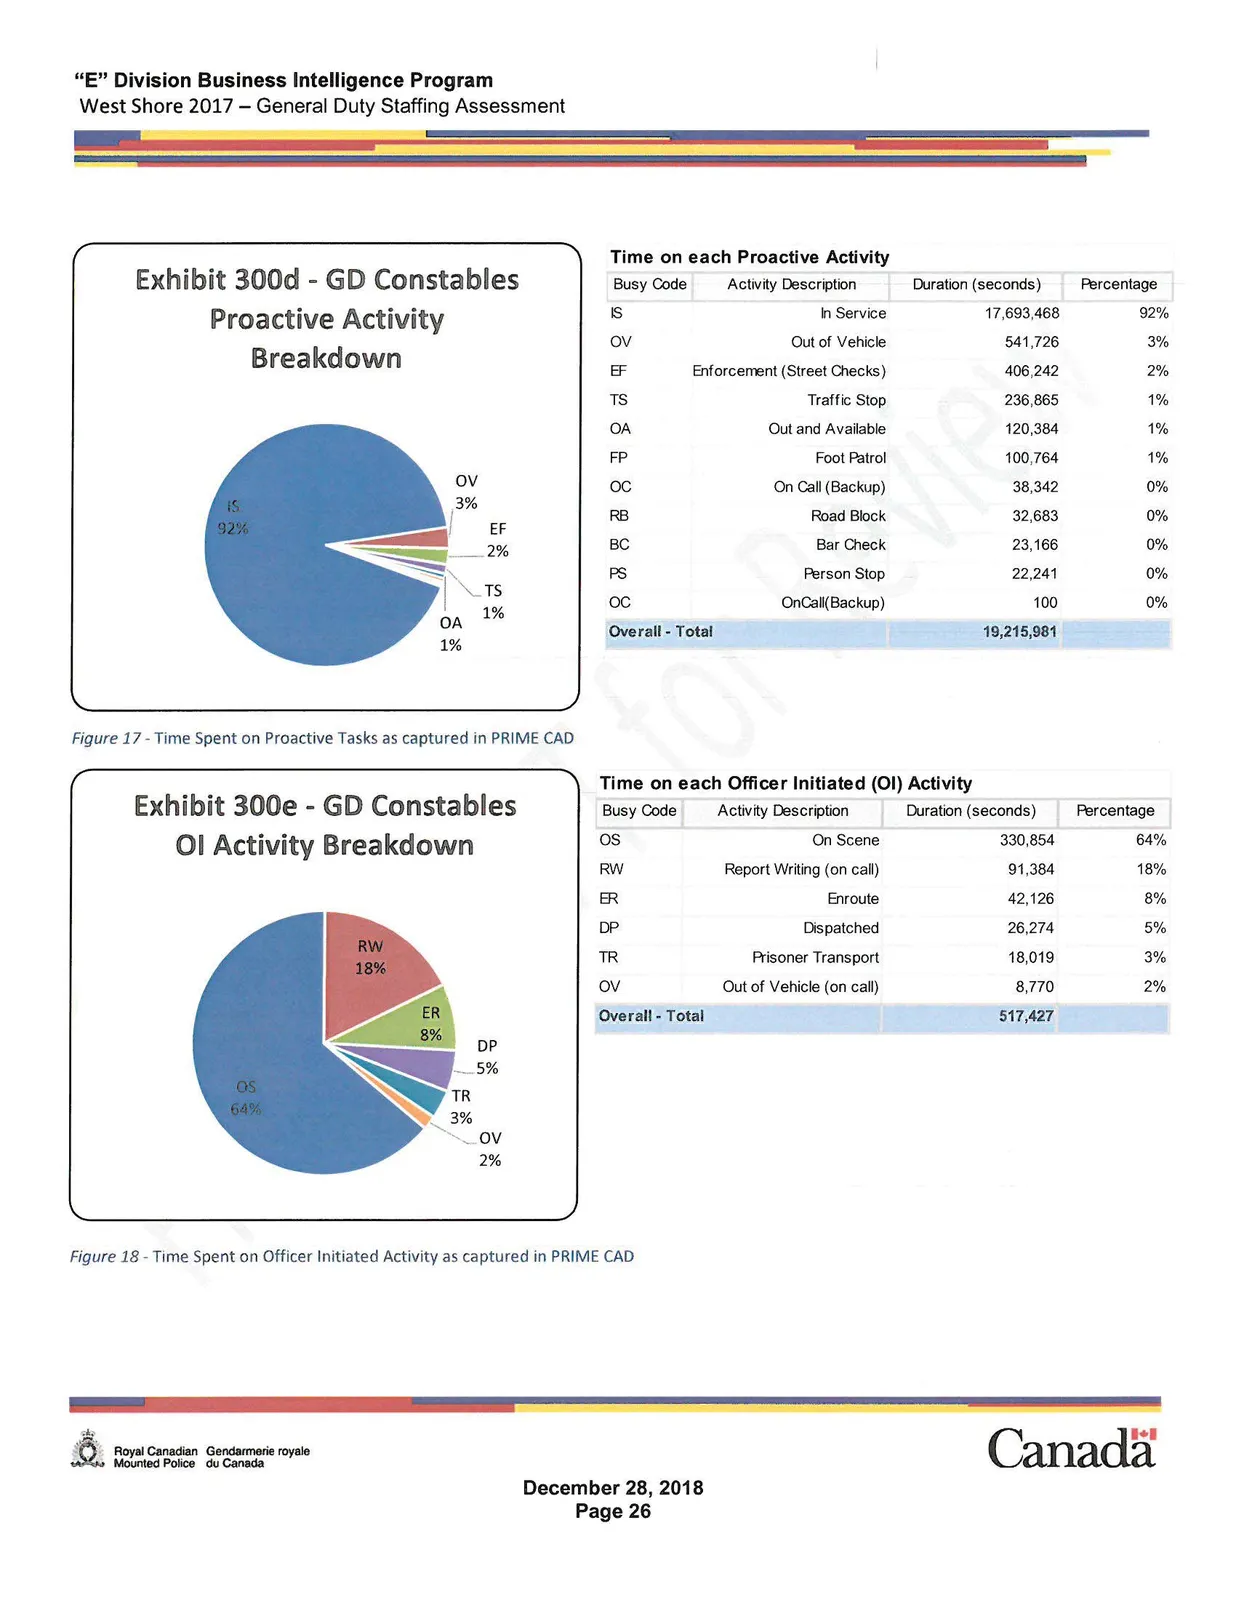
[Image 26a: Pie chart labeled Exhibit 300d - GD Constables Proactive Activity Breakdown]
Figure 17 - Time Spent on Proactive Tasks as captured in PRIME CAD
Time on each Proactive Activity
| Busy Code | Activity Description | Duration (seconds) | Percentage |
|---|---|---|---|
| IS | In Service | 17,693,468 | 92% |
| OV | Out of Vehicle | 541,726 | 3% |
| EF | Enforcement (Street Checks) | 406,242 | 2% |
| TS | Traffic Stop | 236,865 | 1% |
| OA | Out and Available | 120,384 | 1% |
| FP | Foot Patrol | 100,764 | 1% |
| OC | On Call (Backup) | 38,342 | 0% |
| RB | Road Block | 32,683 | 0% |
| BC | Bar Check | 23,166 | 0% |
| PS | Person Stop | 22,241 | 0% |
| OC | OnCall (Backup) | 100 | 0% |
| Overall - Total | 19,215,981 |
[Image 26b: Pie chart labeled Exhibit 300e - GD Constables OI Activity Breakdown]
Figure 18 - Time Spent on Officer Initiated Activity as captured in PRIME CAD
Time on each Officer Initiated (OI) Activity
| Busy Code | Activity Description | Duration (seconds) | Percentage |
|---|---|---|---|
| OS | On Scene | 330,854 | 64% |
| RW | Report Writing (on call) | 91,384 | 18% |
| ER | Enroute | 42,126 | 8% |
| DP | Dispatched | 26,274 | 5% |
| TR | Prisoner Transport | 18,019 | 3% |
| OV | Out of Vehicle (on call) | 8,770 | 2% |
| Overall - Total | 517,427 |
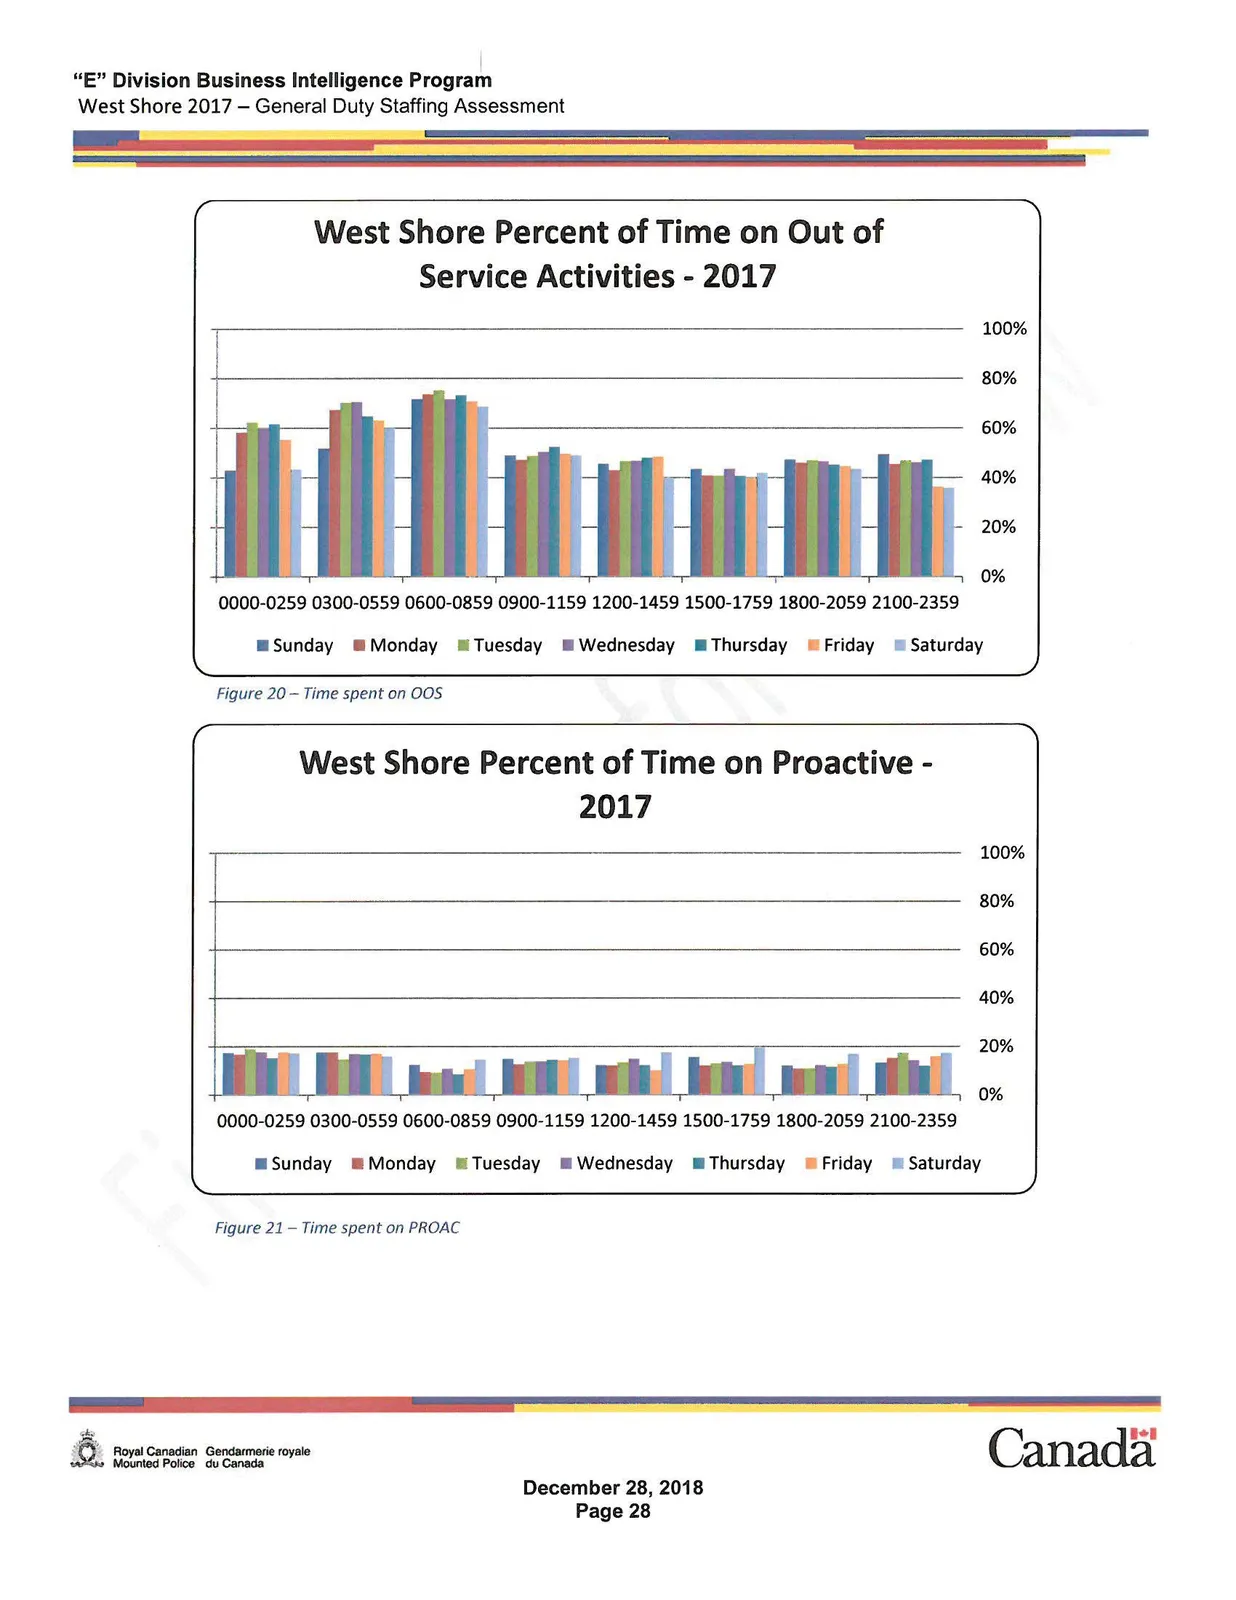
The next three bar charts show the percent of time (as determined by the MPP model) that GD Constable spend on Calls for Service, Proactive, and Out of Service work by three-hour time blocks and day of week. The time spent on CFS and available proactive time has opposite trends — CFS work is higher from 0900 to 1800, whereas proactive work is higher from midnight until 0900. Out of service work is more consistent from time block to time block. The Officer Activity Reports, used to monitor data quality, only capture the activities of General Duty Constables.
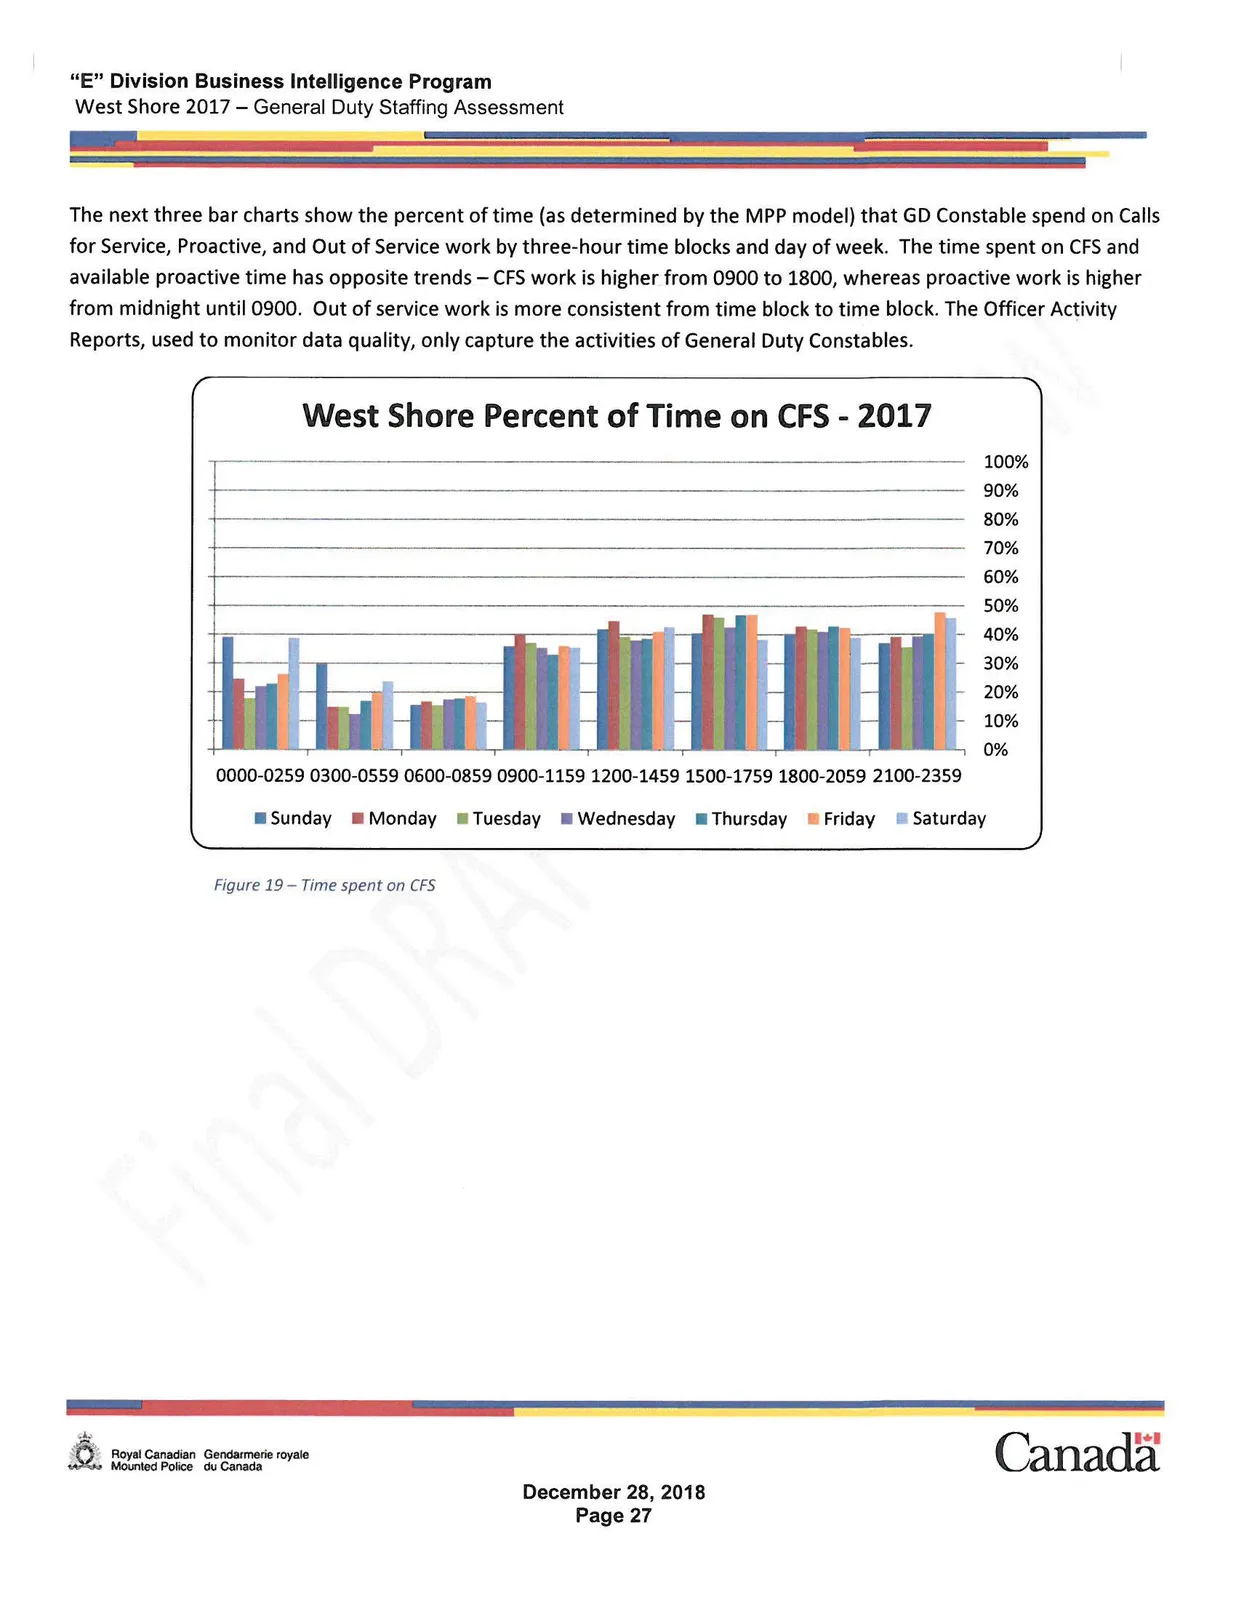
Figure 19 – Time spent on CFS
[Image 28a: Bar chart showing West Shore Percent of Time on Out of Service Activities - 2017 for various time blocks and days of the week]
Figure 20 – Time spent on OOS
[Image 28b: Bar chart showing West Shore Percent of Time on Proactive - 2017 for various time blocks and days of the week]
Figure 21 – Time spent on PROAC
Service Time
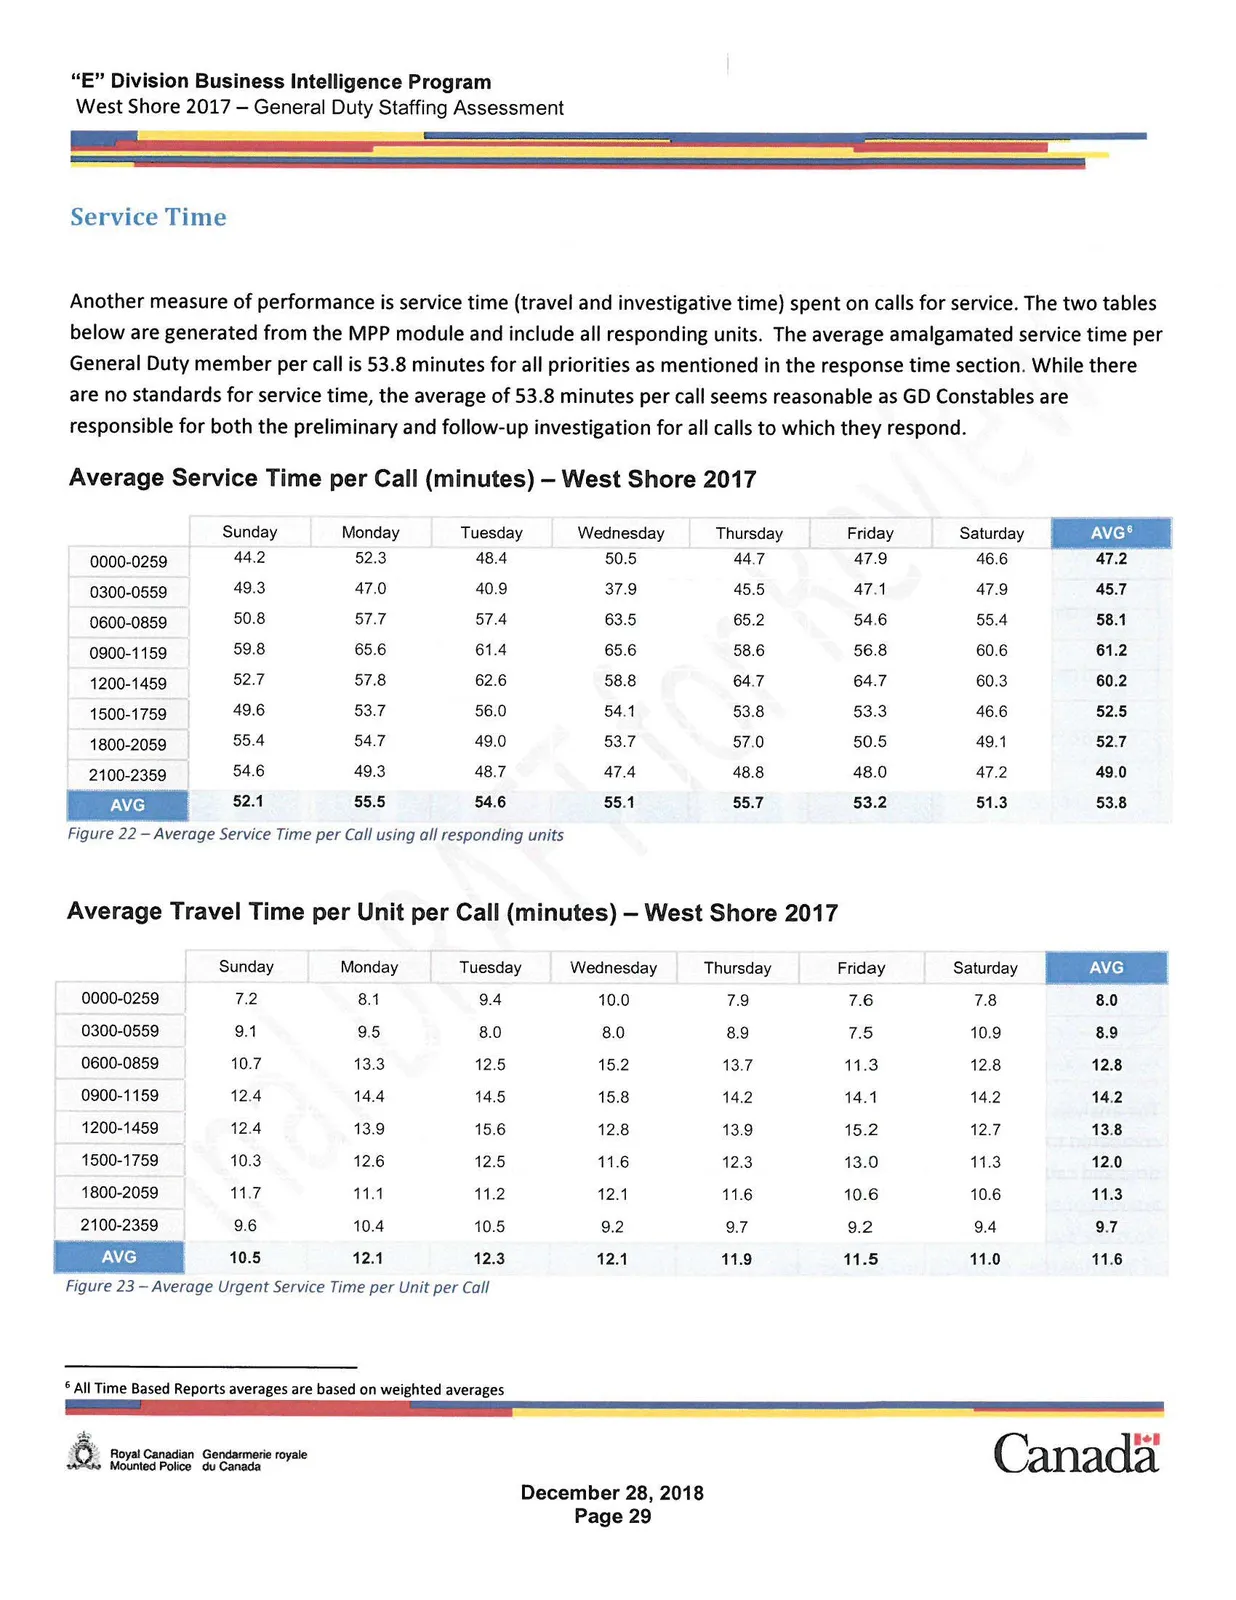
Another measure of performance is service time (travel and investigative time) spent on calls for service. The two tables below are generated from the MPP module and include all responding units. The average amalgamated service time per General Duty member per call is 53.8 minutes for all priorities as mentioned in the response time section. While there are no standards for service time, the average of 53.8 minutes per call seems reasonable as GD Constables are responsible for both the preliminary and follow-up investigation for all calls to which they respond.
Average Service Time per Call (minutes) — West Shore 2017
| Sunday | Monday | Tuesday | Wednesday | Thursday | Friday | Saturday | AVG⁶ | |
|---|---|---|---|---|---|---|---|---|
| 0000-0259 | 44.2 | 52.3 | 48.4 | 50.5 | 44.7 | 47.9 | 46.6 | 47.2 |
| 0300-0559 | 49.3 | 47.0 | 40.9 | 37.9 | 45.5 | 47.1 | 47.9 | 45.7 |
| 0600-0859 | 50.8 | 57.7 | 57.4 | 63.5 | 65.2 | 54.6 | 55.4 | 58.1 |
| 0900-1159 | 59.8 | 65.6 | 61.4 | 65.6 | 58.6 | 56.8 | 60.6 | 61.2 |
| 1200-1459 | 52.7 | 57.8 | 62.6 | 58.8 | 64.7 | 64.7 | 60.3 | 60.2 |
| 1500-1759 | 49.6 | 53.7 | 56.0 | 54.1 | 53.8 | 53.3 | 46.6 | 52.5 |
| 1800-2059 | 55.4 | 54.7 | 49.0 | 53.7 | 57.0 | 50.5 | 49.1 | 52.7 |
| 2100-2359 | 54.6 | 49.3 | 48.7 | 47.4 | 48.8 | 48.0 | 47.2 | 49.0 |
| AVG | 52.1 | 55.5 | 54.6 | 55.1 | 55.7 | 53.2 | 51.3 | 53.8 |
Figure 22 – Average Service Time per Call using all responding units
Average Travel Time per Unit per Call (minutes) — West Shore 2017
| Sunday | Monday | Tuesday | Wednesday | Thursday | Friday | Saturday | AVG | |
|---|---|---|---|---|---|---|---|---|
| 0000-0259 | 7.2 | 8.1 | 9.4 | 10.0 | 7.9 | 7.6 | 7.8 | 8.0 |
| 0300-0559 | 9.1 | 9.5 | 8.0 | 8.0 | 8.9 | 7.5 | 10.9 | 8.9 |
| 0600-0859 | 10.7 | 13.3 | 12.5 | 15.2 | 13.7 | 11.3 | 12.8 | 12.8 |
| 0900-1159 | 12.4 | 14.4 | 14.5 | 15.8 | 14.2 | 14.1 | 14.2 | 14.2 |
| 1200-1459 | 12.4 | 13.9 | 15.6 | 12.8 | 13.9 | 15.2 | 12.7 | 13.8 |
| 1500-1759 | 10.3 | 12.6 | 12.5 | 11.6 | 12.3 | 13.0 | 11.3 | 12.0 |
| 1800-2059 | 11.7 | 11.1 | 11.2 | 12.1 | 11.6 | 10.6 | 10.6 | 11.3 |
| 2100-2359 | 9.6 | 10.4 | 10.5 | 9.2 | 9.7 | 9.2 | 9.4 | 9.7 |
| AVG | 10.5 | 12.1 | 12.3 | 12.1 | 11.9 | 11.5 | 11.0 | 11.6 |
Figure 23 – Average Urgent Service Time per Unit per Call
⁶ All Time Based Reports averages are based on weighted averages
The Service Time information below indicates, in minutes, the response time as well as the total service time spent on the various call types in 2017 for GD Constable. The call type with highest service time is Traffic Incident at 61,553 minutes closely followed by Assist Police/Fire/Ambulance with 57,977 minutes, MVI at 48,079 minutes, and Disturbances at 47,321 minutes. See Appendix G for a breakdown of total service time by call type.
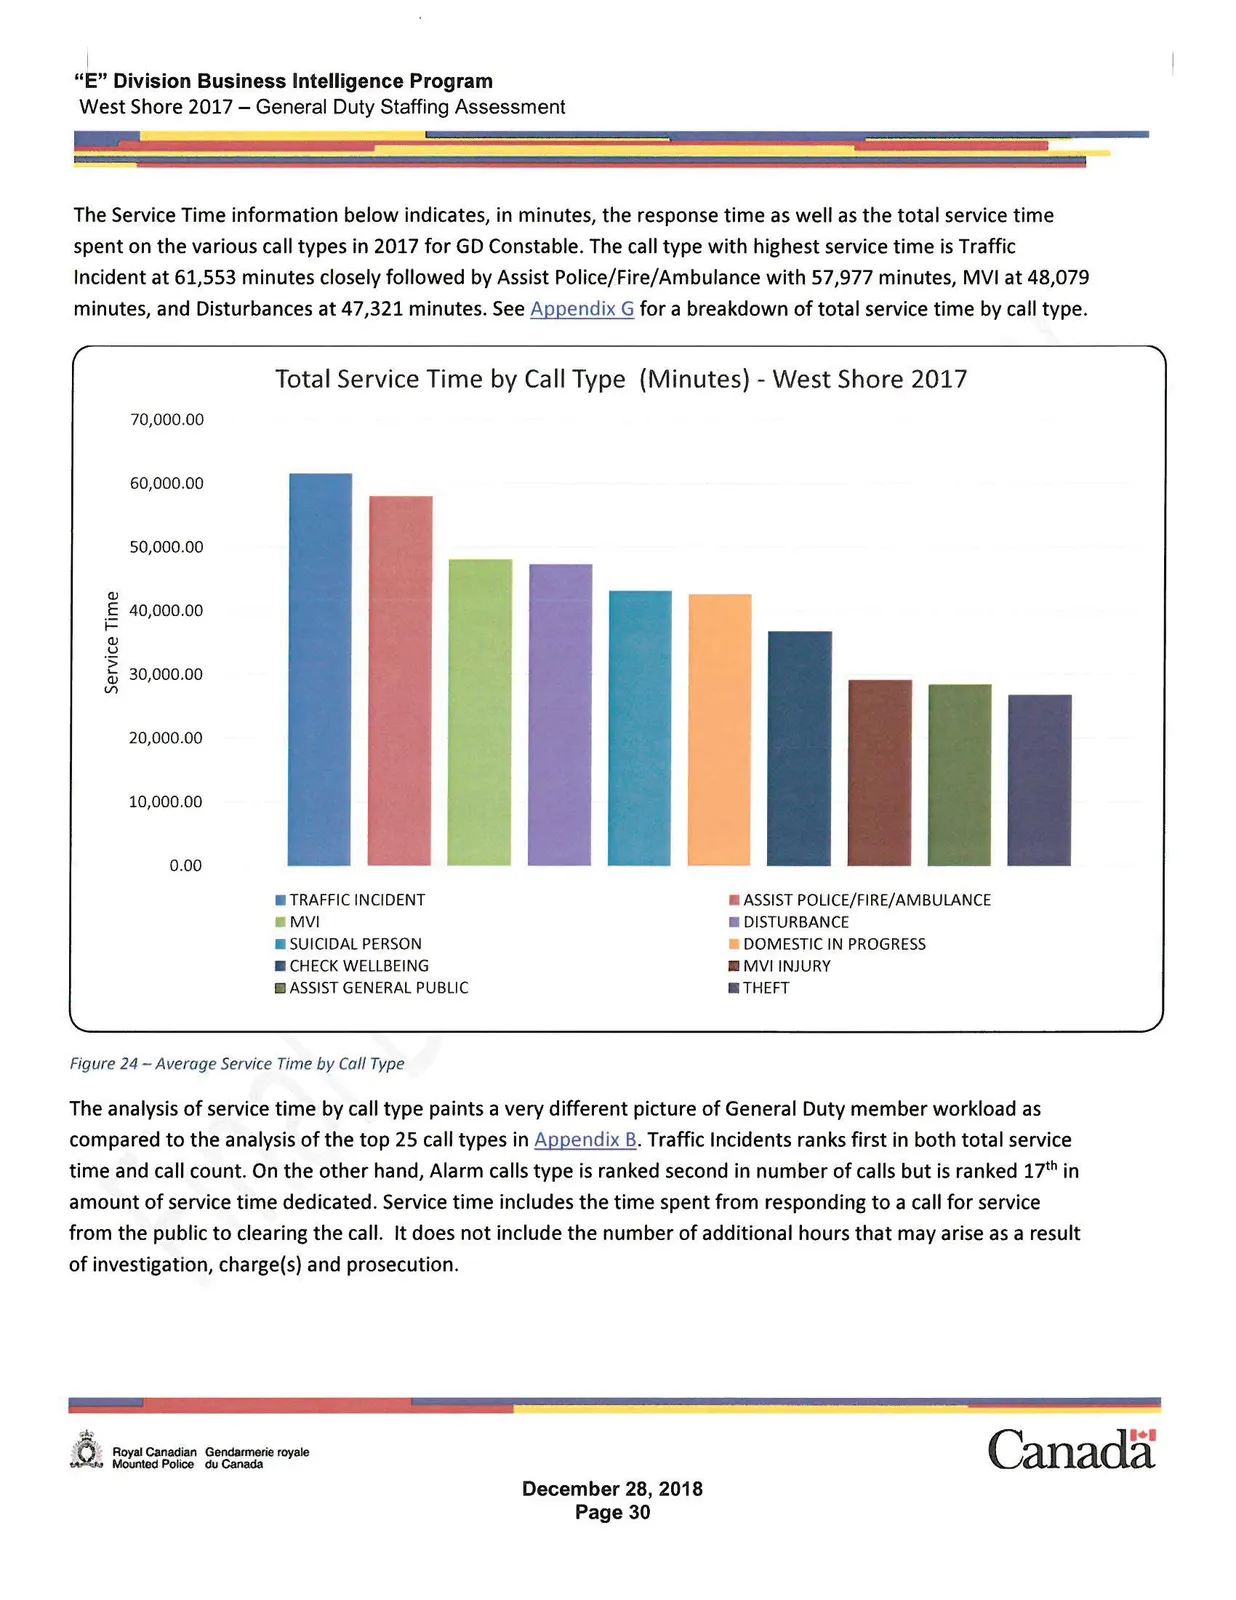
Figure 24 – Average Service Time by Call Type
The analysis of service time by call type paints a very different picture of General Duty member workload as compared to the analysis of the top 25 call types in Appendix B. Traffic Incidents ranks first in both total service time and call count. On the other hand, Alarm calls type is ranked second in number of calls but is ranked 17th in amount of service time dedicated. Service time includes the time spent from responding to a call for service from the public to clearing the call. It does not include the number of additional hours that may arise as a result of investigation, charge(s) and prosecution.
Staffing Needs
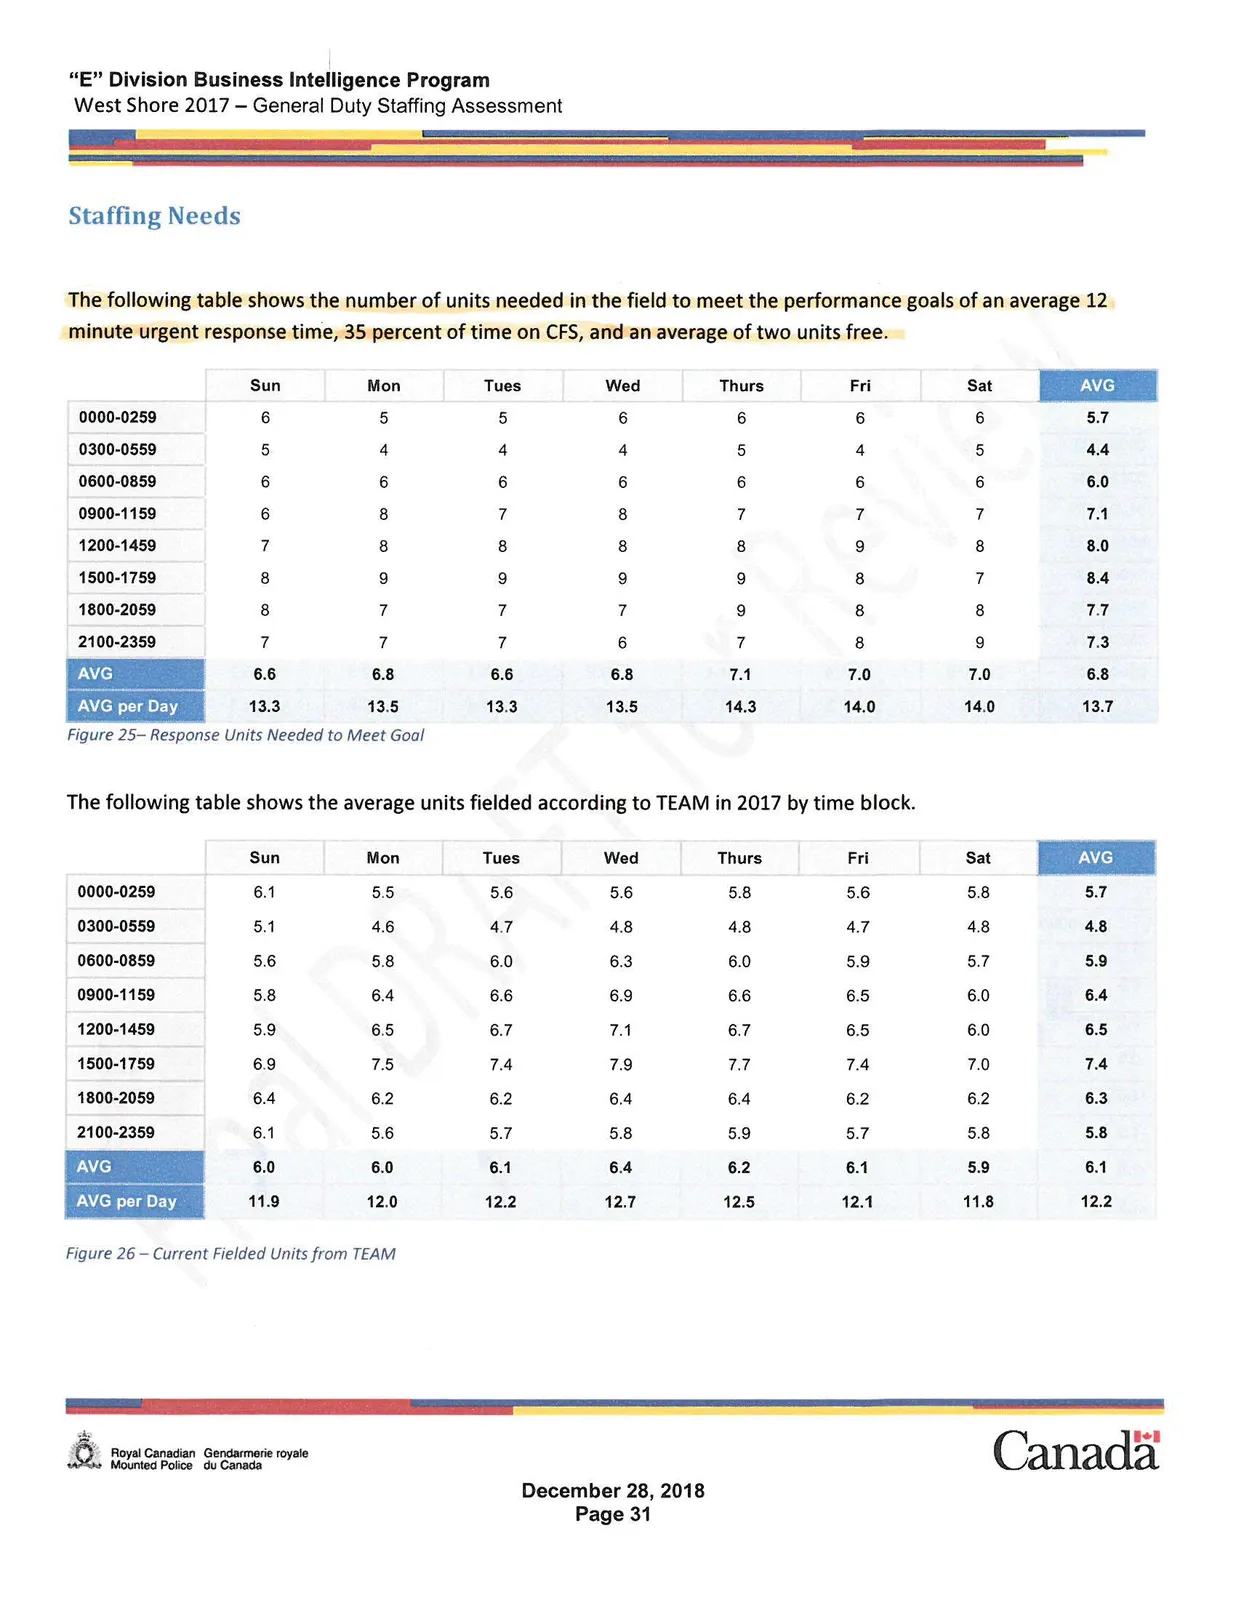
The following table shows the number of units needed in the field to meet the performance goals of an average 12 minute urgent response time, 35 percent of time on CFS, and an average of two units free.
| Sun | Mon | Tues | Wed | Thurs | Fri | Sat | AVG | |
|---|---|---|---|---|---|---|---|---|
| 0000-0259 | 6 | 5 | 5 | 6 | 6 | 6 | 6 | 5.7 |
| 0300-0559 | 5 | 4 | 4 | 4 | 5 | 4 | 5 | 4.4 |
| 0600-0859 | 6 | 6 | 6 | 6 | 6 | 6 | 6 | 6.0 |
| 0900-1159 | 6 | 8 | 7 | 8 | 7 | 7 | 7 | 7.1 |
| 1200-1459 | 7 | 8 | 8 | 8 | 8 | 9 | 8 | 8.0 |
| 1500-1759 | 8 | 9 | 9 | 9 | 9 | 8 | 7 | 8.4 |
| 1800-2059 | 8 | 7 | 7 | 7 | 9 | 8 | 8 | 7.7 |
| 2100-2359 | 7 | 7 | 7 | 6 | 7 | 8 | 9 | 7.3 |
| AVG | 6.6 | 6.8 | 6.6 | 6.8 | 7.1 | 7.0 | 7.0 | 6.8 |
| AVG per Day | 13.3 | 13.5 | 13.3 | 13.5 | 14.3 | 14.0 | 14.0 | 13.7 |
Figure 25– Response Units Needed to Meet Goal
The following table shows the average units fielded according to TEAM in 2017 by time block.
| Sun | Mon | Tues | Wed | Thurs | Fri | Sat | AVG | |
|---|---|---|---|---|---|---|---|---|
| 0000-0259 | 6.1 | 5.5 | 5.6 | 5.6 | 5.8 | 5.6 | 5.8 | 5.7 |
| 0300-0559 | 5.1 | 4.6 | 4.7 | 4.8 | 4.8 | 4.7 | 4.8 | 4.8 |
| 0600-0859 | 5.6 | 5.8 | 6.0 | 6.3 | 6.0 | 5.9 | 5.7 | 5.9 |
| 0900-1159 | 5.8 | 6.4 | 6.6 | 6.9 | 6.6 | 6.5 | 6.0 | 6.4 |
| 1200-1459 | 5.9 | 6.5 | 6.7 | 7.1 | 6.7 | 6.5 | 6.0 | 6.5 |
| 1500-1759 | 6.9 | 7.5 | 7.4 | 7.9 | 7.7 | 7.4 | 7.0 | 7.4 |
| 1800-2059 | 6.4 | 6.2 | 6.2 | 6.4 | 6.4 | 6.2 | 6.2 | 6.3 |
| 2100-2359 | 6.1 | 5.6 | 5.7 | 5.8 | 5.9 | 5.7 | 5.8 | 5.8 |
| AVG | 6.0 | 6.0 | 6.1 | 6.4 | 6.2 | 6.1 | 5.9 | 6.1 |
| AVG per Day | 11.9 | 12.0 | 12.2 | 12.7 | 12.5 | 12.1 | 11.8 | 12.2 |
Figure 26 – Current Fielded Units from TEAM
The number of units needed in order to meet the combined performance measures is compared with the average units fielded in a given time block as entered in the TEAM Shift Schedule module (cadets and acting Cpls are removed). The determination is then made as to whether the detachment has a shortage (underage) or abundance (overage) of units in any of the time blocks examined. This data is represented in the following tables and associated graph.
Overage (+) and Underage (-) — West Shore 2017
| Sun | Mon | Tues | Wed | Thurs | Fri | Sat | AVG | |
|---|---|---|---|---|---|---|---|---|
| 0000-0259 | 0.1 | 0.5 | 0.6 | -0.4 | -0.2 | -0.4 | -0.3 | 0.0 |
| 0300-0559 | 0.1 | 0.6 | 0.7 | 0.8 | -0.2 | 0.7 | -0.2 | 0.4 |
| 0600-0859 | -0.5 | -0.2 | 0.0 | 0.3 | 0.0 | -0.1 | -0.3 | -0.1 |
| 0900-1159 | -0.2 | -1.6 | -0.4 | -1.1 | -0.4 | -0.5 | -1.0 | -0.7 |
| 1200-1459 | -1.1 | -1.5 | -1.3 | -0.9 | -1.3 | -2.5 | -2.0 | -1.5 |
| 1500-1759 | -1.1 | -1.5 | -1.6 | -1.1 | -1.3 | -0.6 | 0.0 | -1.0 |
| 1800-2059 | -1.6 | -0.8 | -0.9 | -0.6 | -2.6 | -1.8 | -1.8 | -1.4 |
| 2100-2359 | -0.9 | -1.4 | -1.4 | -0.2 | -1.1 | -2.3 | -3.2 | -1.5 |
| AVG | -0.7 | -0.7 | -0.5 | -0.4 | -0.9 | -0.9 | -1.1 | -0.7 |
| AVG per Day | -1.3 | -1.5 | -1.0 | -0.8 | -1.8 | -1.9 | -2.2 | -1.5 |
Figure 27 – Overage and Underage Table
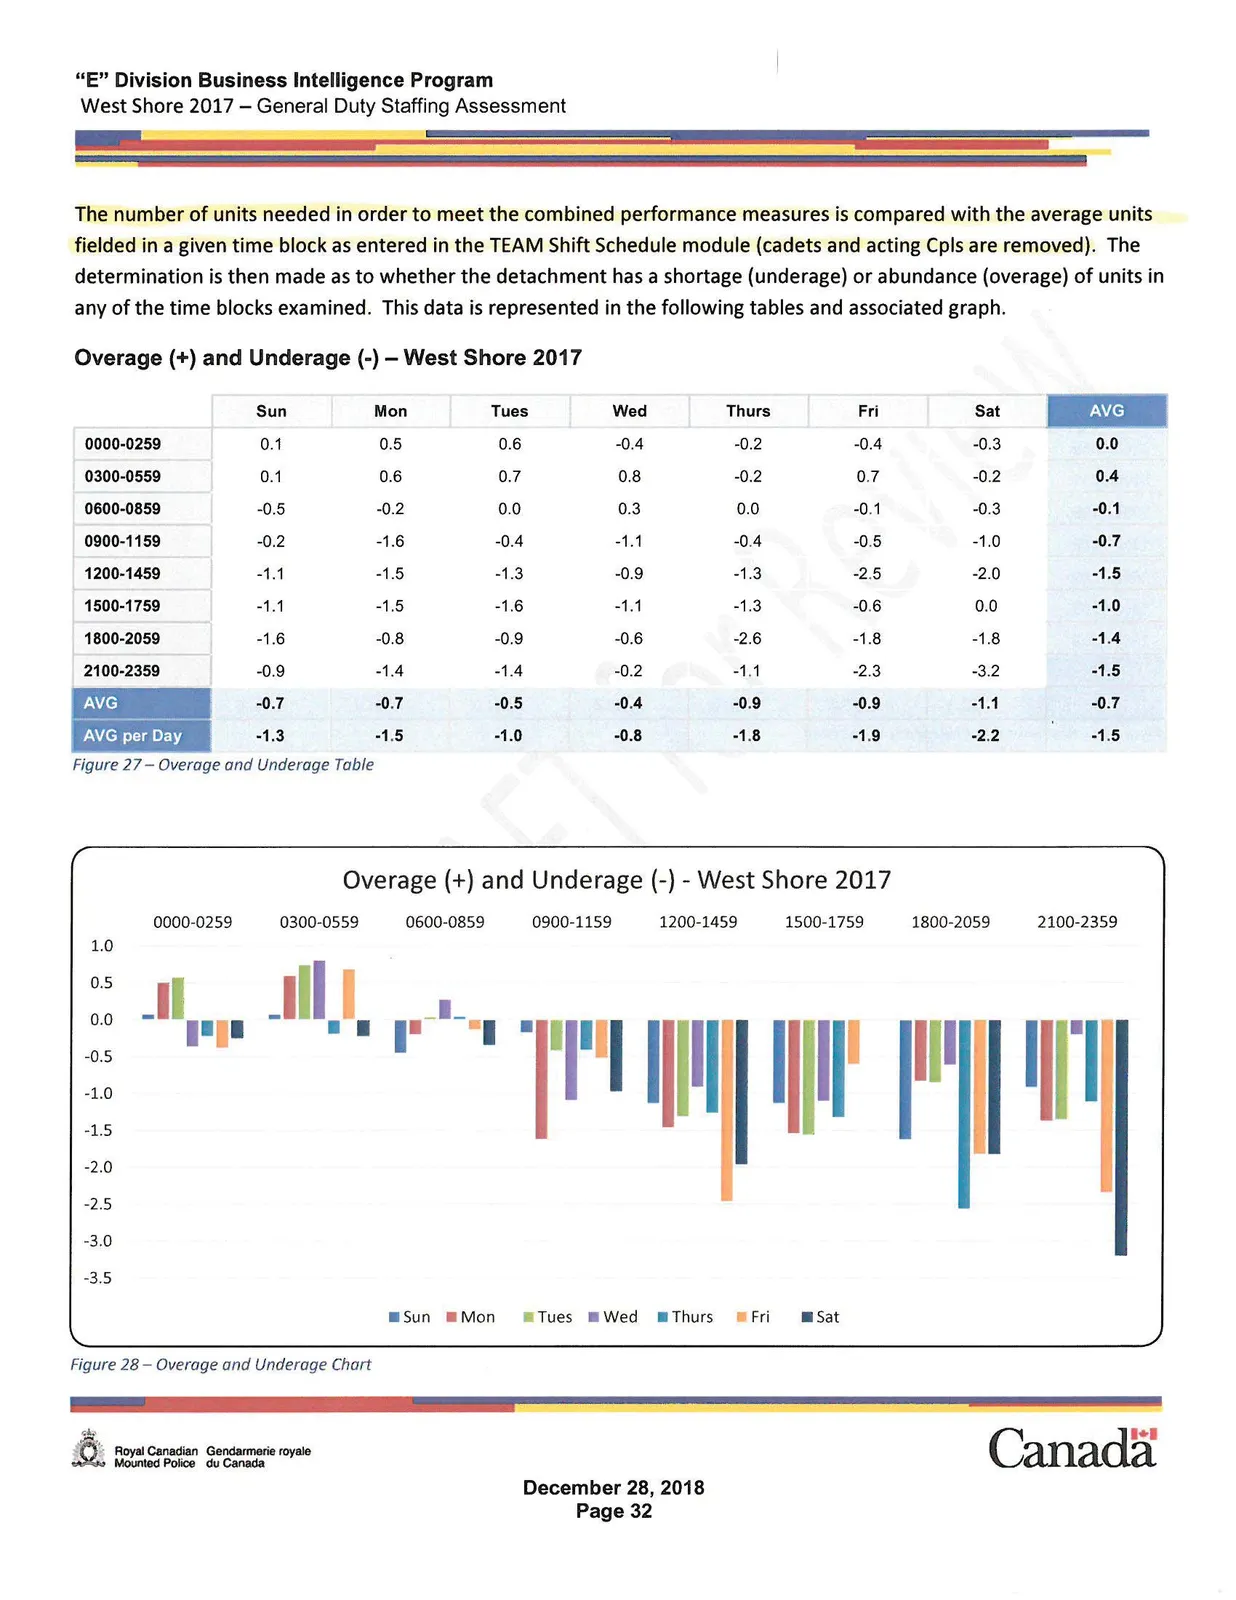
Figure 28 – Overage and Underage Chart
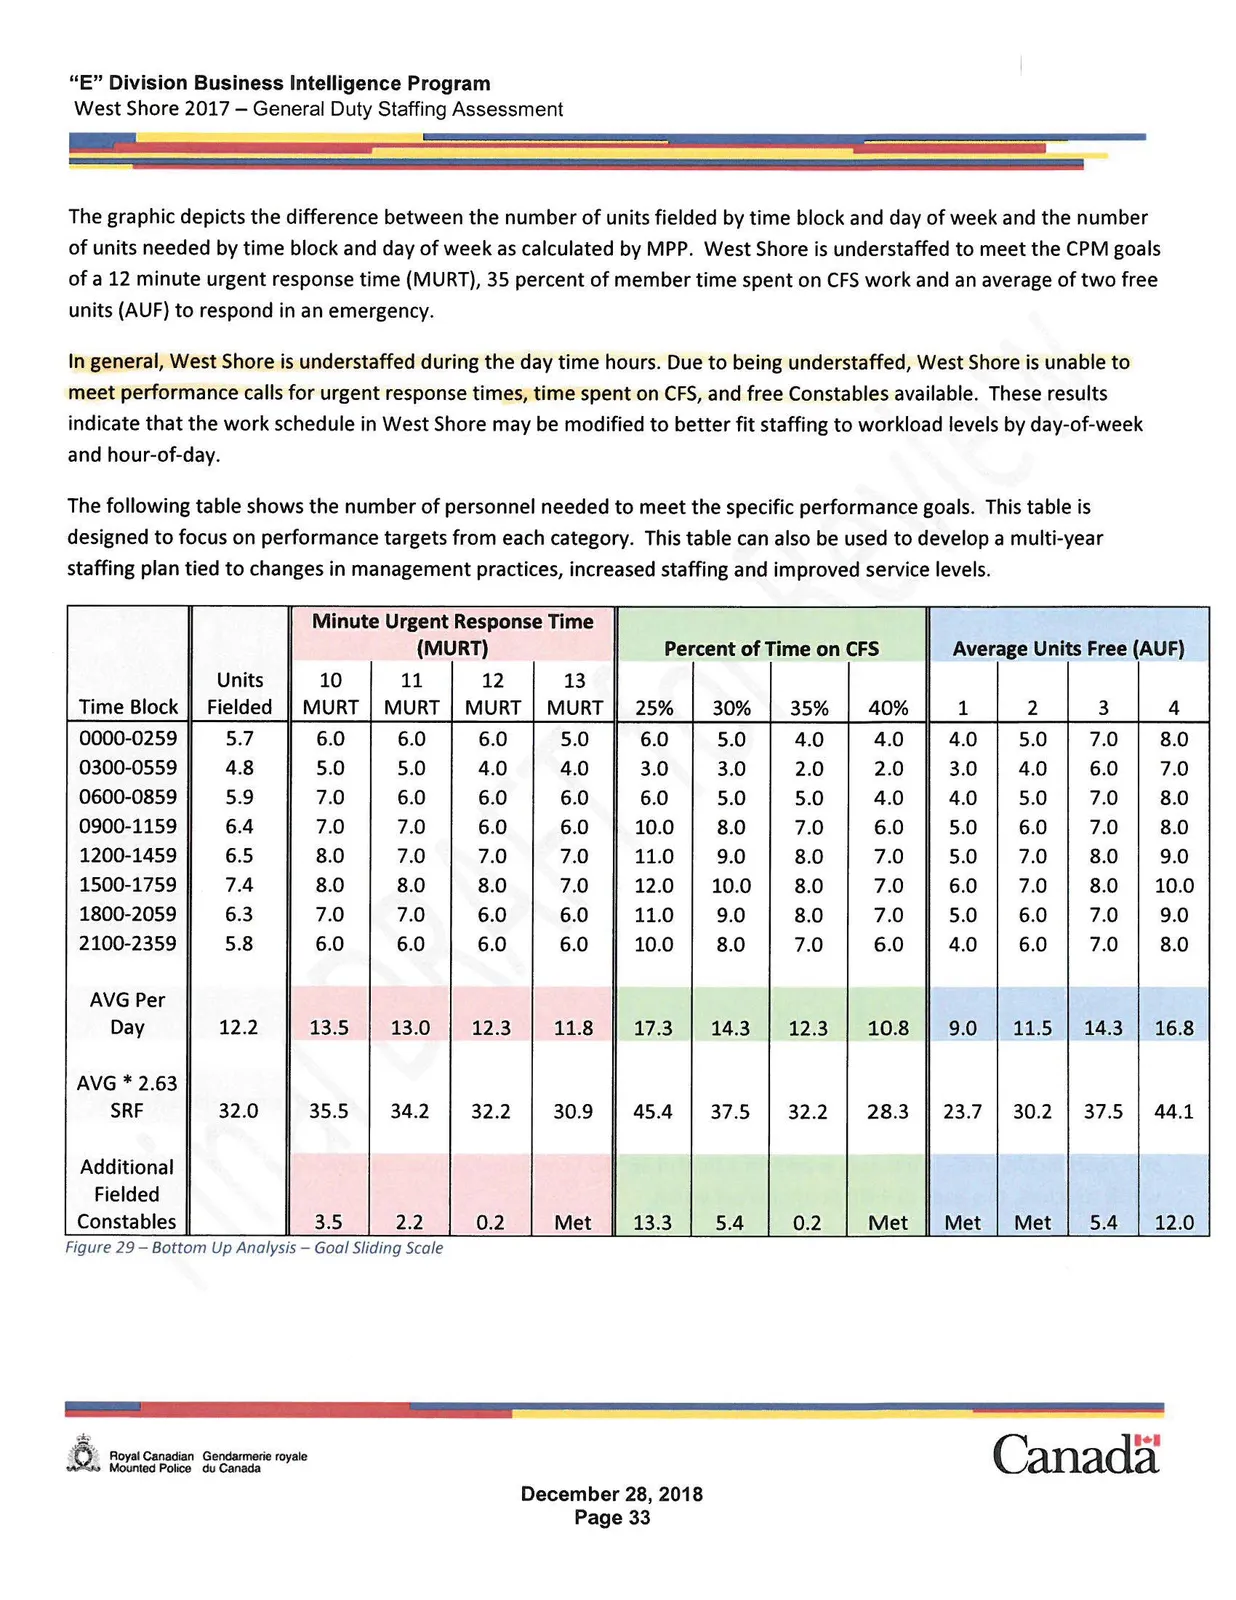
The graphic depicts the difference between the number of units fielded by time block and day of week and the number of units needed by time block and day of week as calculated by MPP. West Shore is understaffed to meet the CPM goals of a 12 minute urgent response time (MURT), 35 percent of member time spent on CFS work and an average of two free units (AUF) to respond in an emergency.
In general, West Shore is understaffed during the day time hours. Due to being understaffed, West Shore is unable to meet performance calls for urgent response times, time spent on CFS, and free Constables available. These results indicate that the work schedule in West Shore may be modified to better fit staffing to workload levels by day-of-week and hour-of-day.
The following table shows the number of personnel needed to meet the specific performance goals. This table is designed to focus on performance targets from each category. This table can also be used to develop a multi-year staffing plan tied to changes in management practices, increased staffing and improved service levels.
Figure 29 – Bottom Up Analysis — Goal Sliding Scale
| | | Minute Urgent Response Time (MURT) | Percent of Time on CFS | Average Units Free (AUF) | | :--- | :---: | :---: | :---: | :---: | :---: | :---: | :---: | :---: | :---: | :---: | :---: | :---: | :---: | | Time Block | Units Fielded | 10 MURT | 11 MURT | 12 MURT | 13 MURT | 25% | 30% | 35% | 40% | 1 | 2 | 3 | 4 | | 0000-0259 | 5.7 | 6.0 | 6.0 | 6.0 | 5.0 | 6.0 | 5.0 | 4.0 | 4.0 | 4.0 | 5.0 | 7.0 | 8.0 | | 0300-0559 | 4.8 | 5.0 | 5.0 | 4.0 | 4.0 | 3.0 | 3.0 | 2.0 | 2.0 | 3.0 | 4.0 | 6.0 | 7.0 | | 0600-0859 | 5.9 | 7.0 | 6.0 | 6.0 | 6.0 | 6.0 | 5.0 | 5.0 | 4.0 | 4.0 | 5.0 | 7.0 | 8.0 | | 0900-1159 | 6.4 | 7.0 | 7.0 | 6.0 | 6.0 | 10.0 | 8.0 | 7.0 | 6.0 | 5.0 | 6.0 | 7.0 | 8.0 | | 1200-1459 | 6.5 | 8.0 | 7.0 | 7.0 | 7.0 | 11.0 | 9.0 | 8.0 | 7.0 | 5.0 | 7.0 | 8.0 | 9.0 | | 1500-1759 | 7.4 | 8.0 | 8.0 | 8.0 | 7.0 | 12.0 | 10.0 | 8.0 | 7.0 | 6.0 | 7.0 | 8.0 | 10.0 | | 1800-2059 | 6.3 | 7.0 | 7.0 | 6.0 | 6.0 | 11.0 | 9.0 | 8.0 | 7.0 | 5.0 | 6.0 | 7.0 | 9.0 | | 2100-2359 | 5.8 | 6.0 | 6.0 | 6.0 | 6.0 | 10.0 | 8.0 | 7.0 | 6.0 | 4.0 | 6.0 | 7.0 | 8.0 | | AVG Per Day | 12.2 | 13.5 | 13.0 | 12.3 | 11.8 | 17.3 | 14.3 | 12.3 | 10.8 | 9.0 | 11.5 | 14.3 | 16.8 | | AVG * 2.63 SRF | 32.0 | 35.5 | 34.2 | 32.2 | 30.9 | 45.4 | 37.5 | 32.2 | 28.3 | 23.7 | 30.2 | 37.5 | 44.1 | | Additional Fielded Constables | | 3.5 | 2.2 | 0.2 | Met | 13.3 | 5.4 | 0.2 | Met | Met | Met | 5.4 | 12.0 |
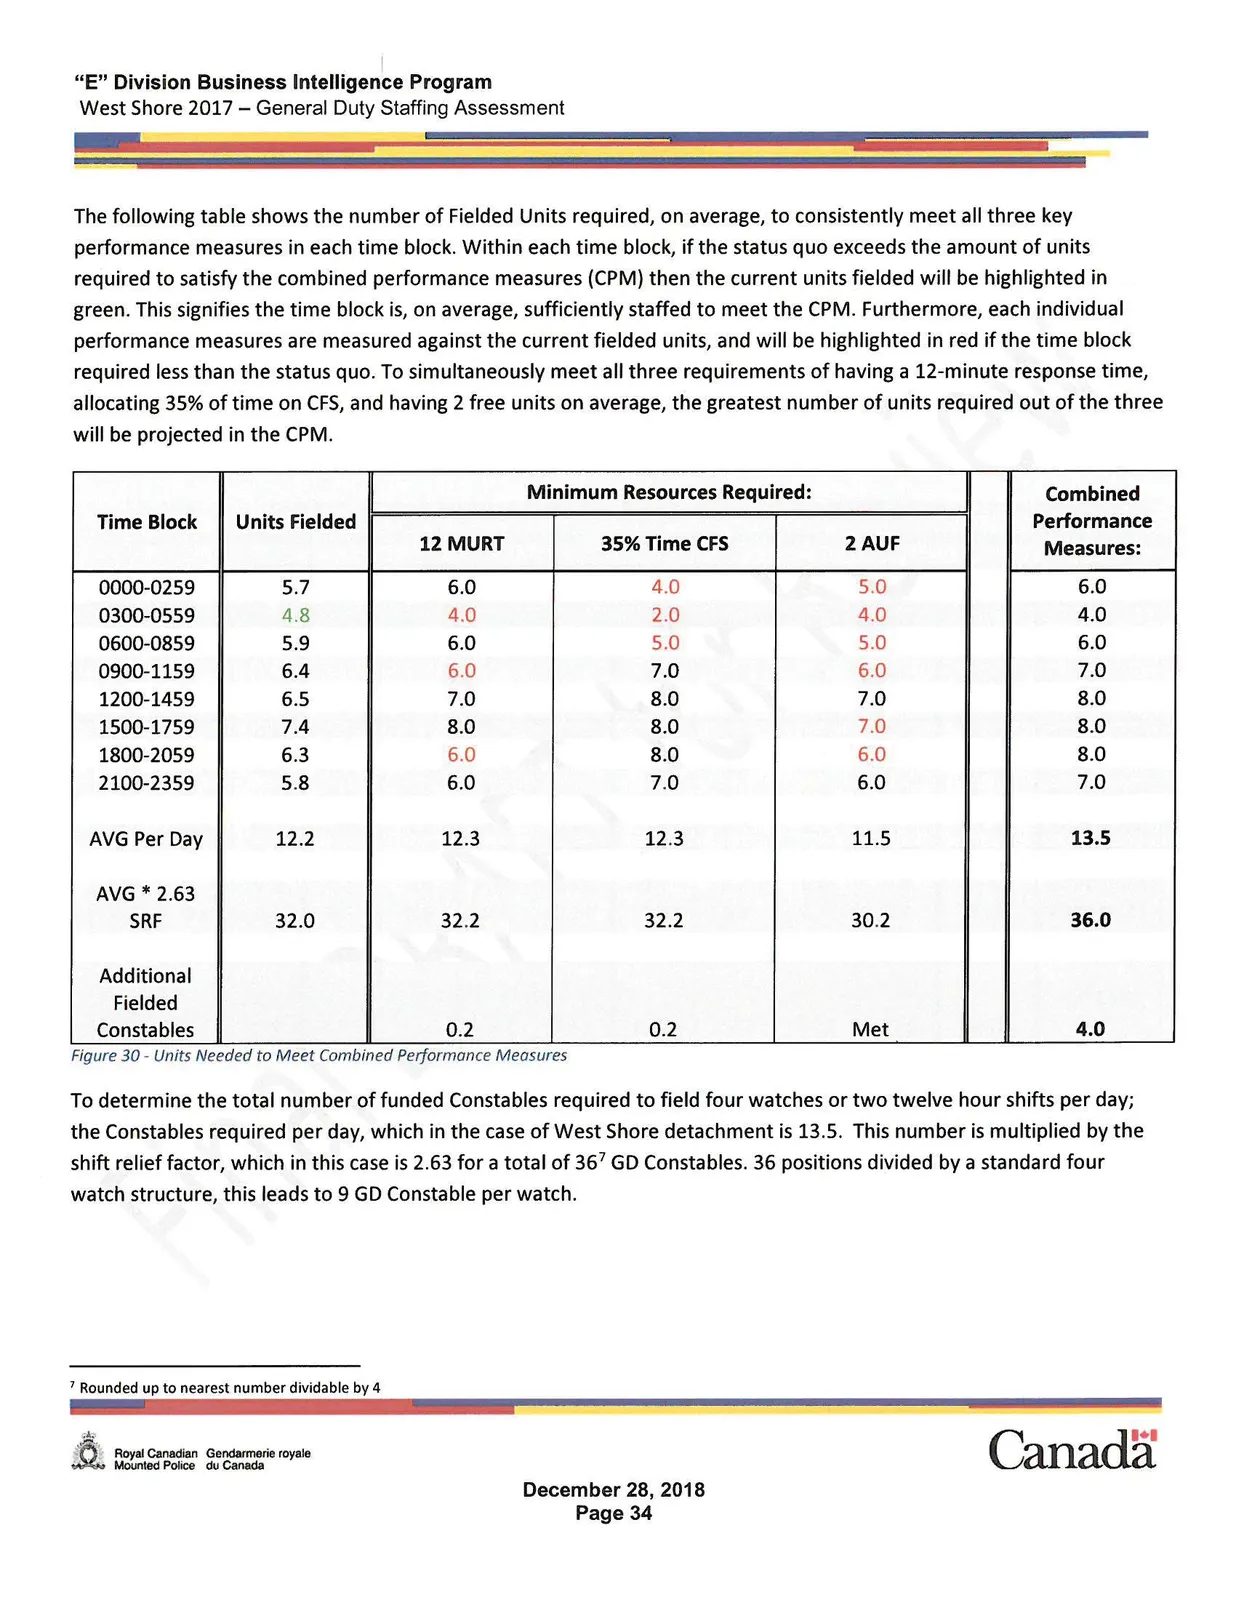
The following table shows the number of Fielded Units required, on average, to consistently meet all three key performance measures in each time block. Within each time block, if the status quo exceeds the amount of units required to satisfy the combined performance measures (CPM) then the current units fielded will be highlighted in green. This signifies the time block is, on average, sufficiently staffed to meet the CPM. Furthermore, each individual performance measures are measured against the current fielded units, and will be highlighted in red if the time block required less than the status quo. To simultaneously meet all three requirements of having a 12-minute response time, allocating 35% of time on CFS, and having 2 free units on average, the greatest number of units required out of the three will be projected in the CPM.
Figure 30 - Units Needed to Meet Combined Performance Measures
| Time Block | Units Fielded | Minimum Resources Required: 12 MURT | Minimum Resources Required: 35% Time CFS | Minimum Resources Required: 2 AUF | Combined Performance Measures: |
|---|---|---|---|---|---|
| 0000-0259 | 5.7 | 6.0 | 4.0 | 5.0 | 6.0 |
| 0300-0559 | 4.8 | 4.0 | 2.0 | 4.0 | 4.0 |
| 0600-0859 | 5.9 | 6.0 | 5.0 | 5.0 | 6.0 |
| 0900-1159 | 6.4 | 6.0 | 7.0 | 6.0 | 7.0 |
| 1200-1459 | 6.5 | 7.0 | 8.0 | 7.0 | 8.0 |
| 1500-1759 | 7.4 | 8.0 | 8.0 | 7.0 | 8.0 |
| 1800-2059 | 6.3 | 6.0 | 8.0 | 6.0 | 8.0 |
| 2100-2359 | 5.8 | 6.0 | 7.0 | 6.0 | 7.0 |
| AVG Per Day | 12.2 | 12.3 | 12.3 | 11.5 | 13.5 |
| AVG * 2.63 SRF | 32.0 | 32.2 | 32.2 | 30.2 | 36.0 |
| Additional Fielded Constables | 0.2 | 0.2 | Met | 4.0 |
To determine the total number of funded Constables required to field four watches or two twelve hour shifts per day; the Constables required per day, which in the case of West Shore detachment is 13.5. This number is multiplied by the shift relief factor, which in this case is 2.63 for a total of 36⁷ GD Constables. 36 positions divided by a standard four watch structure, this leads to 9 GD Constable per watch.
⁷ Rounded up to nearest number dividable by 4
Business Line Analysis
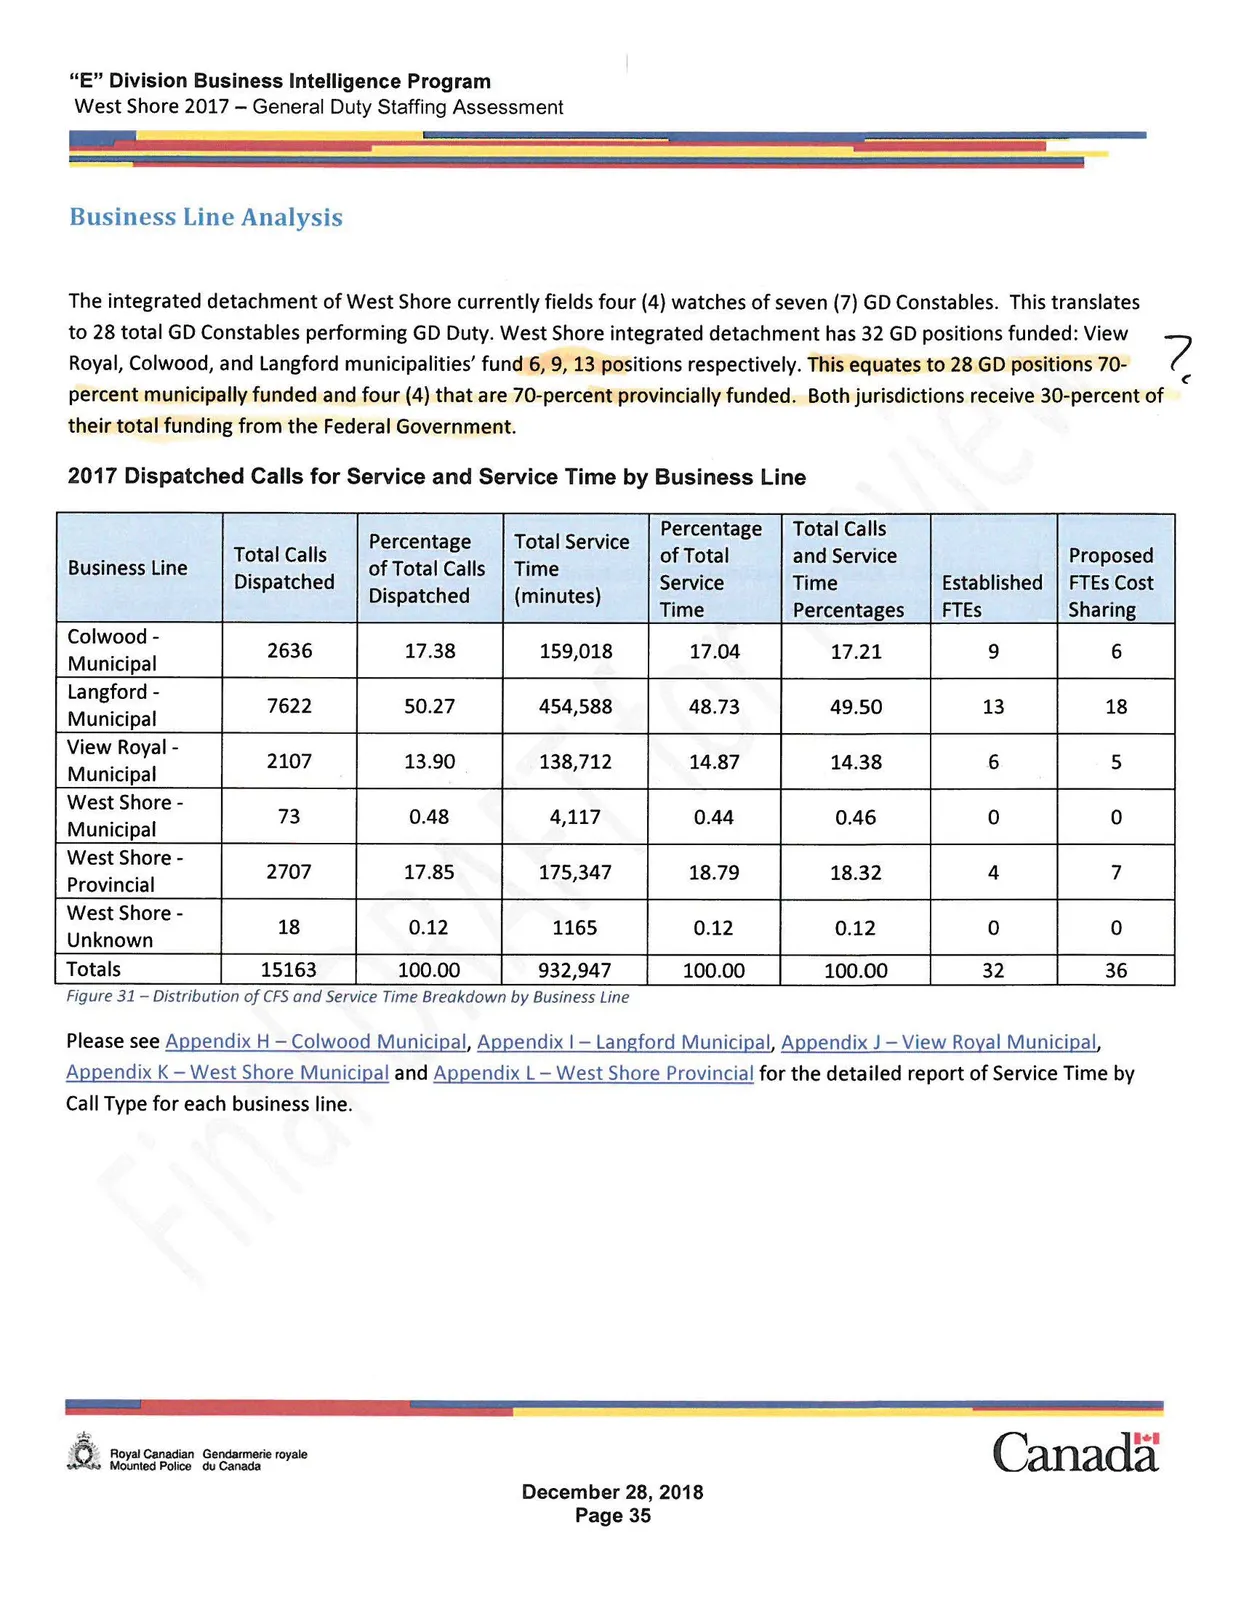
The integrated detachment of West Shore currently fields four (4) watches of seven (7) GD Constables. This translates to 28 total GD Constables performing GD Duty. West Shore integrated detachment has 32 GD positions funded: View Royal, Colwood, and Langford municipalities’ fund 6, 9, 13 positions respectively. This equates to 28 GD positions 70-percent municipally funded and four (4) that are 70-percent provincially funded. Both jurisdictions receive 30-percent of their total funding from the Federal Government.
2017 Dispatched Calls for Service and Service Time by Business Line
| Business Line | Total Calls Dispatched | Percentage of Total Calls Dispatched | Total Service Time (minutes) | Percentage of Total Service Time | Total Calls and Service Time Percentages | Established FTEs | Proposed FTEs Cost Sharing |
|---|---|---|---|---|---|---|---|
| Colwood - Municipal | 2636 | 17.38 | 159,018 | 17.04 | 17.21 | 9 | 6 |
| Langford - Municipal | 7622 | 50.27 | 454,588 | 48.73 | 49.50 | 13 | 18 |
| View Royal - Municipal | 2107 | 13.90 | 138,712 | 14.87 | 14.38 | 6 | 5 |
| West Shore - Municipal | 73 | 0.48 | 4,117 | 0.44 | 0.46 | 0 | 0 |
| West Shore - Provincial | 2707 | 17.85 | 175,347 | 18.79 | 18.32 | 4 | 7 |
| West Shore - Unknown | 18 | 0.12 | 1165 | 0.12 | 0.12 | 0 | 0 |
| Totals | 15163 | 100.00 | 932,947 | 100.00 | 100.00 | 32 | 36 |
Figure 31 – Distribution of CFS and Service Time Breakdown by Business Line
Please see Appendix H – Colwood Municipal, Appendix I – Langford Municipal, Appendix J – View Royal Municipal, Appendix K – West Shore Municipal and Appendix L – West Shore Provincial for the detailed report of Service Time by Call Type for each business line.
Average Response Times:
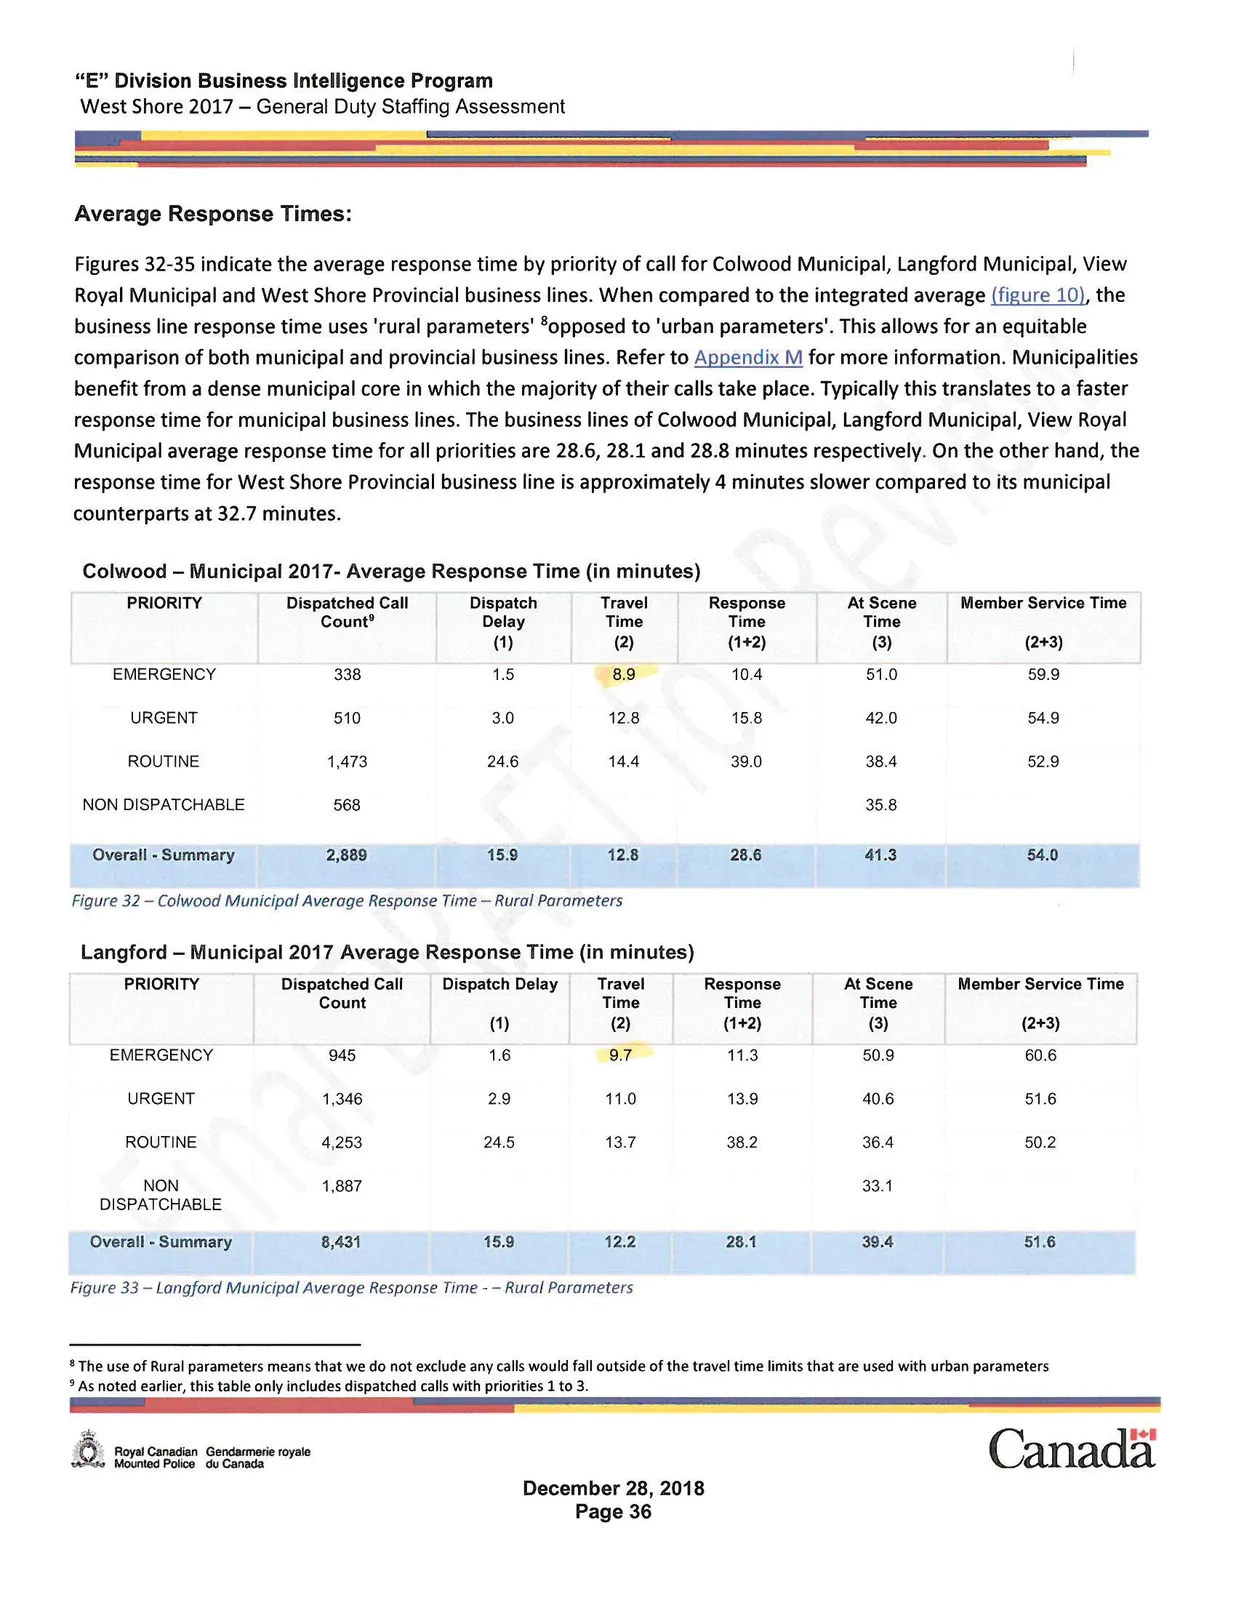
Figures 32-35 indicate the average response time by priority of call for Colwood Municipal, Langford Municipal, View Royal Municipal and West Shore Provincial business lines. When compared to the integrated average (figure 10), the business line response time uses ‘rural parameters’ ⁸ opposed to ‘urban parameters’. This allows for an equitable comparison of both municipal and provincial business lines. Refer to Appendix M for more information. Municipalities benefit from a dense municipal core in which the majority of their calls take place. Typically this translates to a faster response time for municipal business lines. The business lines of Colwood Municipal, Langford Municipal, View Royal Municipal average response time for all priorities are 28.6, 28.1 and 28.8 minutes respectively. On the other hand, the response time for West Shore Provincial business line is approximately 4 minutes slower compared to its municipal counterparts at 32.7 minutes.
Colwood – Municipal 2017- Average Response Time (in minutes)
| PRIORITY | Dispatched Call Count⁹ | Dispatch Delay (1) | Travel Time (2) | Response Time (1+2) | At Scene Time (3) | Member Service Time (2+3) |
|---|---|---|---|---|---|---|
| EMERGENCY | 338 | 1.5 | 8.9 | 10.4 | 51.0 | 59.9 |
| URGENT | 510 | 3.0 | 12.8 | 15.8 | 42.0 | 54.9 |
| ROUTINE | 1,473 | 24.6 | 14.4 | 39.0 | 38.4 | 52.9 |
| NON DISPATCHABLE | 568 | 35.8 | ||||
| Overall - Summary | 2,889 | 15.9 | 12.8 | 28.6 | 41.3 | 54.0 |
Figure 32 – Colwood Municipal Average Response Time – Rural Parameters
Langford – Municipal 2017 Average Response Time (in minutes)
| PRIORITY | Dispatched Call Count | Dispatch Delay (1) | Travel Time (2) | Response Time (1+2) | At Scene Time (3) | Member Service Time (2+3) |
|---|---|---|---|---|---|---|
| EMERGENCY | 945 | 1.6 | 9.7 | 11.3 | 50.9 | 60.6 |
| URGENT | 1,346 | 2.9 | 11.0 | 13.9 | 40.6 | 51.6 |
| ROUTINE | 4,253 | 24.5 | 13.7 | 38.2 | 36.4 | 50.2 |
| NON DISPATCHABLE | 1,887 | 33.1 | ||||
| Overall - Summary | 8,431 | 15.9 | 12.2 | 28.1 | 39.4 | 51.6 |
Figure 33 – Langford Municipal Average Response Time – Rural Parameters
⁸ The use of Rural parameters means that we do not exclude any calls would fall outside of the travel time limits that are used with urban parameters ⁹ As noted earlier, this table only includes dispatched calls with priorities 1 to 3.
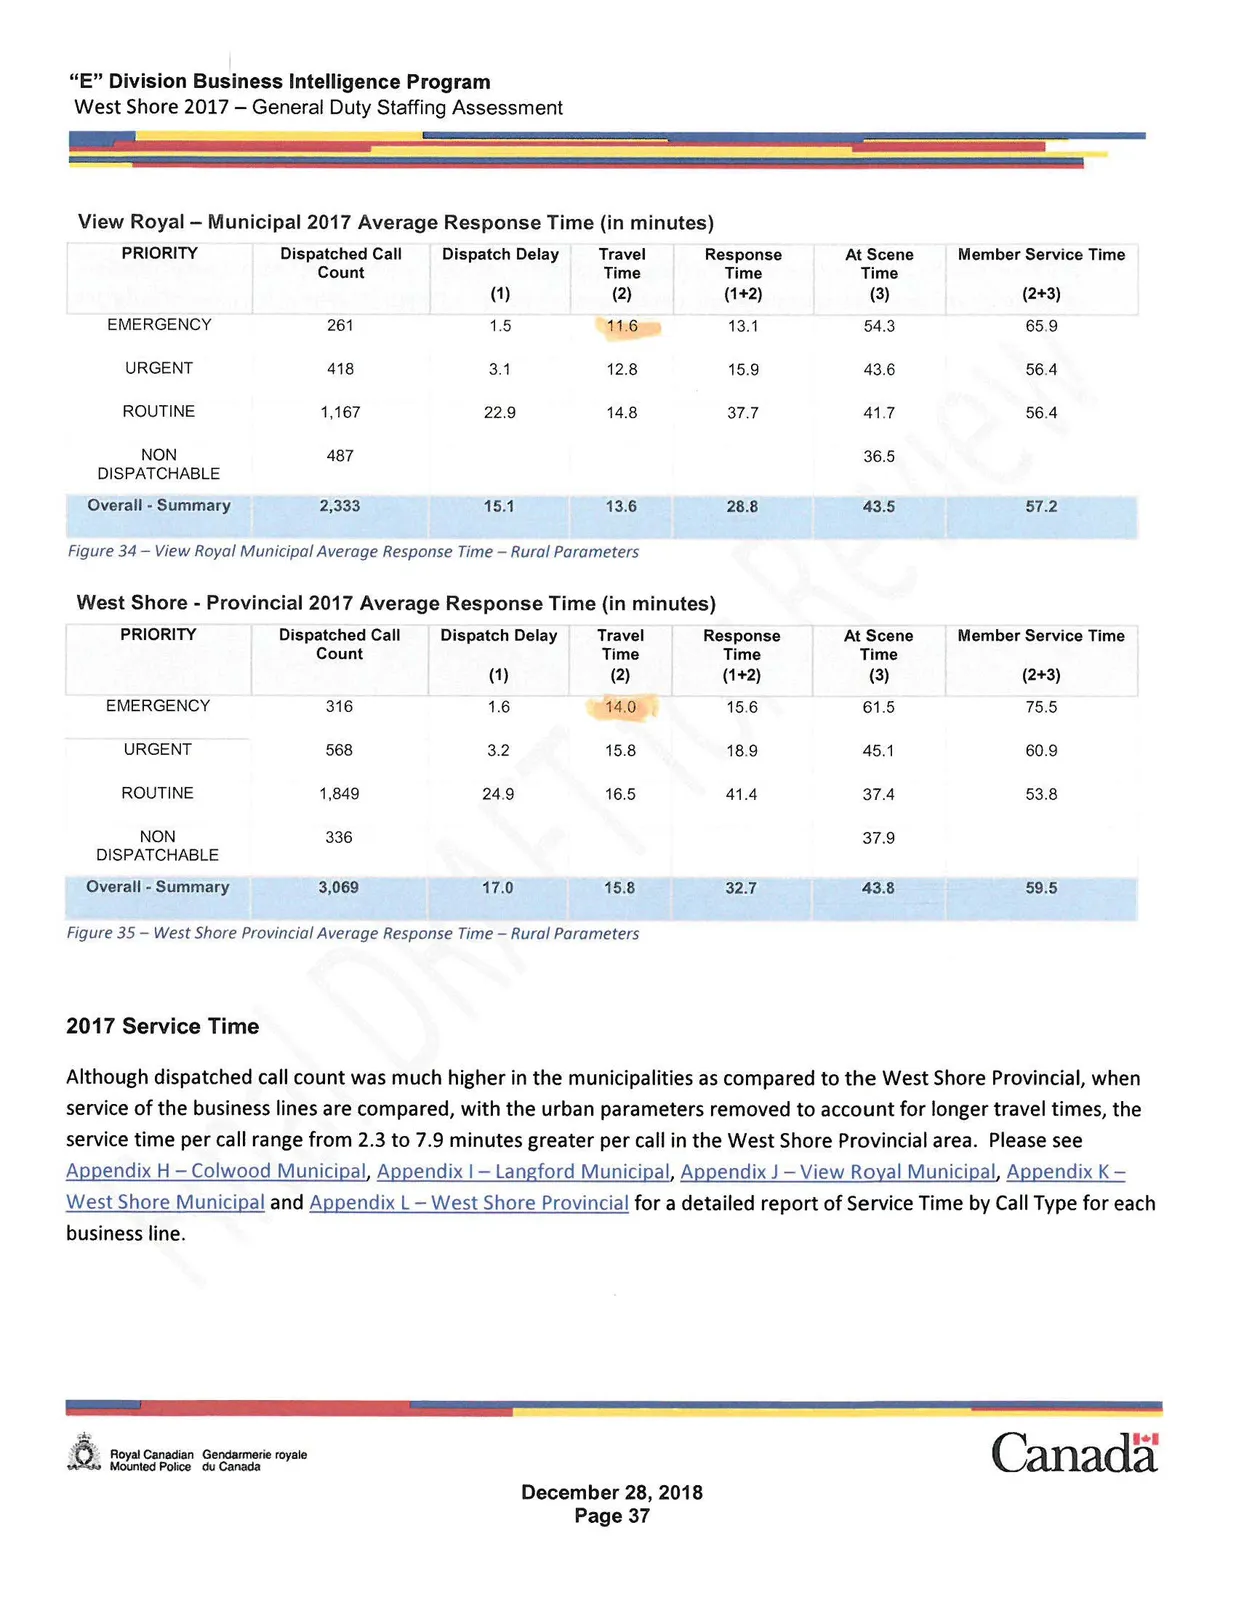
View Royal – Municipal 2017 Average Response Time (in minutes)
| PRIORITY | Dispatched Call Count | Dispatch Delay (1) | Travel Time (2) | Response Time (1+2) | At Scene Time (3) | Member Service Time (2+3) |
|---|---|---|---|---|---|---|
| EMERGENCY | 261 | 1.5 | 11.6 | 13.1 | 54.3 | 65.9 |
| URGENT | 418 | 3.1 | 12.8 | 15.9 | 43.6 | 56.4 |
| ROUTINE | 1,167 | 22.9 | 14.8 | 37.7 | 41.7 | 56.4 |
| NON DISPATCHABLE | 487 | 36.5 | ||||
| Overall - Summary | 2,333 | 15.1 | 13.6 | 28.8 | 43.5 | 57.2 |
Figure 34 – View Royal Municipal Average Response Time – Rural Parameters
West Shore - Provincial 2017 Average Response Time (in minutes)
| PRIORITY | Dispatched Call Count | Dispatch Delay (1) | Travel Time (2) | Response Time (1+2) | At Scene Time (3) | Member Service Time (2+3) |
|---|---|---|---|---|---|---|
| EMERGENCY | 316 | 1.6 | 14.0 | 15.6 | 61.5 | 75.5 |
| URGENT | 568 | 3.2 | 15.8 | 18.9 | 45.1 | 60.9 |
| ROUTINE | 1,849 | 24.9 | 16.5 | 41.4 | 37.4 | 53.8 |
| NON DISPATCHABLE | 336 | 37.9 | ||||
| Overall - Summary | 3,069 | 17.0 | 15.8 | 32.7 | 43.8 | 59.5 |
Figure 35 – West Shore Provincial Average Response Time – Rural Parameters
2017 Service Time
Although dispatched call count was much higher in the municipalities as compared to the West Shore Provincial, when service of the business lines are compared, with the urban parameters removed to account for longer travel times, the service time per call range from 2.3 to 7.9 minutes greater per call in the West Shore Provincial area. Please see Appendix H – Colwood Municipal, Appendix I – Langford Municipal, Appendix J – View Royal Municipal, Appendix K – West Shore Municipal and Appendix L – West Shore Provincial for a detailed report of Service Time by Call Type for each business line.
Conclusions
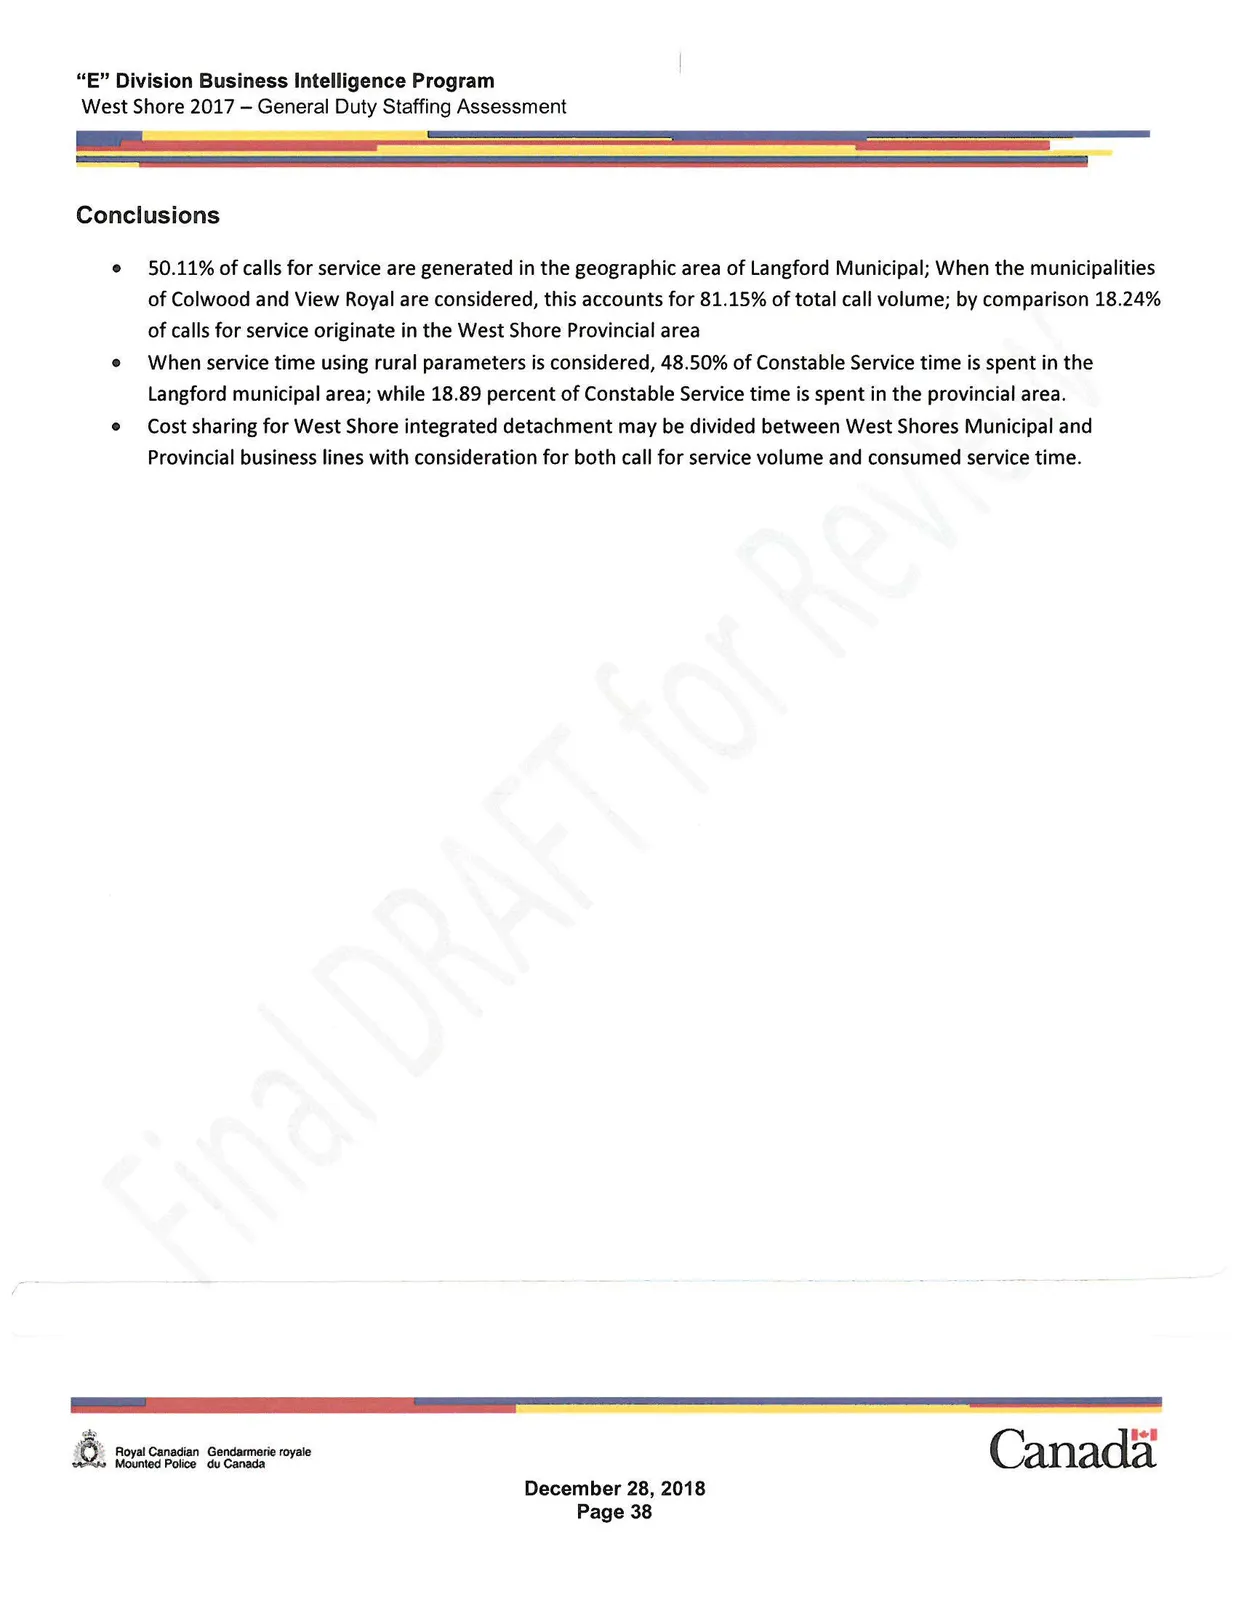
- 50.11% of calls for service are generated in the geographic area of Langford Municipal; When the municipalities of Colwood and View Royal are considered, this accounts for 81.15% of total call volume; by comparison 18.24% of calls for service originate in the West Shore Provincial area
- When service time using rural parameters is considered, 48.50% of Constable Service time is spent in the Langford municipal area; while 18.89 percent of Constable Service time is spent in the provincial area.
- Cost sharing for West Shore integrated detachment may be divided between West Shores Municipal and Provincial business lines with consideration for both call for service volume and consumed service time.
Conclusions and Recommendations
Results of the Staffing Assessment demonstrate that the detachment needs 36 (35.5 rounded up) GD members ready for duty to ensure that they send 35 percent of their time on call for service work with a 12 minute urgent response time as well as having 2 units free to promote member safety and to be able to respond to major emergency events (Refer to Figure 30). Given that the detachment was only able to field 12.2 GD members per day during 2017 as per the Bottoms Up Analysis in Figure 30, this means that the total number of GD members available for duty was 32 (12.2 * SRF of 2.63 = 32), the recommended level of staffing of 36 GD members cannot be supported by the 32 GD positions funded for the detachment.
This analysis is the first step in determining the number of General Duty Constables needed in West Shore and deploying those members to make the best use of their time on duty. The baseline created in this report can be used to plan additional analysis that may be used to accurately assess the future staffing needs of the detachment of West Shore.
- General Duty staffing levels need to be modified to meet the performance goals of an average urgent response time of 12 minutes, 35 percent of Constable time spent on calls for service, and an average of 2 Constables free to promote officer safety and to respond in an emergency. In addition, improved scheduling may address the higher than average response time to emergency calls, currently experienced West Shore
- The detachment may want to consider changing the General Duty work schedule to make better use of staff time so the officers will not be understaffed, especially during the evening.
- Municipal Community plans should focus on traffic safety and domestic violence as these calls represent a large proportion of the service time of dispatched calls. Future plans should assess the data and continue to involve the communities.
- The detachment may want to examine dispatch practices to ensure calls are categorized correctly to reflect the type and priority of call. Steps may be taken to change policies that determine what call types General Duty Constables should attend. False alarms should be evaluated to determine if bylaw changes could reduce Constable workload generated by alarms. Similarly, the number of unverified 911 calls dispatched should be evaluated. Risk assessment, policy changes and call diversion strategies implemented other jurisdictions have significantly reduced time spent on these calls with no impact on public safety.
- This assessment provides decision makers with information to determine the number of General Duty Constables required for West Shore detachment. Additional personnel required to support GD in an RCMP detachment are listed below a. Supervisory: To operate effectively, GD personnel require a supervisory structure; therefore, additional supervisory personnel must be considered when a potential increase in GD personnel is considered. b. Administrative Support Personnel: Although outside the scope of this assessment, decision makers must consider the number of support staff workers required to provide administrative assistance to the GD Constables in West Shore. c. Specialized Units: Decision-makers should also consider when the detachment may benefit from augmenting General Duty with specialized units such as Police Dog Service, Traffic Enforcement, School Liaison, Drug Enforcement/Awareness or a General Investigations Section that could proactively address criminal trends within the detachment area.
Document Images
(26)