Community Satisfaction Survey Report
Results of a resident survey gauging satisfaction with quality of life, Town services, value for taxes, and future priorities.
Community Satisfaction Survey Report
March 6, 2019
Prepared by: NRG Research Group Suite 1380-1100 Melville Street Vancouver, BC V6E 4A6
Tim Chan, Vice President 604-676-5652
Cam Mathewson, Senior Research Consultant 604-676-3994
Table of Contents
- Executive Summary - 3
- Method - 10
- Data Collection - 11
- Results - 12
- Issues Agenda and Current Service Levels - 12
- Planning for the Future - 30
- Key Driver Analysis - on Satisfaction with Overall Services - 38
- Appendix: Demographics - 43
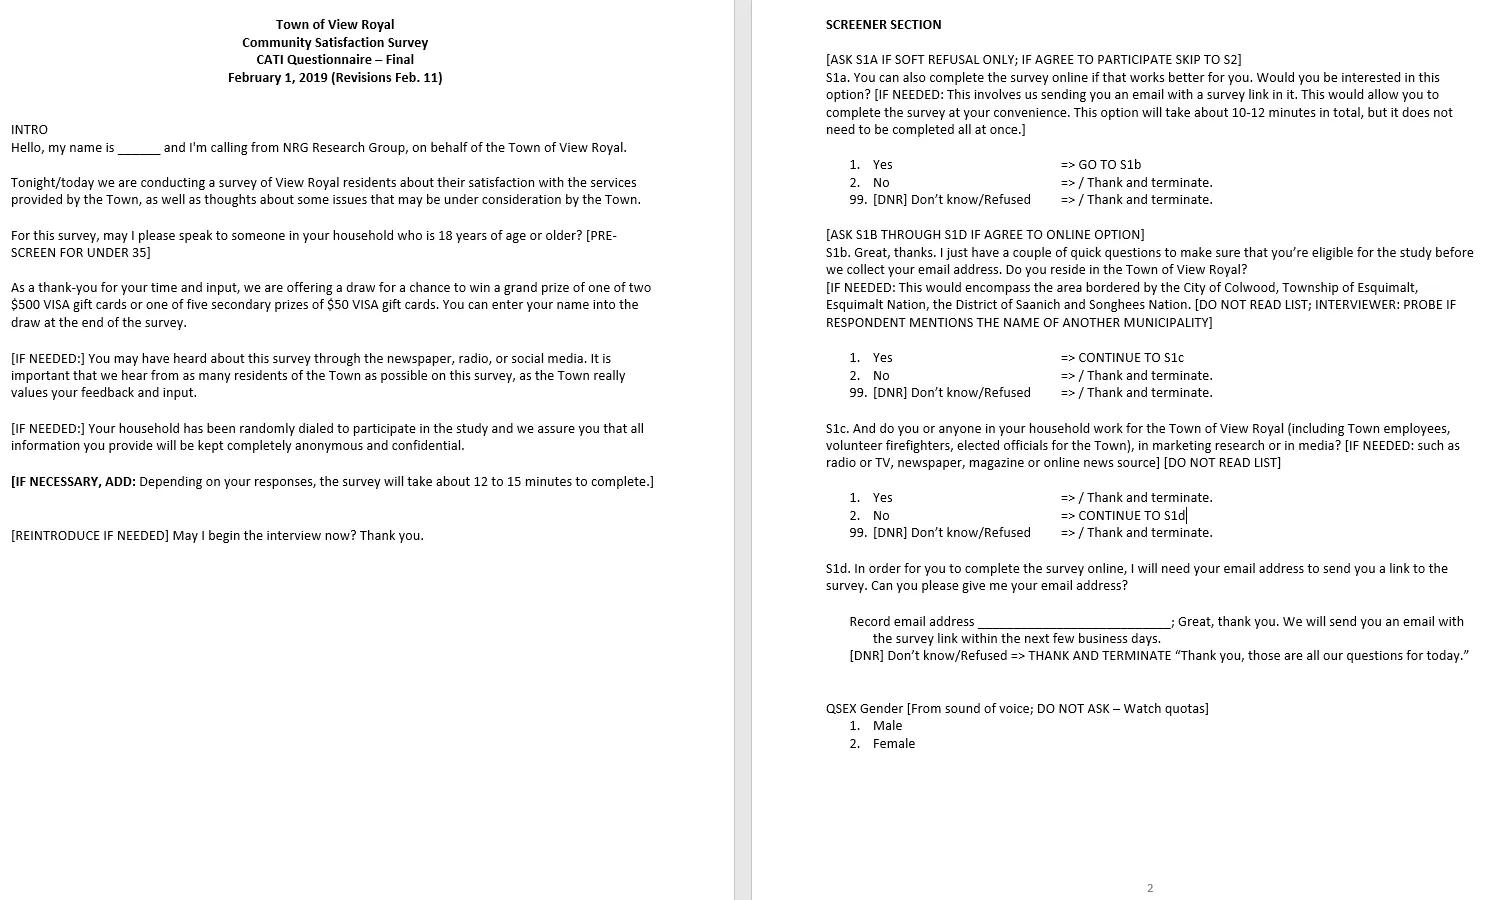
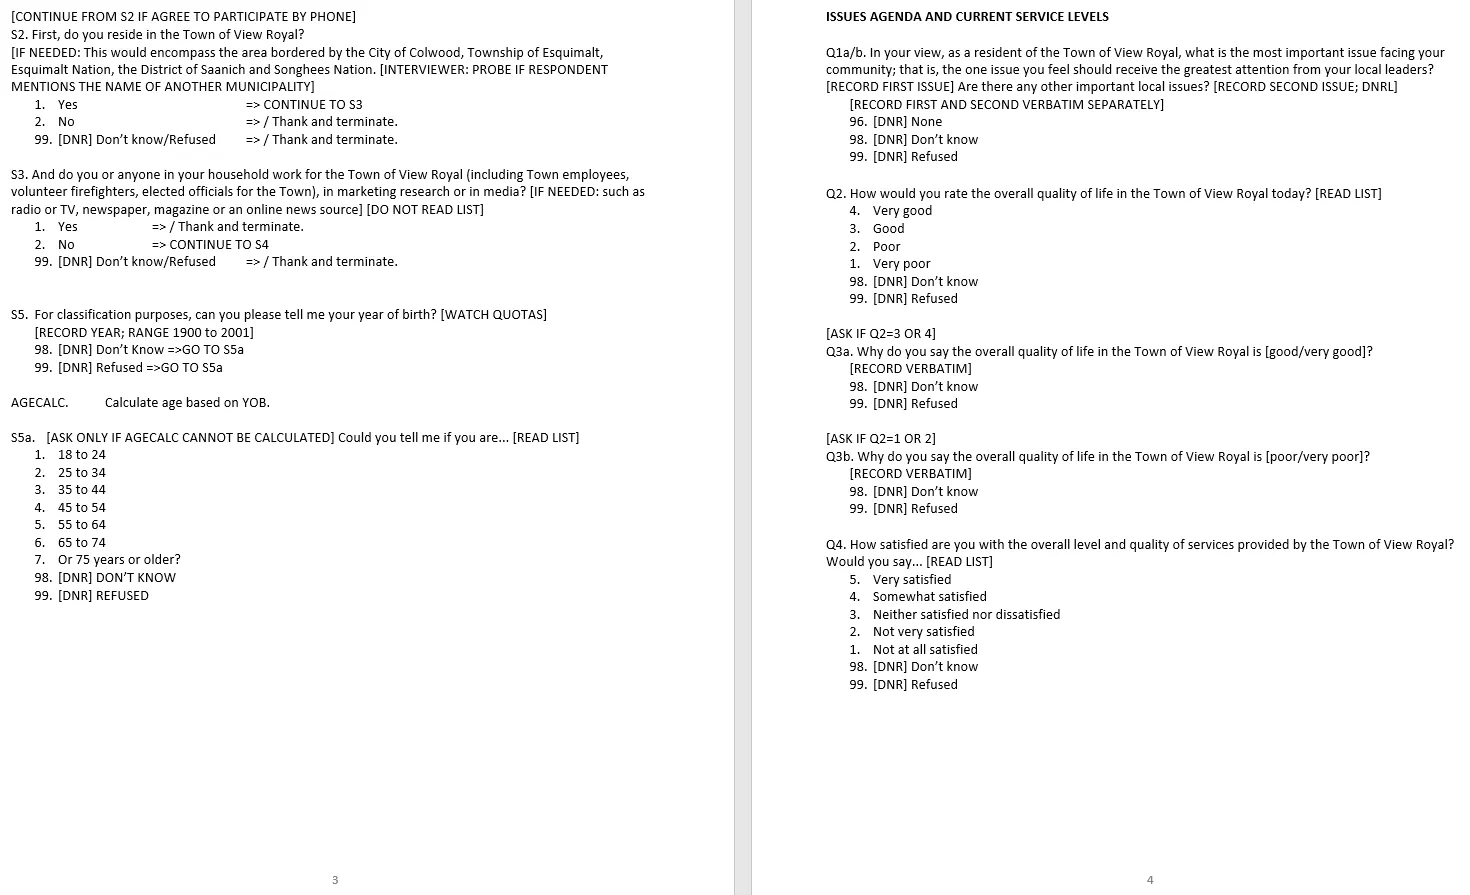
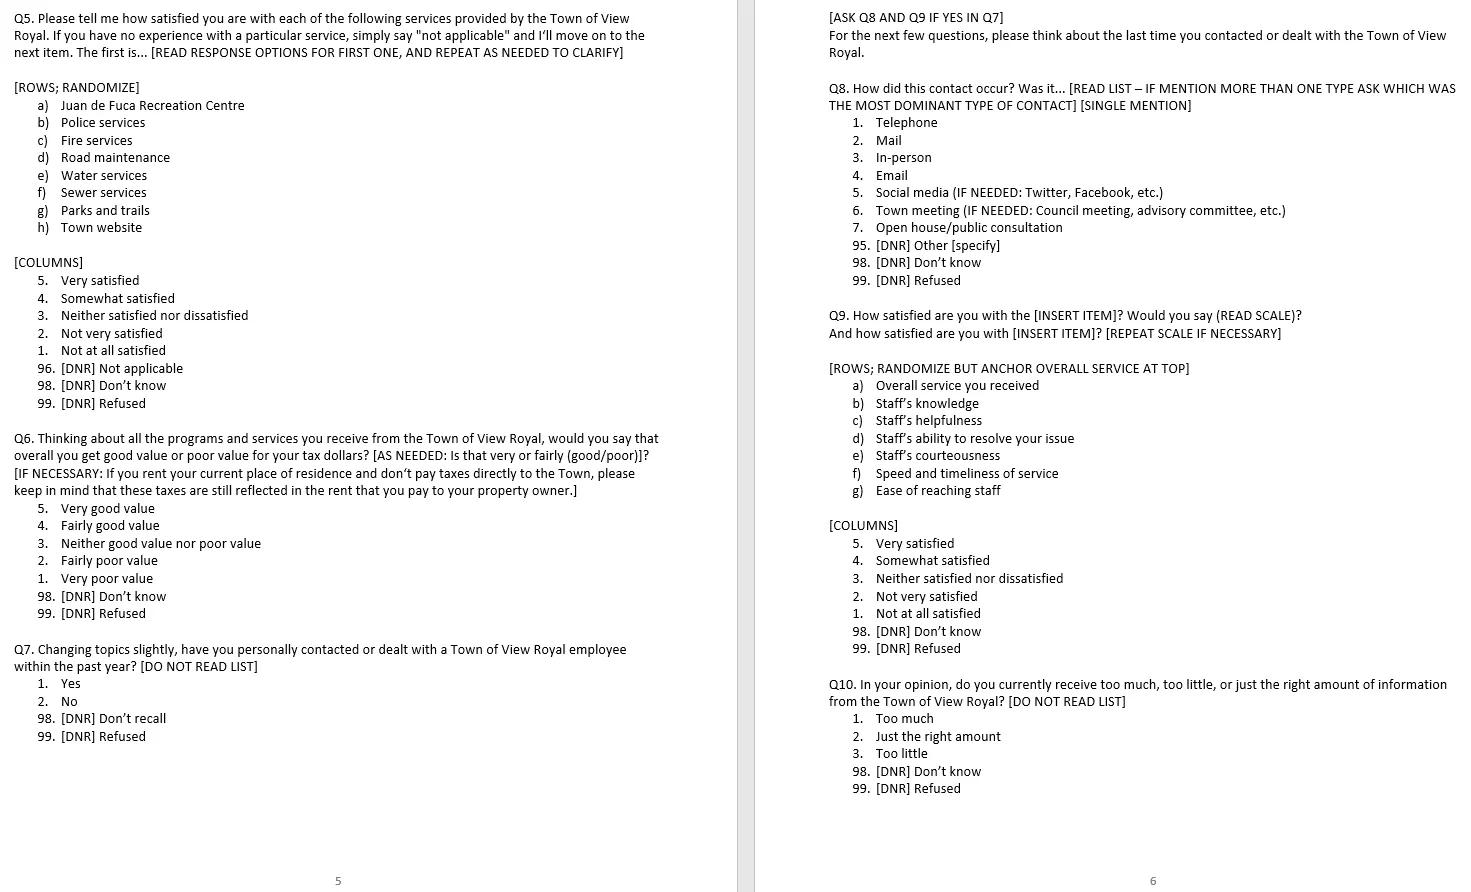
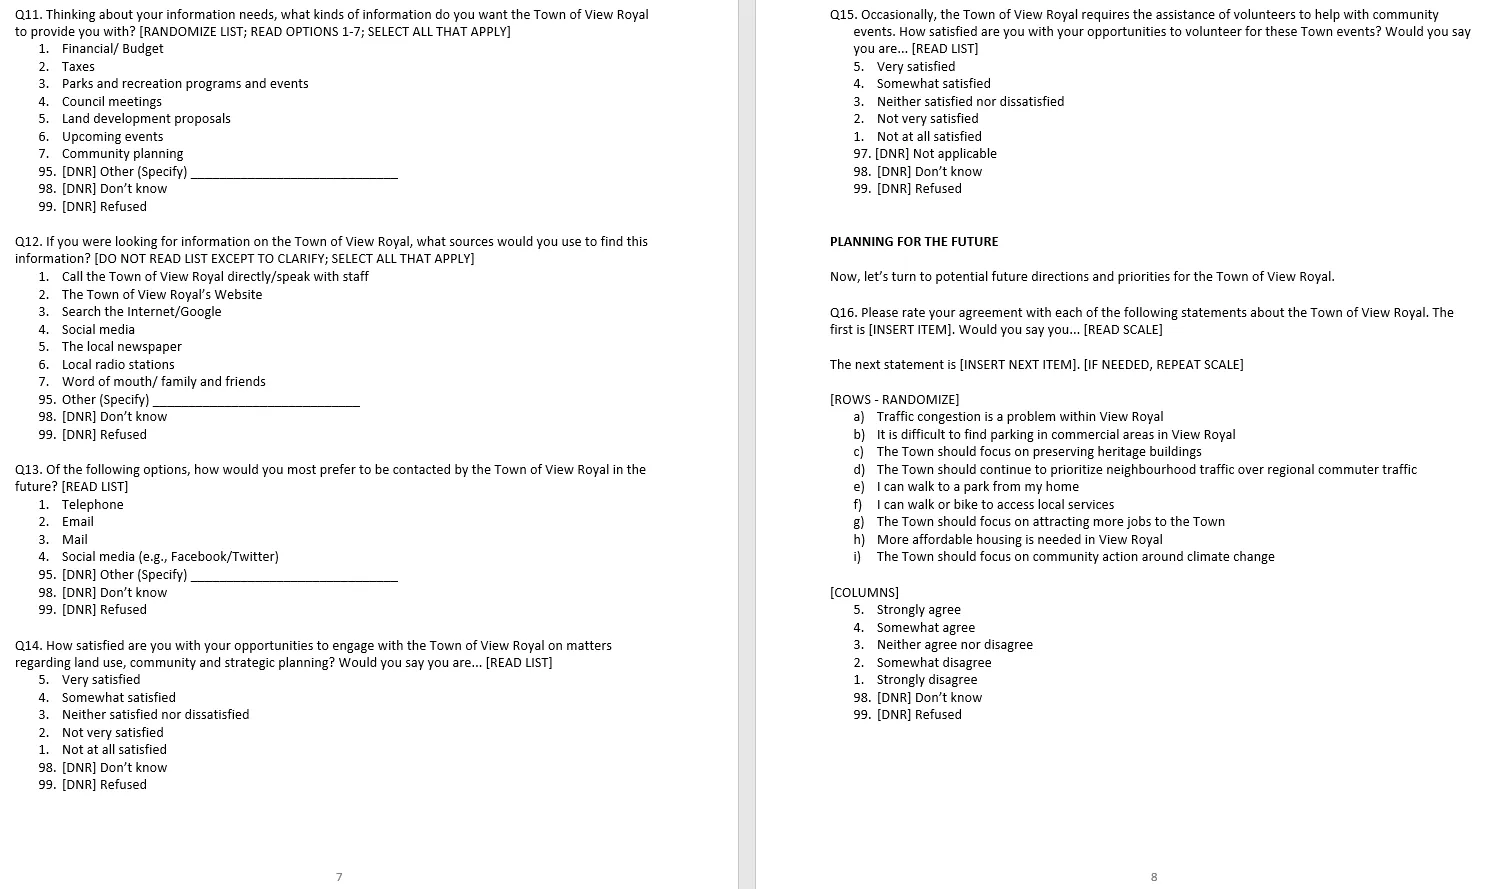
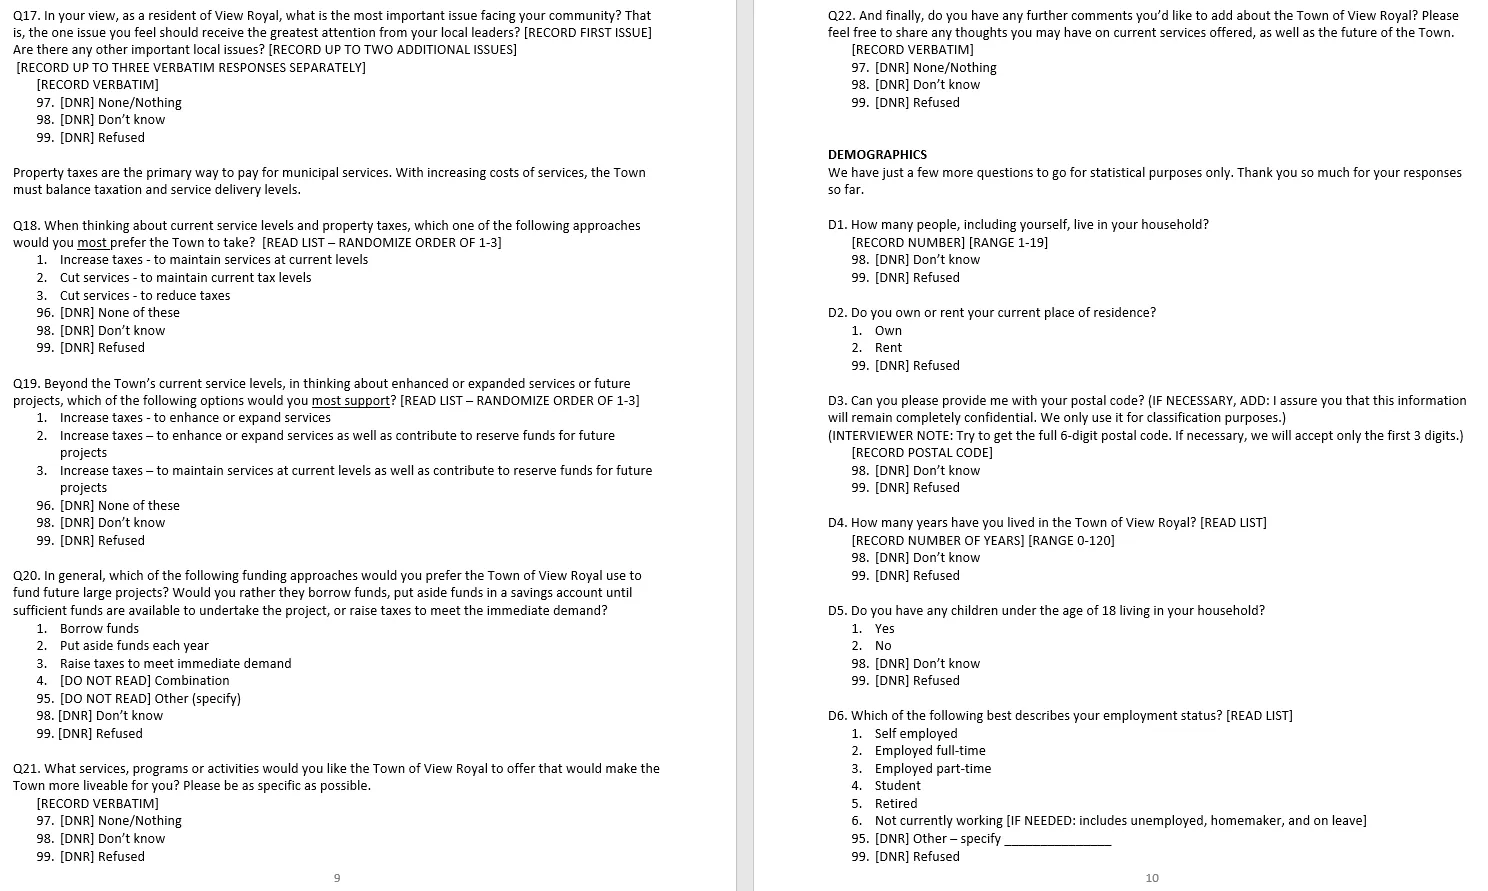
- Appendix: Telephone Survey - 46
Executive Summary
Background and Objectives
- The Town of View Royal is part of the growing Greater Victoria metropolitan area and is one of 13 local governments in the Capital Regional District (CRD). The Town is flanked by the City of Colwood, Township of Esquimalt, Songhees and Esquimalt First Nations and the District of Saanich. The Town has a population of 10,408 residents in approximately 4,337 households.
- The Town of View Royal commissioned NRG Research Group to conduct a Community Satisfaction Survey among residents. The intent of this survey is to provide the Town with information regarding the awareness, use and satisfaction with current service levels, as well as information regarding perceptions of potential future directions.
- The specific objectives of the Community Satisfaction Survey were to:
- Identify the most important local issues to residents of the Town of View Royal;
- Gauge satisfaction with overall quality of life, overall level and quality of services provided by the Town, and specific services offered by the Town;
- Understand perceptions of value for tax dollars;
- Determine the types and sources of information desired by residents, as well as preferred contact method for future interactions;
- Assess sentiment on potential investments in infrastructure (including bike and pedestrian paths and parks and trails), traffic congestion, and other services; and,
- Gauge responses to potential approaches to funding future large projects, as well as strategies for balancing funding and service levels.
- The questionnaire, shown in the Appendix, was developed by Town of View Royal in collaboration with NRG Research Group.
Issues Agenda and Current Service Levels
- When residents are asked, on an unaided basis, to name the single most important issue facing the Town of View Royal today, the predominant theme by far is around traffic congestion, flow and safety with four in ten (41%) residents mentioning this subject.
- When looking at all mentions of important issues to View Royal residents, again the most pressing one is traffic congestion, flow and safety (53% mentioning).
- Trailing well behind are concerns relating to transportation infrastructure/maintenance of roads, streets, sidewalks (20%), community planning, development and zoning/density issues (19%) and police/fire/public safety/crime/bylaw enforcement (17%).
- Other notable issues mentioned include public transit (8%), taxes (8%), maintaining green space (7%) and community events/facilities (6%).
- Residents almost universally rate the overall quality of life in the Town of View Royal as good or very good, with 99% giving a positive rating, of which 59% rate it ‘very good’.
- Key reasons for satisfaction with life in the Town of View Royal include the central location, being close to facilities, amenities, services and routes (33% mentioning), the beauty of the Town with its natural areas, parks and rural setting (24%), good services provided by the Town (17%), the small town feel, quiet/peaceful (14%) and good roads/well maintained (12%).
- Nine in ten residents (90%) indicate that they are very or somewhat satisfied with the overall level and quality of services provided by the Town of View Royal.
- View Royal residents also tend to be quite satisfied with specific Town services (among the services they rate as applicable to them).
- Residents are most satisfied with water services (98% are very or somewhat satisfied), followed very closely by sewer services (96%), fire services (96%), parks and trails (95%) and the Juan de Fuca Recreation Centre (94%).
- Nine in ten residents are also satisfied with road maintenance (91%) and police services (89%).
- The lowest satisfaction score is for the Town website (84% among those who have used it).
- Considering all of the programs and services they receive from the Town of View Royal, more than eight in ten residents (86%) believe that they get good value for their tax dollars. This includes 45% who feel they get fairly good value, and another 41% who say they get very good value for their taxes.
- Two-thirds (68%) of residents have had personal contact with a Town of View Royal employee within the past year.
- The majority of these contacts (51%) took place in person, and another one-quarter (26%) were over the phone. Email (13%) was the next most common form of interaction, with open houses or public consultations accounting for notably fewer interactions (6%).
- The elements of personal interaction perceived as particularly positive to residents are staff courteousness (89% somewhat or very satisfied), staff helpfulness (88%), staff’s knowledge (86%) and ease of reaching staff (85%). Three-quarters (75%) of residents are satisfied with the speed and timeliness of service.
- The lowest satisfaction with any element of the interaction with a Town employee relates to staff’s ability to resolve the issue, with six in ten (59%) residents satisfied. Two in ten (21%) are not satisfied with this aspect of their interaction.
- Over three-quarters (78%) of all residents believe they receive just the right amount of information from the Town of View Royal.
- Two in ten (21%) think they do not receive enough information. Almost none (less than 1%) think they receive too much information.
- When asked what information they would like to see from the Town of View Royal, residents most prefer information on land development proposals (87%), taxes (86%), community planning (86%) and upcoming events (84%).
- Over three-quarters (78%) would like more information on parks and recreation programs and events. Seven in ten residents (71%) would like to receive information on the Town’s financial situation and budget, while six in ten (62%) would like more information on Council meetings.
- When looking for information about the Town of View Royal, residents most often go directly to the source--over three-quarters (77%) would look at the Town website.
- One-third (32%) of residents would call the Town and speak with a staff member. Almost one quarter (22%) would conduct a more general web search for information about View Royal while only one in ten would use social media or the local newspaper.
- Residents prefer mostly to receive information from the Town via email (46%), followed by mail (28%) and telephone (22%).
- Residents tend to be fairly satisfied with the opportunity to engage with the Town of View Royal on matters regarding land use, community and strategic planning.
- Almost two-thirds (62%) of residents are satisfied with the opportunity to engage, of whom almost one-quarter (24%) say they are very satisfied and 38% are somewhat satisfied.
- Overall, residents tend to be fairly satisfied with the opportunities available to volunteer for Town of View Royal events, with four in ten (42%) satisfied; however, 14% are dissatisfied and 35% are neither satisfied nor dissatisfied with volunteer opportunities.
Planning for the Future
- Agreement tends to be fairly strong in terms of future priorities for the Town of View Royal, especially related to walking and biking infrastructure; however, traffic congestion is a major concern.
- Almost all residents (98%) agree that “I can walk to a park from my home,” with almost nine in ten (88%) agreeing that “I can walk or bike to access local services.”
- Over nine in ten (93%) feel that “Traffic congestion is a problem within View Royal.”
- Eight in ten (80%) agree that “The Town should focus on preserving heritage buildings.”
- Two-thirds agree that the “The Town should continue to prioritize neighbourhood traffic over regional commuter traffic” and “More affordable housing is needed in View Royal” (67% each) along with “The Town should focus on attracting more jobs to the Town” (65% agree).
- Parking is a low priority for residents. Only three in ten (29%) agree with the statement “It is difficult to find parking in commercial areas in View Royal” while 56% disagree.
- Town of View Royal residents are fairly open to tax increases to maintain services at current levels as well as contributing to reserve funds for future projects.
- When thinking about current service levels and property taxes, half (52%) of the residents would prefer the Town to “Increase taxes - to maintain services at current levels.” The second most preferred option, selected by one-quarter (27%) of residents, is to “Cut services - to maintain current tax levels.”
- When thinking about enhanced or expanded services or future projects, the option most supported is to “Increase taxes – to maintain services at current levels as well as contribute to reserve funds for future projects” with four in ten (42%) preferring this approach.
- The top choice among approaches to fund future large projects in the Town of View Royal, selected by two-thirds (68%) of residents, is to “Put aside funds each year.”
- When asked which activities and services they would like the Town to offer to help make the area more liveable, residents mention ‘more community events/cultural events/ foster community spirit’ (11%) and ‘more facilities/programs for children & youth’ (9%).
- The next most common services, programs or activities mentioned are: ‘better transportation infrastructure/ maintenance of roads, more sidewalks, bike lanes’, ‘more local businesses/ stores/restaurants/doctor’s offices’ and ‘maintain/expand green spaces/parks/ trails/walkable and waterways access’ with each mentioned by 7% of Town residents.
- The final open-ended comments provided are varied, although the most popular comments from residents about the Town refer to:
- ‘Reduce traffic congestion’ and ‘Need better/more roads/sidewalks/infrastructure.’
- These were followed by mentions of the Town’s ‘Central location/Close to facilities/amenities/ services/routes’ and having ‘Low taxes/Affordable living.’
Key Driver Analysis - on Satisfaction with Overall Services
Staff Recommendations:
- Road maintenance should be a top focus area for the Town of View Royal as this is a key driver of overall satisfaction with the level and quality of services provided by the Town.
- This is reinforced by the result that transportation-related issues (traffic congestion/flow/ safety and transportation infrastructure and maintenance) are seen as the most important ones facing View Royal residents.
- View Royal should reinforce and continue to take care of parks and trails in the area, as this was also identified as important to residents and a major reason they rate the quality of life in the Town as good.
Methodology
- The Community Satisfaction Survey was conducted primarily via telephone interviewing, using random digit dialing. Respondents were also given the opportunity to participate through an online survey if they were unable or unwilling to participate by telephone; interviewers collected the respondents’ email address and a unique link to the survey was sent by email.
- A total of 401 households from the Town of View Royal were surveyed between February 11-26, 2019. Of the 401 surveys conducted, 400 were by telephone, while 1 responded to an email invitation. Based on the total population and sample size, the maximum margin of error for the total sample is ±4.9%, 19 times out of 20.
- Potential participants were ineligible for the study if they did not reside in the Town of View Royal. As well, anyone with a household member working for the Town of View Royal (including Town employees, volunteer firefighters, elected officials for the Town), or in the fields of marketing research or media, was not eligible to participate in the telephone survey.
- To evaluate differences or similarities in responses between subgroups of the public, the results for each question of the survey have been cross-tabulated by key demographic questions, including age, gender, household composition, home ownership, occupation, education, and number of years lived in the Town of View Royal. Statistically significant differences in responses between these subgroups are discussed as appropriate in the body of this report.
- The responses to certain open-ended questions in the survey were categorized and coded, with the responses provided in data tables. These are included in this report where appropriate. Verbatim responses to other open-ended questions are highlighted within the report but were not coded due to low response counts.
- NRG and the Town of View Royal also offered an open link to the survey in parallel with the telephone survey. If any Town resident missed the opportunity to speak with NRG but still wanted a chance to weigh in, they were able to access the survey through this link. This link was posted on the Town’s website and shared on social media. Results to the open link survey will be presented under separate cover.
Results: Issues Agenda and Current Service Levels
The first part of the survey focused on current perceptions of services available to residents, including:
- The most important issues facing the Town today;
- Overall quality of life in the Town;
- Overall level and quality of services provided by the Town;
- Satisfaction with current services;
- Perceived value for tax dollars;
- Satisfaction with Town staff; and,
- Types of information needed, sources of information, and preferred contact methods.
Most Important Issue (Q1)

- When asked to name the single most important issue facing the Town of View Royal, traffic congestion/flow/safety is by far the issue mentioned most often, by four in ten (41%) residents.
- The next most common issues include transportation infrastructure/maintenance of roads, streets, sidewalks (15% mentioning), police/fire/public safety/crime/bylaw enforcement (13%) and community planning, development and zoning/ density issues (11%).
Combined Important Issues (Q1/Q1a)

- In combining first and second mentions, traffic congestion/flow/safety remains the dominant issue with over half (53%) of Town residents mentioning it.
- Transportation infrastructure/ maintenance of roads, streets, sidewalks (20%), community planning, development and zoning/density issues (19%) and police/fire/public safety/ crime/bylaw enforcement (17%) remain the next three top issues cited.
Overall Quality of Life (Q2)

- Residents of the Town of View Royal almost universally (99%) rate the overall quality of life in the Town as good or very good. In all, six in ten (59%) rate the overall quality of life as very good while the other four in ten (40%) rate it as good.
Reasons for Quality of Life Rating (Q3a)

- The top reasons for why residents feel the overall quality of life in the Town of View Royal is good are the related elements of central location, being close to facilities, amenities, services and routes (together, these are mentioned by one-third [33%] of respondents).
- The next most mentioned reason for rating the overall quality of life as good or very good is the beauty of the Town with its natural areas, parks and rural setting (24%).
Overall Satisfaction with Services (Q4)

- Residents tend to be very satisfied with the overall level and quality of services provided by the Town of View Royal. In all, nine in ten (90%) say they are very or somewhat satisfied with Town services. This includes almost six in ten residents (58%) who are very satisfied.
Satisfaction with Specific Town Services (Q5)

- Generally speaking, residents are satisfied with all of the Town of View Royal services they evaluated.
- The highest satisfaction is with water services (98% are either very or somewhat satisfied).
- This is followed closely by sewer services and fire services (both at 96%), parks and trails (95%) and Juan de Fuca Recreation Centre (94%).
- Nine in ten residents are satisfied with road maintenance (91%) and police services (89%).
- Among those that have used the Town website, over eight in ten (84%) are satisfied with it.
Value for Tax Dollars (Q6)

- In all, more than eight in ten residents (86%) say they get good value for their tax dollars when thinking about all the programs and services the Town of View Royal provides.
- This proportion includes 41% who think they get very good value and another 45% who think they get fairly good value for their tax dollars.
Personal Contact with Town Employee (Q7)

- Two-thirds (68%) of Town residents report having personally contacted or interacted with an employee of the Town of View Royal within the past year.
Method of Contact (Q8)
- Among those who have had interactions with a Town of View Royal employee within the past year, half (51%) say these interactions took place in person. This is followed by telephone (26%), email (13%) and open houses or public consultations (6%).
Satisfaction with Town Employee Interaction (Q9)
- Among those who have had interactions with a Town of View Royal employee within the past year, over eight in ten (84%) say they are satisfied with the overall service they received.
- The elements of the interaction with the highest levels of satisfaction are staff’s courteousness (89%) and helpfulness (88%).
- These are followed by the staff’s knowledge (86%) and the ease of reaching staff (85%).
- The interaction aspect with the lowest satisfaction pertains to staff’s ability to resolve issues where only six in ten (59%) are satisfied.
Amount of Information Received (Q10)
- Over three-quarters (78%) of residents think they currently receive just the right amount of information from the Town of View Royal. Two in ten (21%) feel they currently receive too little information.
Kinds of Information Desired (Q11)
- When it comes to topics of interest for Town of View Royal residents, the vast majority wants the Town to provide information on land development proposals (87%), taxes (86%), community planning (86%) and upcoming events (84%).
- Over three-quarters (78%) of residents would like more information on parks and recreation programs and events.
Sources of Information (Q12)
- When looking for information about the Town, most residents (77%) would go directly to View Royal’s website.
- One-third of residents would call the Town of View Royal directly and speak with a staff member (32%) and two in ten (22%) would look for information through a general internet search.
Preferred Method of Future Contact (Q13)
- Most View Royal residents prefer email as the method of contact from the Town, with almost half (46%) choosing this channel.
- Nearly three in ten (28%) would prefer to be contacted by mail, while 22% prefer telephone.
Satisfaction with Opportunity to Engage (Q14)

- Residents tend to be fairly satisfied with the opportunity to engage with the Town of View Royal on matters regarding land use, community and strategic planning.
- Almost two-thirds (62%) say they are satisfied with their opportunities, with one-quarter (24%) ‘very satisfied’ and another four in ten (38%) who are ‘somewhat satisfied’.
Satisfaction with Opportunity to Volunteer (Q15)

- Overall, residents tend to be fairly satisfied with the opportunities available to volunteer for Town of View Royal events. Three times as many say they are satisfied (42%) than dissatisfied (14%).
Results: Planning for the Future
The second section of the survey focused on areas of potential future direction and investigation, including:
- Accessibility of services and parks, traffic congestion, infrastructure, housing affordability, parking, heritage housing;
- Balancing funding and service levels;
- Other services, programs or activities the Town of View Royal could offer; and,
- Providing further comments.
Agreement with Future Priority Statements (Q16)

- Agreement tends to be very strong for the top statements about the Town of View Royal. This includes “I can walk to a park from my home” (98% somewhat or strongly agree), “Traffic congestion is a problem within View Royal” (93% agree) and “I can walk or bike to access local services” (88%).
- Eight in ten (80%) agree that “The Town should focus on preserving heritage buildings.”
- Two-thirds agree with the statements “The Town should continue to prioritize neighbourhood traffic over regional commuter traffic” and “More affordable housing is needed in View Royal” (67% each) along with “The Town should focus on attracting more jobs to the Town” (65% agree).
- Just over six in ten (62%) agree that “The Town should focus on community action around climate change.” Only three in ten (29%) agree that “It is difficult to find parking in commercial areas in View Royal.”
Preferred Approach to Service Levels and Taxes (Q18)
- When residents consider current service levels and property taxes, most would prefer the Town take the approach to “Increase taxes - to maintain services at current levels,” with half (52%) selecting this as their most preferred option.
- The second most preferred option, selected by one-quarter (27%) of residents, is to “Cut services - to maintain current tax levels”.
Support for Approaches Beyond Current Service Levels (Q19)
- When thinking about enhanced or expanded services or future projects, the option supported by most residents is to “Increase taxes – to maintain services at current levels as well as contribute to reserve funds for future projects” with four in ten (42%) selecting this approach.
- The second most supported option is to “Increase taxes – to enhance or expand services as well as contribute to reserve funds for future projects,” selected by two in ten (22%) residents.
Funding Approaches for Future Large Projects (Q20)
- The most popular approach to fund future large projects in the Town of View Royal, as selected by two-thirds (68%) of residents, is to “Put aside funds each year.”
- Fewer than two in ten (17%) residents choose the option of “Borrow funds”.
Desired Activities, Services or Programs (Q21)
- The top activities and services residents would like the Town of View Royal to offer to make the area more liveable are ‘more community events/cultural events/foster community spirit’ (11% mentioning) and ‘more facilities/ programs for children & youth’ (9% mentioning).
- Other services, programs or activities mentioned include ‘Better transportation infrastructure/ maintenance of roads, more sidewalks, bike lanes’, ‘more local businesses/ stores/restaurants/doctor’s offices’ and ‘maintain/expand green spaces/parks/ trails/walkable and waterways access,’ each mentioned by 7% of Town residents.
Additional Comments (Q22)
- Among additional comments residents made about the Town of View Royal referred to ‘Reduce traffic congestion’ and ‘Need better/more roads/ sidewalks/infrastructure’.
- As well, there are mentions of the Town’s ‘Central location/Close to facilities/amenities/services/routes’ and having ‘Low taxes/Affordable living’.
Results: Key Driver Analysis on Overall Satisfaction
Influencers on Overall Satisfaction with the Town's Services
Key Driver Analysis allows for the identification of particular aspects of the Town’s services that are having a greater impact on or drive resident’s overall satisfaction with the level and quality of services provided by the Town of View Royal. NRG constructed and ran a regression analysis using the survey data.
Dependent variable: Satisfaction with the Overall Level and Quality of Services provided by the Town of View Royal (Q4) Independent variables: Satisfaction with the Specific Services provided by the Town of View Royal (Q5)
Methodology: Quadrants are set by establishing the average performance rating and derived importance scores across all of the service aspects that were rated.
- Reinforce: High importance; high performance (upper right quadrant) - Core strengths.
- Focus: High importance; low performance (lower right quadrant) - Core weaknesses; highest priority.
- Maintain: Low importance; high performance (upper left quadrant) - Relatively well regarded; maintain.
- Be aware: Low importance; low performance (lower left quadrant) - Lower impact; not a priority.
The regression model yielded an R Squared of 0.59 – meaning that 59% of the variation in the overall satisfaction scores can be explained by the service aspects.
Quadrant Chart: Service Aspects as Key Drivers

Category Breakdown
Staff Recommendations and Breakdown:
- Reinforce: These are the core strengths residents perceive about the level and quality of service provided by the Town of View Royal and it is critical to ensure the performance level of these service aspects are maintained. Continue to reinforce and strengthen these core service aspects as they are a source of success. There is only one service aspect that falls into this quadrant:
- Parks and trails
- Focus: These are areas that residents perceive are not performing as well in terms of the level and quality of service provided by the Town of View Royal and it is important to focus on them to improve overall satisfaction. The service aspects in this quadrant are key opportunities and key drivers of residents’ overall satisfaction, and should be given the highest priority. There is only one service aspect in this quadrant:
- Road maintenance
- Maintain: These aspects are found to not have a significant impact on the overall satisfaction of the level and quality of services provided by the Town, but they are perceived to be performing relatively well by residents. The performance level of these service aspects should be at a minimum maintained. The service aspects that fall into this quadrant are:
- Water services
- Fire services
- Sewer services
- Juan de Fuca Recreation Centre
- In particular, focus and attention should be given to Water services as this aspect is relatively higher in importance than the other service aspects in this quadrant. It is important to continue to maintain the performance level of this service aspect.
- Be aware: These service aspects should not be a priority for action at this time. However, we would advise monitoring these aspects in case they become more important in the future. The service aspects that fall into this quadrant are:
- Police services
- Town website
- Of note, Police services is relatively high on the importance spectrum compared to all the other service aspects so if time and resources allow, focus can be allocated to maintain or improve the performance of this aspect.
Appendix: Demographics
Base: All respondents (n=401)
| Demographic Category | Weighted % | Unweighted % |
|---|---|---|
| Age | ||
| 18-34 | 22% | 2% |
| 35-54 | 36% | 19% |
| 55+ | 42% | 79% |
| Gender | ||
| Male | 48% | 40% |
| Female | 52% | 60% |
| Household Income | ||
| Under $30,000 | 3% | 5% |
| $30,000 to < $60,000 | 13% | 23% |
| $60,000 to < $90,000 | 19% | 19% |
| $90,000 to < $120,000 | 21% | 15% |
| $120,000 to < $150,000 | 11% | 7% |
| $150,000 or more | 17% | 11% |
| Don't know/Refused | 15% | 19% |
| Number of People in HH | ||
| 1 | 9% | 16% |
| 2 | 35% | 53% |
| 3+ | 55% | 29% |
| Refused | 1% | 1% |
| Children in Household | ||
| Yes | 33% | 16% |
| No | 66% | 83% |
| Refused | 1% | 1% |
| Home Ownership | ||
| Own | 84% | 88% |
| Rent | 16% | 11% |
| Refused | 1% | 1% |
| Demographic Category | Weighted % | Unweighted % |
|---|---|---|
| Employment Status | ||
| Employed full-time | 44% | 26% |
| Self-employed | 7% | 7% |
| Employed part-time | 5% | 4% |
| Retired | 35% | 59% |
| Student | 6% | 1% |
| Not currently working | 1% | 1% |
| Other/Refused | 1% | 1% |
| Occupation (among n=153 employed) | ||
| Public sector/Government employee | 28% | 29% |
| Professional or managerial role | 22% | 25% |
| Technical or trades role | 21% | 12% |
| Teaching or health care role | 14% | 16% |
| Service, retail, or tourism | 10% | 10% |
| Other | 5% | 8% |
| Education | ||
| Some high school | 3% | 3% |
| Graduated high school | 17% | 20% |
| Some college or university | 30% | 23% |
| Graduated college or university | 36% | 34% |
| Post-graduate | 13% | 17% |
| Refused | 1% | 2% |
| Years Lived in Town | ||
| Less than 10 years | 30% | 26% |
| 10 to less than 20 years | 37% | 33% |
| 20 to less than 30 years | 14% | 20% |
| 30 years and over | 17% | 20% |
| Don't know/ Refused | <1% | <1% |
Document Images
(32)






Bar chart showing the most important issue facing the community. Traffic Congestion/Traffic Flow/Safety is the leading issue at 41%.


Bar chart showing reasons why residents say the overall quality of life in the Town of View Royal is good or very good. Top reason is Central location/Close to facilities at 33%.

Bar chart showing satisfaction with the overall level and quality of services provided by the Town of View Royal. 58% are 'Very satisfied' and 33% are 'Somewhat satisfied', totaling 90%.

Pie chart showing that 68% of Town residents report having personally contacted or dealt with a Town employee within the past year.

Chart showing satisfaction with various elements of contact with Town staff. Staff's courteousness received the highest satisfaction at 89%.

Pie chart showing opinions on the amount of information received from the Town. 78% believe they receive 'Just the right amount'.

Chart showing level of agreement with various statements about Town priorities. Top agreement is for "I can walk to a park from my home" at 98%.

Bar chart showing preferred approach to current service levels and property taxes. 52% prefer to 'Increase taxes - to maintain services at current levels'.

Bar chart showing preferred approach beyond current service levels for enhanced services or future projects. 42% support 'Increase taxes – to maintain services at current levels as well as contribute to reserve funds'.

Bar chart showing preferred funding approach for future large projects. 68% prefer to 'Put aside funds each year'.

Bar chart showing activities or services residents would like to make the Town more liveable. Top mentions include community events (11%) and programs for children & youth (9%).