Attachment 8. Detailed Biophysical Assessment - Thetis Lake RV Park
Comprehensive environmental assessment covering vegetation, wildlife, and aquatic resources on the property.
Thetis Lake RV Park Town of View Royal Detailed Biophysical Assessment
Prepared for: Limona Construction
Prepared by: Cascadia Biological Services 772 Goldstream Ave PO Box Victoria, BC V9B 5S4
February 25th 2019
CONTRACTOR INFORMATION
| Role | Details |
|---|---|
| Project Manager: | Name: Thomas Roy Address: Cascadia Biological Services 772 Goldstream Ave PO Box 27034 Victoria, BC V9B 5S4 Phone: (250) 888-4864 |
| Field crew: | Names: T. Roy, Erica Brotherston |
| Report prepared by: | Names: T. Roy, Erica Brotherston |
| Maps prepared by: | Names: Thomas Roy Address: Cascadia Biological Services Phone: (250) 888-4864 |
| GIS services: | Company: Thomas Roy Address: Cascadia Biological Services Phone: (250) 888-4864 |
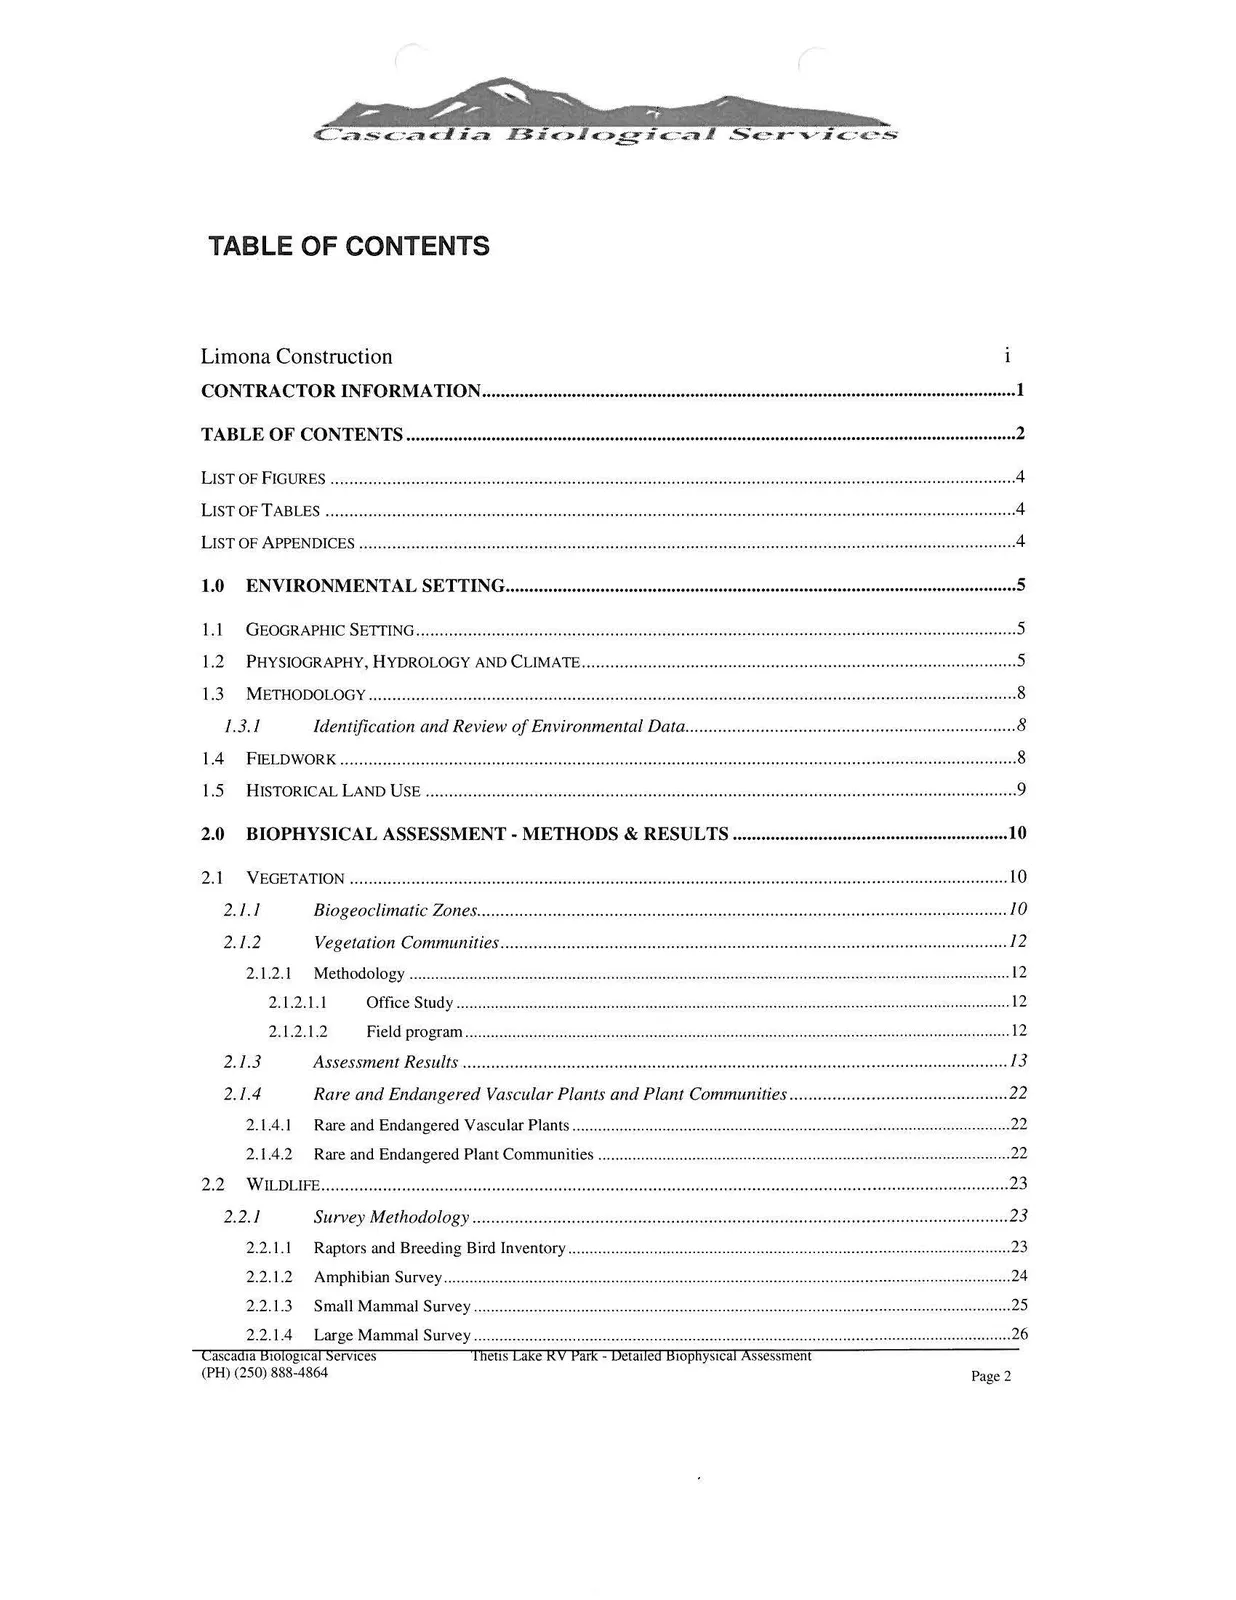
TABLE OF CONTENTS
1.0 ENVIRONMENTAL SETTING 1.1 GEOGRAPHIC SETTING 1.2 PHYSIOGRAPHY, HYDROLOGY AND CLIMATE 1.3 METHODOLOGY 1.3.1 Identification and Review of Environmental Data 1.4 FIELDWORK 1.5 HISTORICAL LAND USE
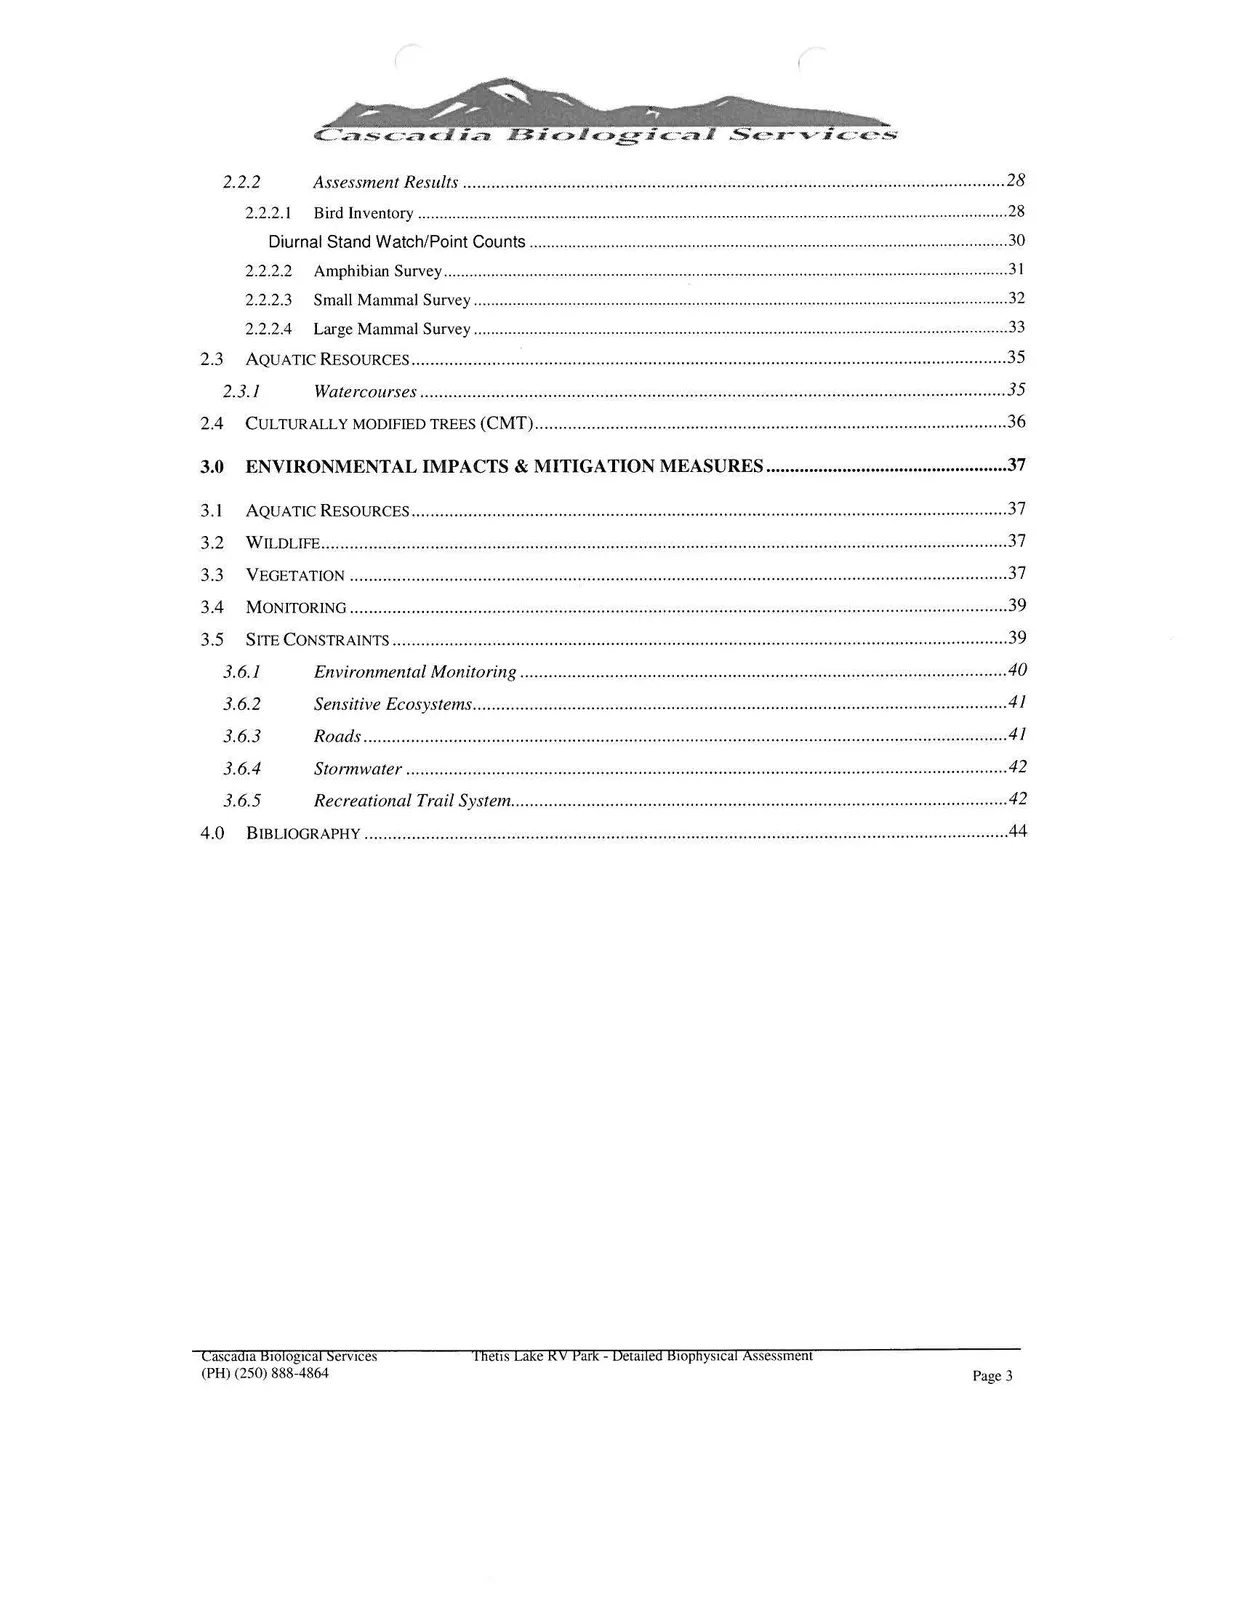
2.0 BIOPHYSICAL ASSESSMENT - METHODS & RESULTS 2.1 VEGETATION 2.1.1 Biogeoclimatic Zones 2.1.2 Vegetation Communities 2.1.2.1 Methodology 2.1.2.1.1 Office Study 2.1.2.1.2 Field program 2.1.3 Assessment Results 2.1.4 Rare and Endangered Vascular Plants and Plant Communities 2.1.4.1 Rare and Endangered Vascular Plants 2.1.4.2 Rare and Endangered Plant Communities 2.2 WILDLIFE 2.2.1 Survey Methodology 2.2.1.1 Raptors and Breeding Bird Inventory 2.2.1.2 Amphibian Survey 2.2.1.3 Small Mammal Survey 2.2.1.4 Large Mammal Survey 2.2.2 Assessment Results 2.2.2.1 Bird Inventory Diurnal Stand Watch/Point Counts 2.2.2.2 Amphibian Survey 2.2.2.3 Small Mammal Survey 2.2.2.4 Large Mammal Survey 2.3 AQUATIC RESOURCES 2.3.1 Watercourses 2.4 CULTURALLY MODIFIED TREES (CMT)
3.0 ENVIRONMENTAL IMPACTS & MITIGATION MEASURES 3.1 AQUATIC RESOURCES 3.2 WILDLIFE 3.3 VEGETATION 3.4 MONITORING 3.5 SITE CONSTRAINTS 3.6.1 Environmental Monitoring 3.6.2 Sensitive Ecosystems 3.6.3 Roads 3.6.4 Stormwater 3.6.5 Recreational Trail System
4.0 BIBLIOGRAPHY
LIST OF FIGURES
Figure 1. Site Overview (Lot in Red) — 7
LIST OF TABLES
Table 1. Vegetation Typically Occurring Within the Moist Maritime Coastal Douglas-fir Subzone (CDFmm) — 10 Table 2. Quadrat #1 - Rocky Outcrop/Woodland Ecosystem — 15 Table 3. Quadrat #2 - Disturbed Ecosystem — 18 Table 4. Quadrat #3 - Coniferous/Mixed Older Second Generation — 20 Table 5. Summary Table of Passerine Bird Survey — 29 Table 6. Species Abundance and Diversity Along Each Transect — 30 Table 7. Amphibians Encountered During Time Constraint and Systematic Searches — 32 Table 8. Results of Live Small Mammal Trapping — 33 Table 9. Impact Summary Table. — 38
LIST OF APPENDICES
Appendix A - Biophysical Map Appendix B - Environmental Opportunities Map Appendix C - BCCDC Rare Vertebrates (South Island) Appendix D - BCCDC Rare Vascular Plants (South Island) Appendix E - BCCDC Rare Plant Communities (South Island) Appendix F - Biophysical Transect Results Appendix G1 - Sensitive Ecosystems Areas (SEA) Map Appendix G2 - Rare Element Occurrence Map
1.0 ENVIRONMENTAL SETTING
1.1 GEOGRAPHIC SETTING
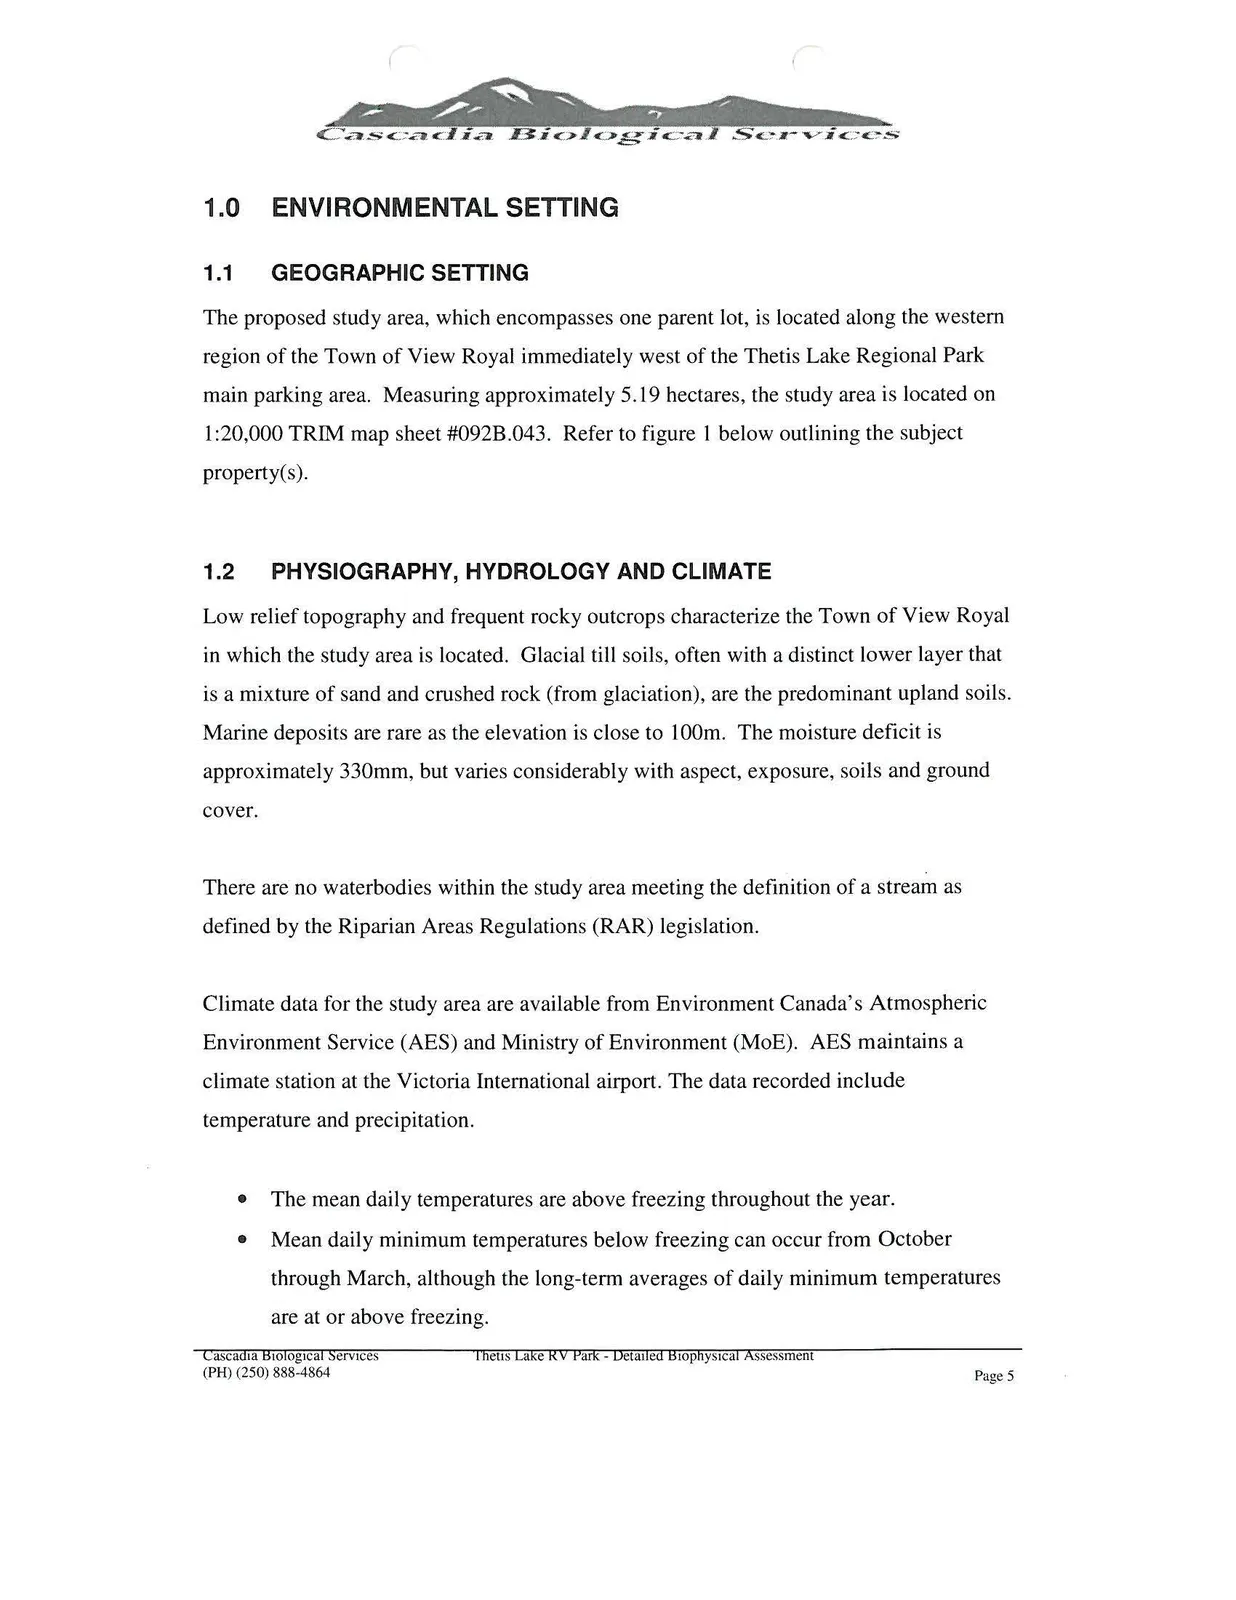
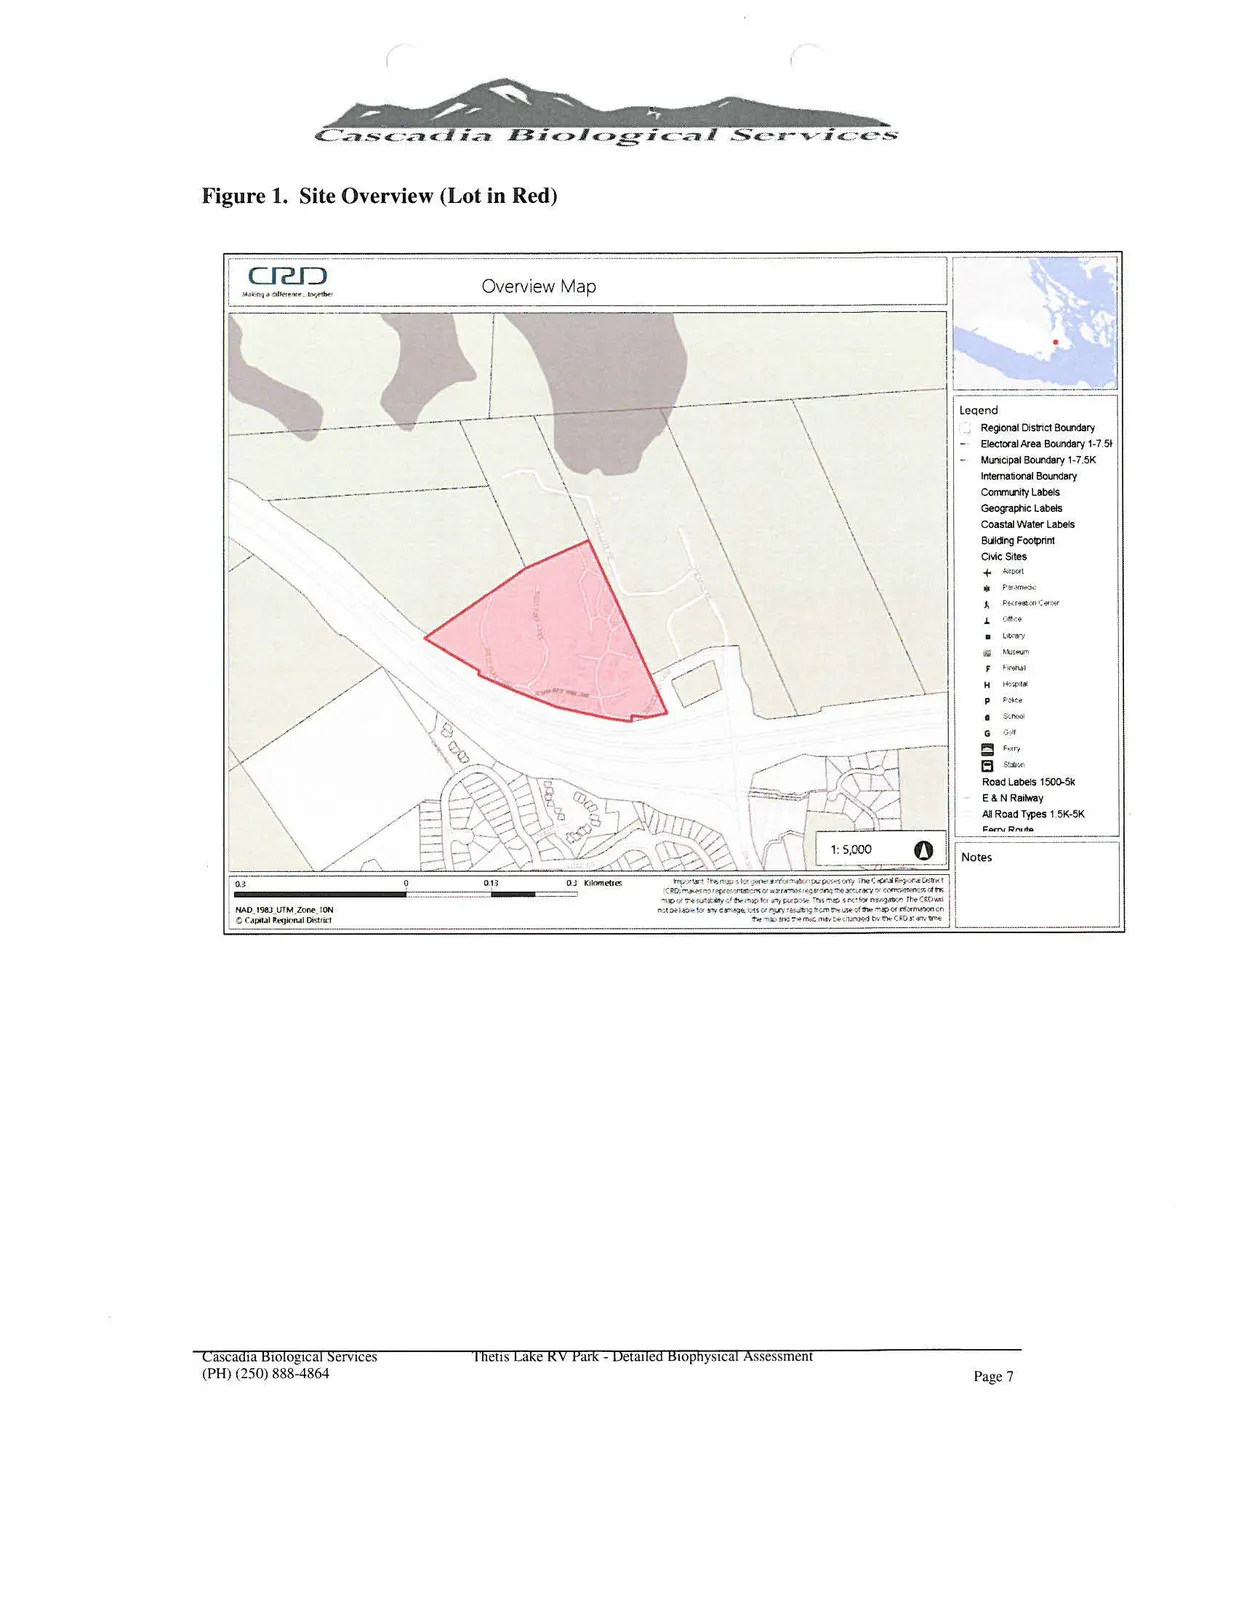
The proposed study area, which encompasses one parent lot, is located along the western region of the Town of View Royal immediately west of the Thetis Lake Regional Park main parking area. Measuring approximately 5.19 hectares, the study area is located on 1:20,000 TRIM map sheet #092B.043. Refer to figure 1 below outlining the subject property(s).
1.2 PHYSIOGRAPHY, HYDROLOGY AND CLIMATE
Low relief topography and frequent rocky outcrops characterize the Town of View Royal in which the study area is located. Glacial till soils, often with a distinct lower layer that is a mixture of sand and crushed rock (from glaciation), are the predominant upland soils. Marine deposits are rare as the elevation is close to 100m. The moisture deficit is approximately 330mm, but varies considerably with aspect, exposure, soils and ground cover.
There are no waterbodies within the study area meeting the definition of a stream as defined by the Riparian Areas Regulations (RAR) legislation.
Climate data for the study area are available from Environment Canada's Atmospheric Environment Service (AES) and Ministry of Environment (MoE). AES maintains a climate station at the Victoria International airport. The data recorded include temperature and precipitation.
- The mean daily temperatures are above freezing throughout the year.
- Mean daily minimum temperatures below freezing can occur from October through March, although the long-term averages of daily minimum temperatures are at or above freezing.
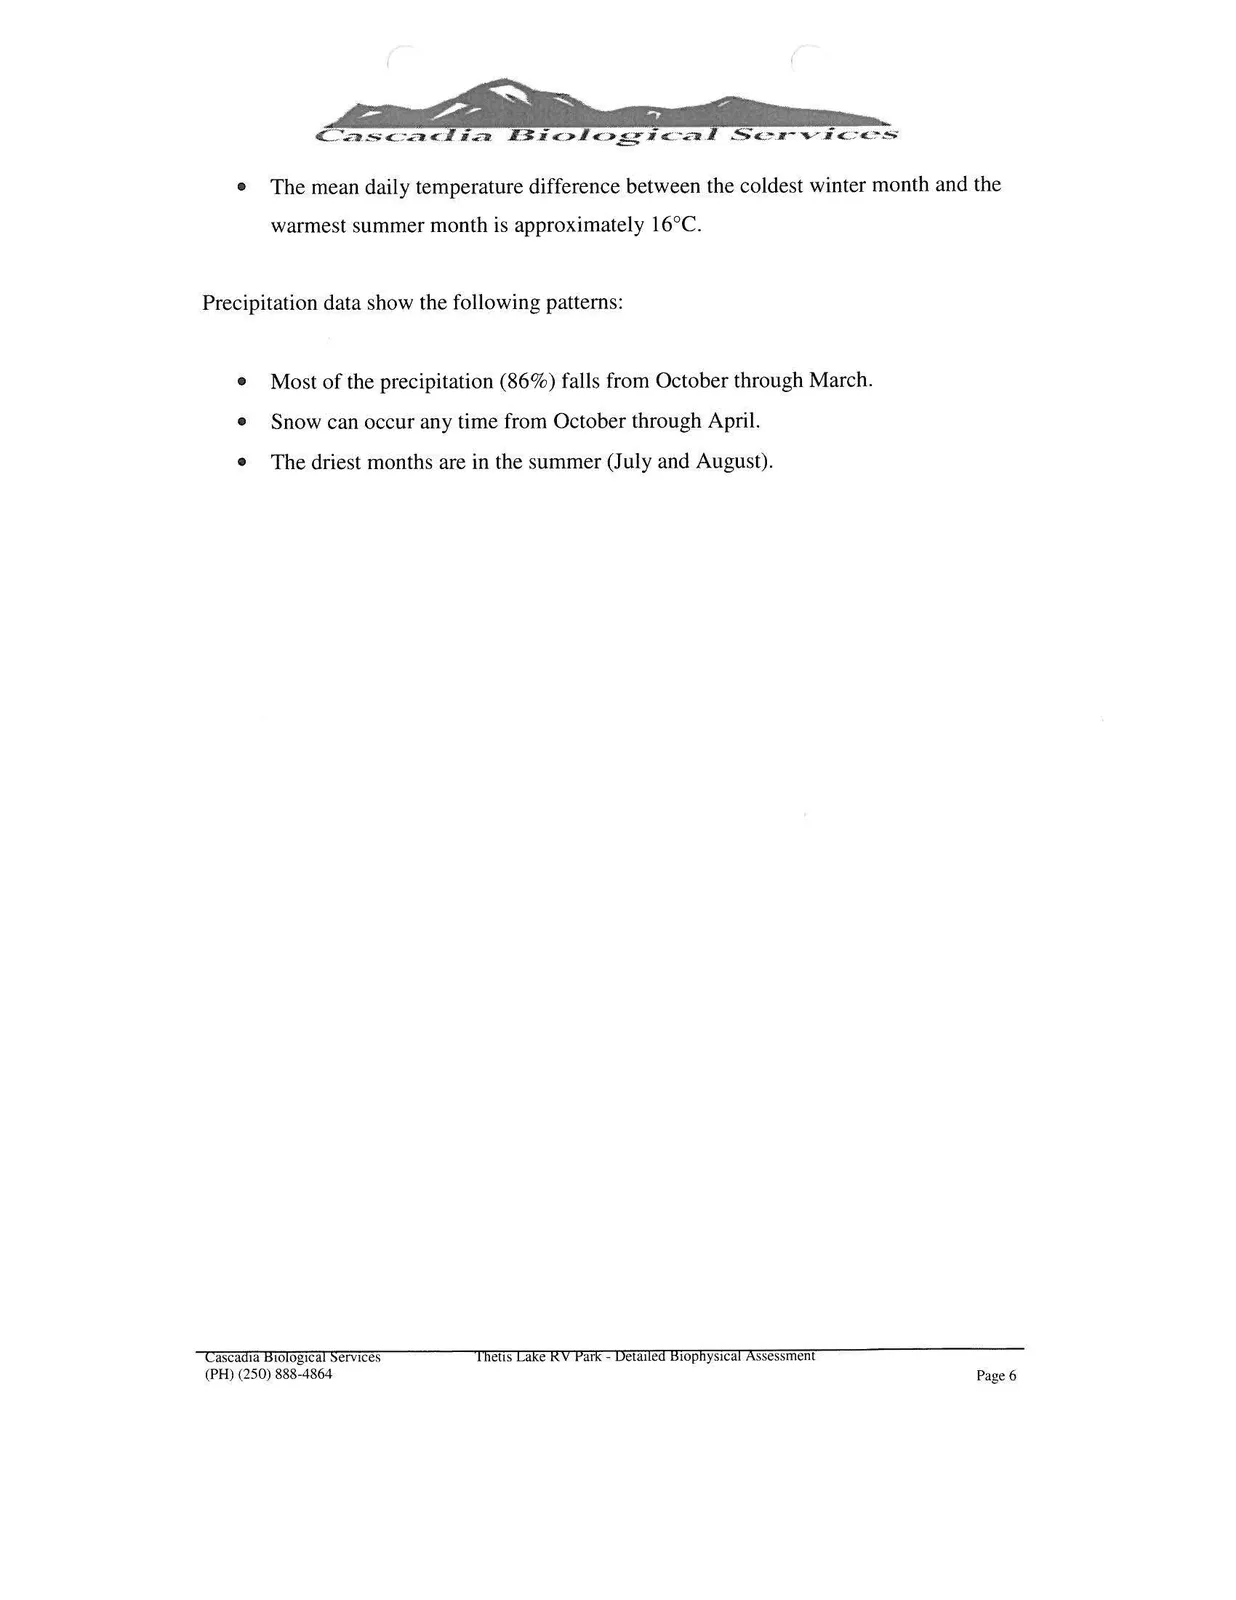
- The mean daily temperature difference between the coldest winter month and the warmest summer month is approximately 16°C.
Precipitation data show the following patterns:
- Most of the precipitation (86%) falls from October through March.
- Snow can occur any time from October through April.
- The driest months are in the summer (July and August).
1.3 METHODOLOGY
1.3.1 Identification and Review of Environmental Data
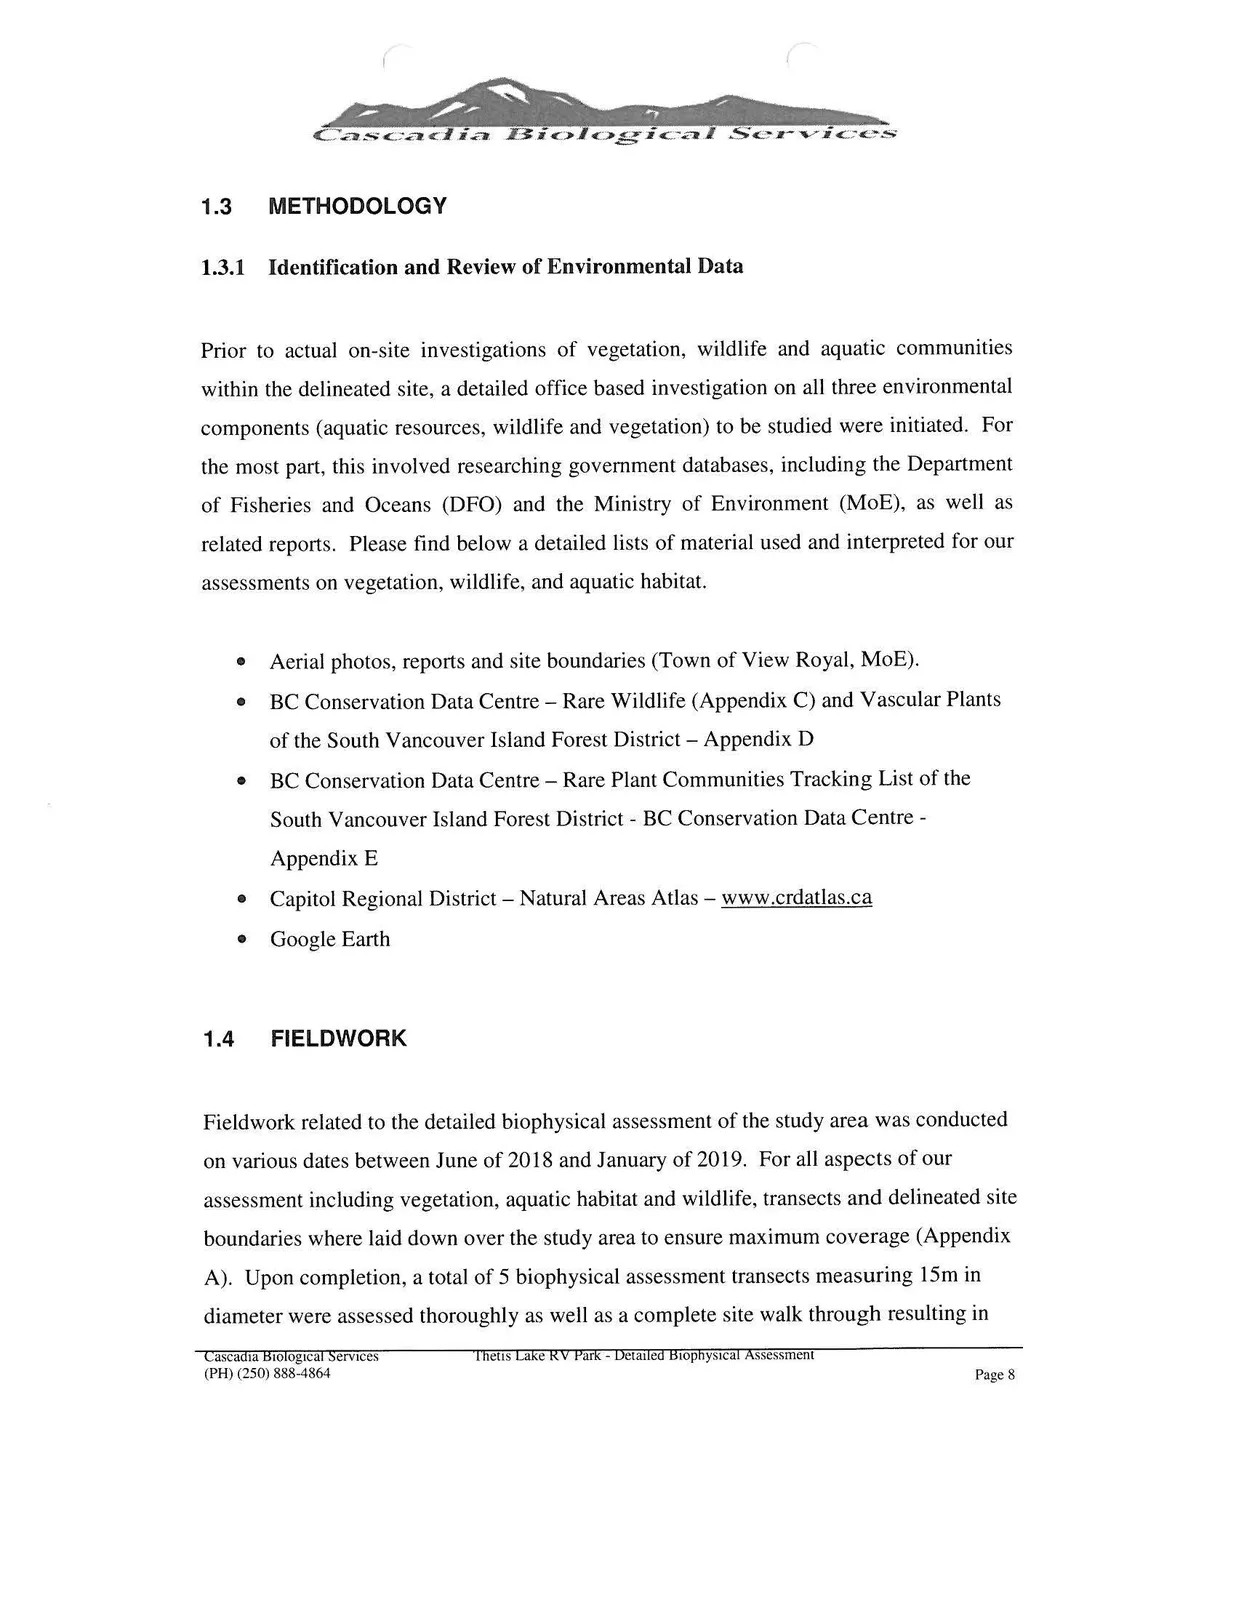
Prior to actual on-site investigations of vegetation, wildlife and aquatic communities within the delineated site, a detailed office based investigation on all three environmental components (aquatic resources, wildlife and vegetation) to be studied were initiated. For the most part, this involved researching government databases, including the Department of Fisheries and Oceans (DFO) and the Ministry of Environment (MoE), as well as related reports. Please find below a detailed lists of material used and interpreted for our assessments on vegetation, wildlife, and aquatic habitat.
- Aerial photos, reports and site boundaries (Town of View Royal, MoE).
- BC Conservation Data Centre - Rare Wildlife (Appendix C) and Vascular Plants of the South Vancouver Island Forest District - Appendix D
- BC Conservation Data Centre - Rare Plant Communities Tracking List of the South Vancouver Island Forest District - BC Conservation Data Centre - Appendix E
- Capitol Regional District - Natural Areas Atlas - www.crdatlas.ca
- Google Earth
1.4 FIELDWORK
Fieldwork related to the detailed biophysical assessment of the study area was conducted on various dates between June of 2018 and January of 2019. For all aspects of our assessment including vegetation, aquatic habitat and wildlife, transects and delineated site boundaries where laid down over the study area to ensure maximum coverage (Appendix A). Upon completion, a total of 5 biophysical assessment transects measuring 15m in diameter were assessed thoroughly as well as a complete site walk through resulting in over 80% coverage of the delineated site. In addition, various biophysical assessments of the site were conducted including but not limited to a vegetation survey, an amphibian survey, small mammal survey, large mammal survey, raptor and blue heron survey and bird inventory. Specific methods relevant to each survey including a breakdown of field equipment are discussed in greater detail in section 2 of this report.
1.5 HISTORICAL LAND USE
Historical land use within the study area has included logging operations in the early 1900's as well as in the 1950. This is evident throughout the property as old logging roads and skidder trails are prevalent throughout. Other documented uses included a camping RV site which ran over 100 serviced spaces for several decades. Present day land uses are primarily limited to small scale residential uses as several of the RV spaces remain occupied.
2.0 BIOPHYSICAL ASSESSMENT - METHODS & RESULTS
2.1 VEGETATION
2.1.1 Biogeoclimatic Zones
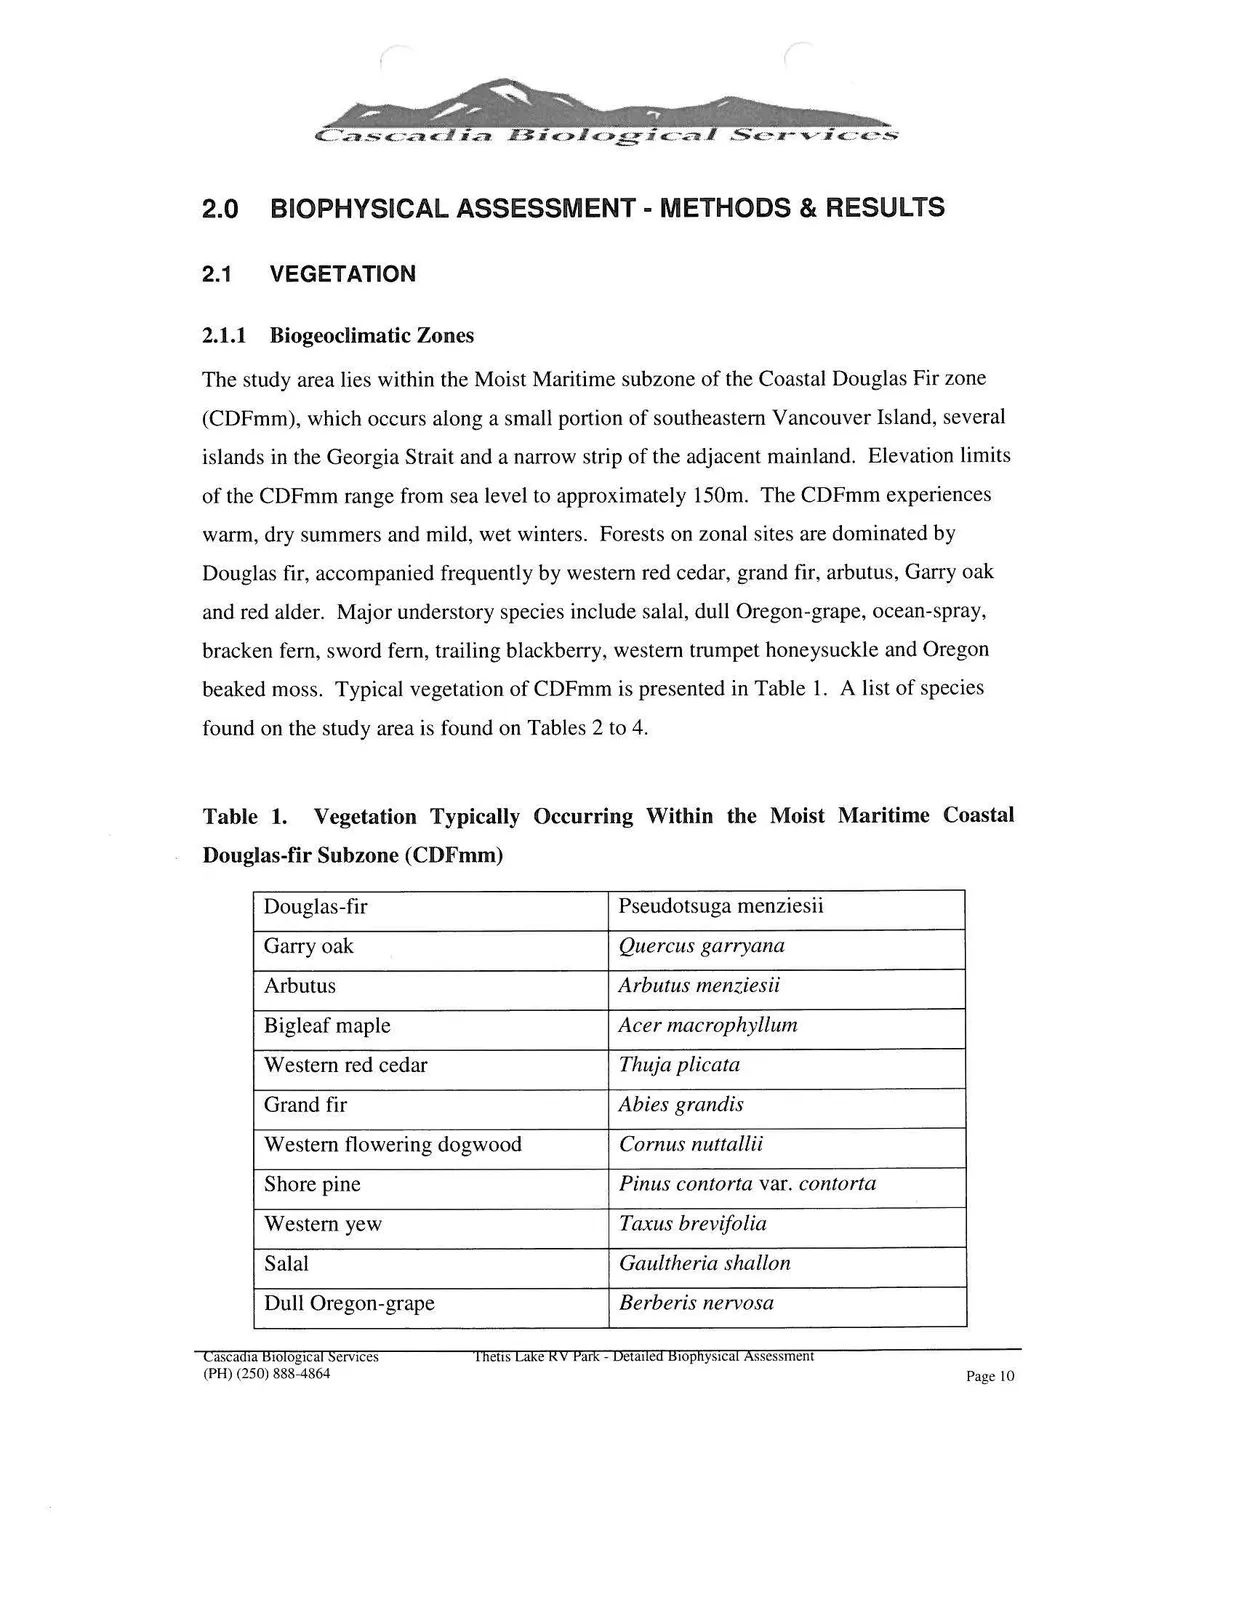
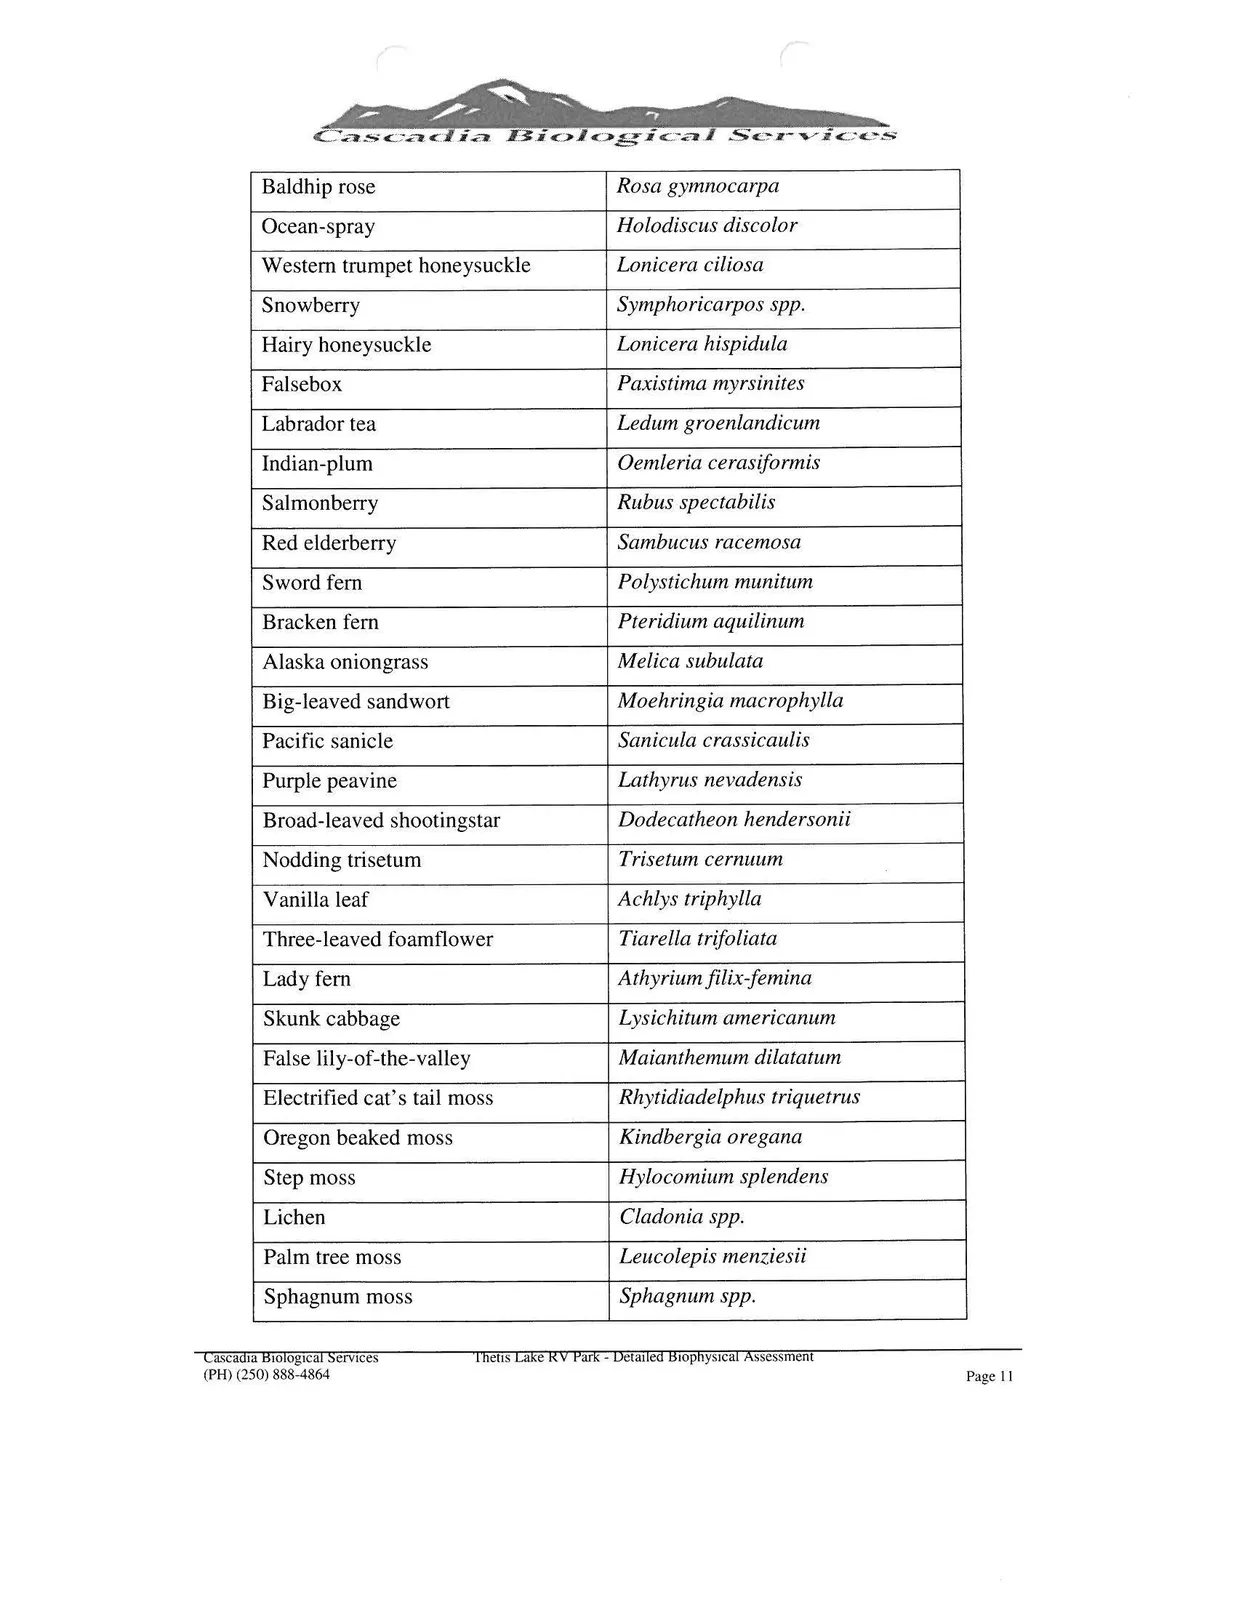
The study area lies within the Moist Maritime subzone of the Coastal Douglas Fir zone (CDFmm), which occurs along a small portion of southeastern Vancouver Island, several islands in the Georgia Strait and a narrow strip of the adjacent mainland. Elevation limits of the CDFmm range from sea level to approximately 150m. The CDFmm experiences warm, dry summers and mild, wet winters. Forests on zonal sites are dominated by Douglas fir, accompanied frequently by western red cedar, grand fir, arbutus, Garry oak and red alder. Major understory species include salal, dull Oregon-grape, ocean-spray, bracken fern, sword fern, trailing blackberry, western trumpet honeysuckle and Oregon beaked moss. Typical vegetation of CDFmm is presented in Table 1. A list of species found on the study area is found on Tables 2 to 4.
Table 1. Vegetation Typically Occurring Within the Moist Maritime Coastal Douglas-fir Subzone (CDFmm)
| Common Name | Scientific Name |
|---|---|
| Douglas-fir | Pseudotsuga menziesii |
| Garry oak | Quercus garryana |
| Arbutus | Arbutus menziesii |
| Bigleaf maple | Acer macrophyllum |
| Western red cedar | Thuja plicata |
| Grand fir | Abies grandis |
| Western flowering dogwood | Cornus nuttallii |
| Shore pine | Pinus contorta var. contorta |
| Western yew | Taxus brevifolia |
| Salal | Gaultheria shallon |
| Dull Oregon-grape | Berberis nervosa |
| Baldhip rose | Rosa gymnocarpa |
| Ocean-spray | Holodiscus discolor |
| Western trumpet honeysuckle | Lonicera ciliosa |
| Snowberry | Symphoricarpos spp. |
| Hairy honeysuckle | Lonicera hispidula |
| Falsebox | Paxistima myrsinites |
| Labrador tea | Ledum groenlandicum |
| Indian-plum | Oemleria cerasiformis |
| Salmonberry | Rubus spectabilis |
| Red elderberry | Sambucus racemosa |
| Sword fern | Polystichum munitum |
| Bracken fern | Pteridium aquilinum |
| Alaska oniongrass | Melica subulata |
| Big-leaved sandwort | Moehringia macrophylla |
| Pacific sanicle | Sanicula crassicaulis |
| Purple peavine | Lathyrus nevadensis |
| Broad-leaved shootingstar | Dodecatheon hendersonii |
| Nodding trisetum | Trisetum cernuum |
| Vanilla leaf | Achlys triphylla |
| Three-leaved foamflower | Tiarella trifoliata |
| Lady fern | Athyrium filix-femina |
| Skunk cabbage | Lysichitum americanum |
| False lily-of-the-valley | Maianthemum dilatatum |
| Electrified cat's tail moss | Rhytidiadelphus triquetrus |
| Oregon beaked moss | Kindbergia oregana |
| Step moss | Hylocomium splendens |
| Lichen | Cladonia spp. |
| Palm tree moss | Leucolepis menziesii |
| Sphagnum moss | Sphagnum spp. |
2.1.2 Vegetation Communities
Information utilized in describing and identifying vegetation communities was obtained through a review of past reports, government databases as well as a five-day field program. Please refer to methodology sections below for study details.
2.1.2.1 Methodology
2.1.2.1.1 Office Study
The office study involved a review of site maps supplied by the client, as well as a review of all relevant maps for the site posted on the regional Sensitive Habitat Inventory (CRD - Natural Areas Atlas). The study area consisted of the study area plus 10m on either side. Other information, maps and aerial photographs reviewed included:
- Air Photo Mosaic (CRD, 2019)
- 1:20,000 TRIM Mapsheet
- Community Mapping Network of BC
- Element Occurrence Report (EOR) from the British Columbia Conservation Data Centre (BC CDC)
2.1.2.1.2 Field program
Cascadia Biological Services conducted field reconnaissance of the site between June 2018 and January 2019 during which time the following tasks were completed.
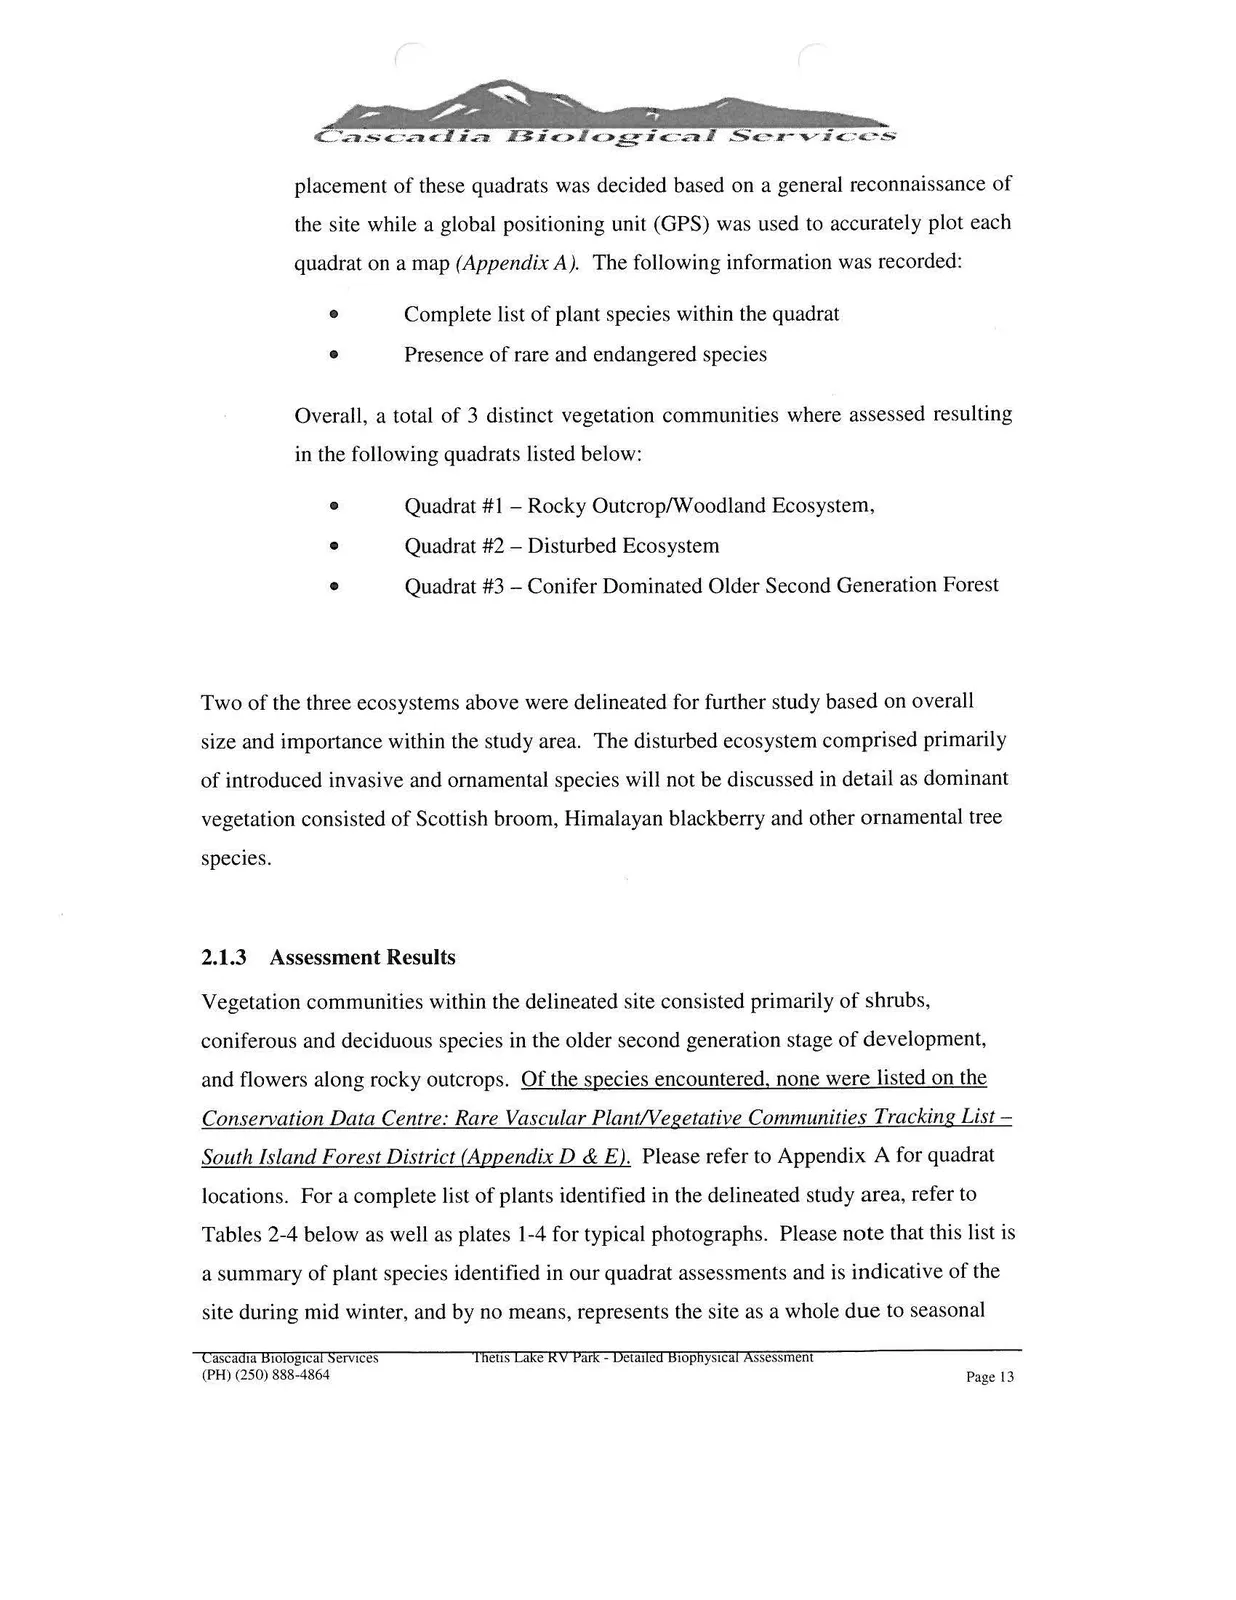
The vegetation of the site was examined by establishing 20 m x 20 m vegetation quadrats within each of the different plant communities. The placement of these quadrats was decided based on a general reconnaissance of the site while a global positioning unit (GPS) was used to accurately plot each quadrat on a map (Appendix A). The following information was recorded:
- Complete list of plant species within the quadrat
- Presence of rare and endangered species
Overall, a total of 3 distinct vegetation communities where assessed resulting in the following quadrats listed below:
- Quadrat #1 - Rocky Outcrop/Woodland Ecosystem,
- Quadrat #2 - Disturbed Ecosystem
- Quadrat #3 - Conifer Dominated Older Second Generation Forest
Two of the three ecosystems above were delineated for further study based on overall size and importance within the study area. The disturbed ecosystem comprised primarily of introduced invasive and ornamental species will not be discussed in detail as dominant vegetation consisted of Scottish broom, Himalayan blackberry and other ornamental tree species.
2.1.3 Assessment Results
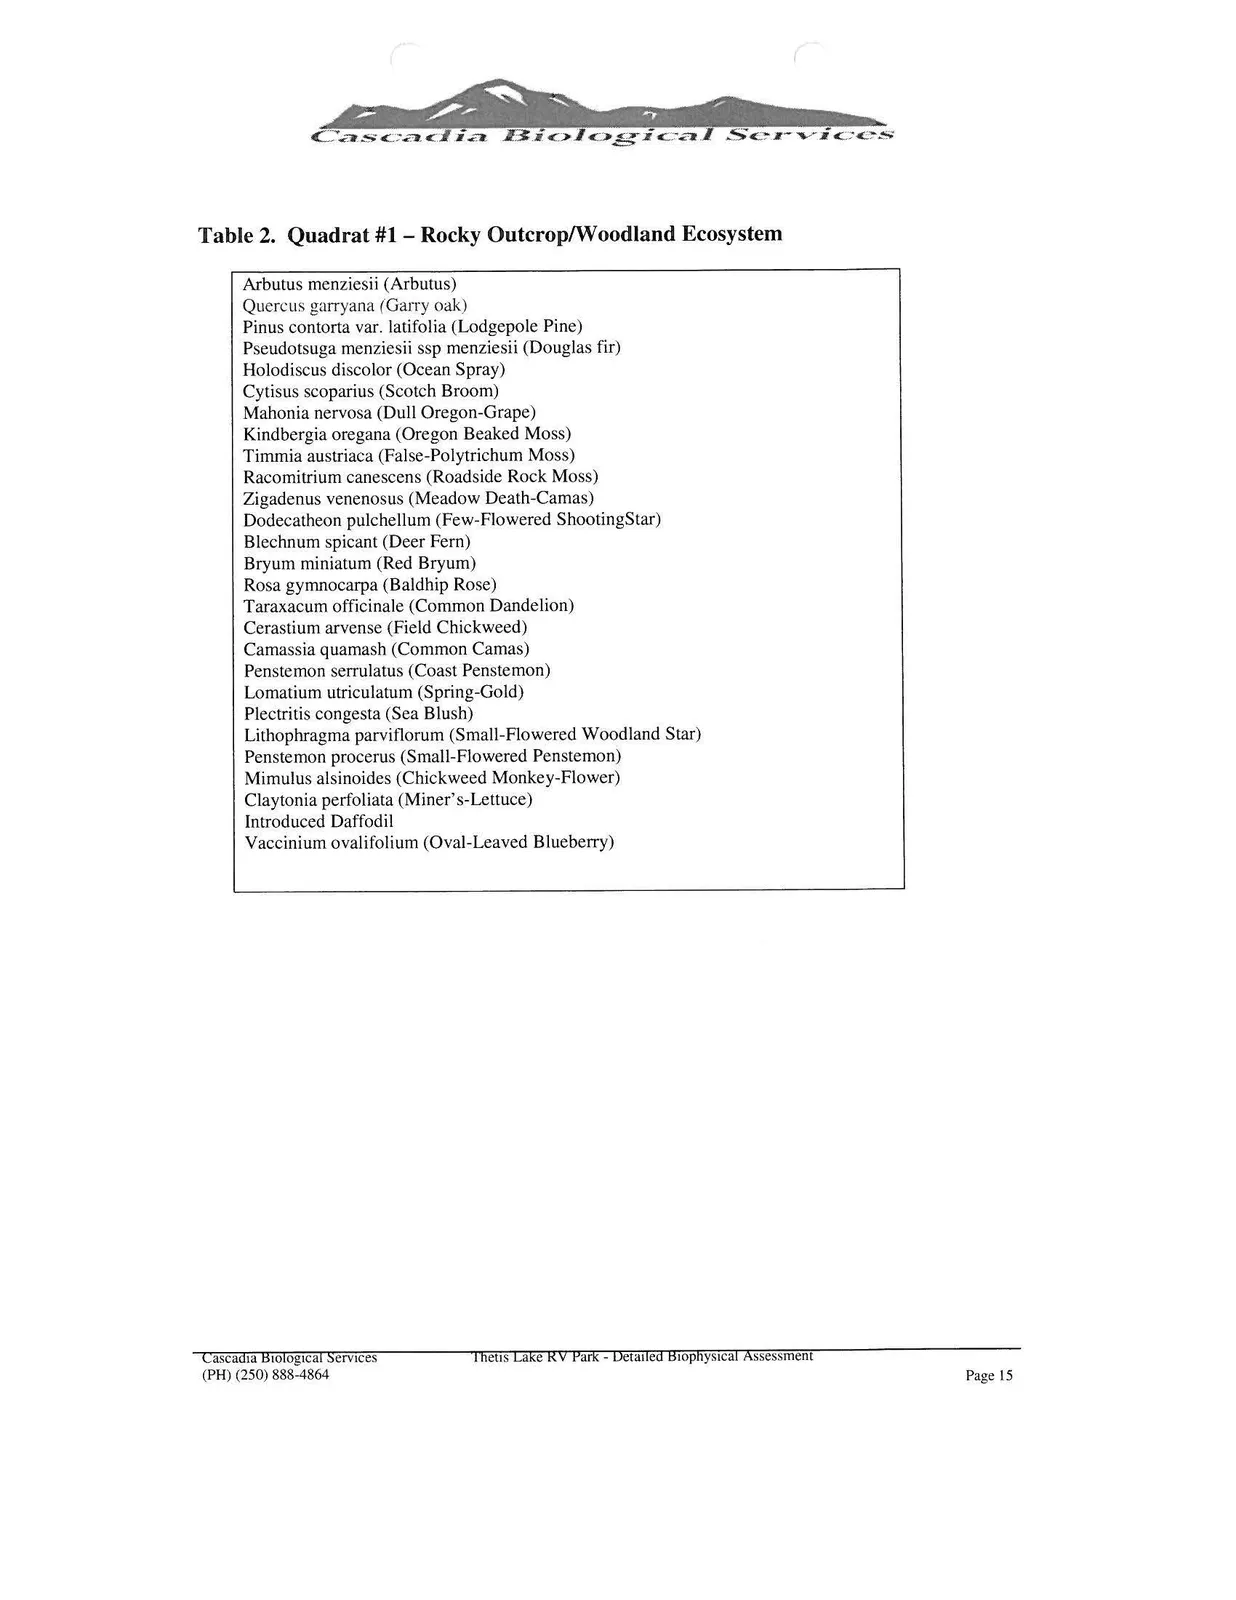
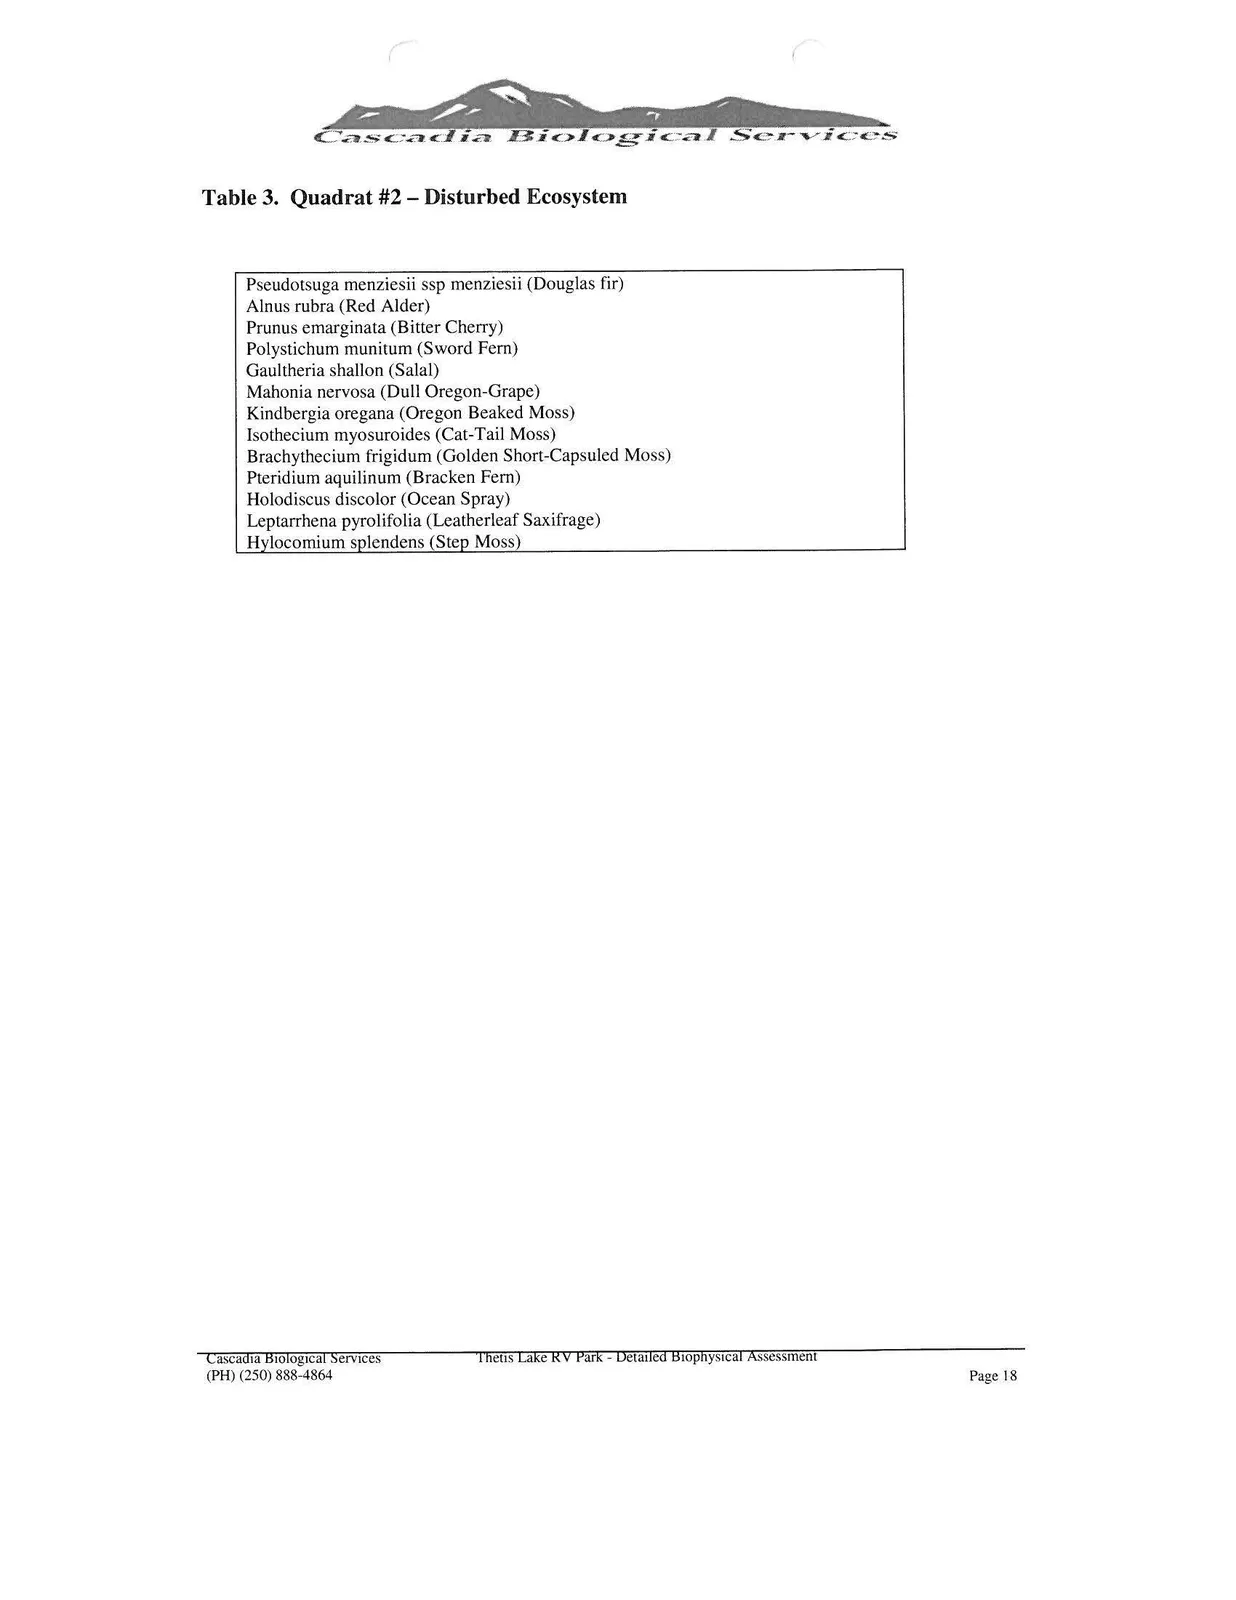
Vegetation communities within the delineated site consisted primarily of shrubs, coniferous and deciduous species in the older second generation stage of development, and flowers along rocky outcrops. Of the species encountered, none were listed on the Conservation Data Centre: Rare Vascular Plant/Vegetative Communities Tracking List - South Island Forest District (Appendix D & E). Please refer to Appendix A for quadrat locations. For a complete list of plants identified in the delineated study area, refer to Tables 2-4 below as well as plates 1-4 for typical photographs. Please note that this list is a summary of plant species identified in our quadrat assessments and is indicative of the site during mid winter, and by no means, represents the site as a whole due to seasonal variability in plant species. As areas of special concern (rocky outcrops, woodland etc.) where often identified immediately outside of the established quadrats, plants species identified during these assessments have been included into the nearest quadrat location.
Table 2. Quadrat #1 - Rocky Outcrop/Woodland Ecosystem
| Species List |
|---|
| Arbutus menziesii (Arbutus) |
| Quercus garryana (Garry oak) |
| Pinus contorta var. latifolia (Lodgepole Pine) |
| Pseudotsuga menziesii ssp menziesii (Douglas fir) |
| Holodiscus discolor (Ocean Spray) |
| Cytisus scoparius (Scotch Broom) |
| Mahonia nervosa (Dull Oregon-Grape) |
| Kindbergia oregana (Oregon Beaked Moss) |
| Timmia austriaca (False-Polytrichum Moss) |
| Racomitrium canescens (Roadside Rock Moss) |
| Zigadenus venenosus (Meadow Death-Camas) |
| Dodecatheon pulchellum (Few-Flowered ShootingStar) |
| Blechnum spicant (Deer Fern) |
| Bryum miniatum (Red Bryum) |
| Rosa gymnocarpa (Baldhip Rose) |
| Taraxacum officinale (Common Dandelion) |
| Cerastium arvense (Field Chickweed) |
| Camassia quamash (Common Camas) |
| Penstemon serrulatus (Coast Penstemon) |
| Lomatium utriculatum (Spring-Gold) |
| Plectritis congesta (Sea Blush) |
| Lithophragma parviflorum (Small-Flowered Woodland Star) |
| Penstemon procerus (Small-Flowered Penstemon) |
| Mimulus alsinoides (Chickweed Monkey-Flower) |
| Claytonia perfoliata (Miner's-Lettuce) |
| Introduced Daffodil |
| Vaccinium ovalifolium (Oval-Leaved Blueberry) |
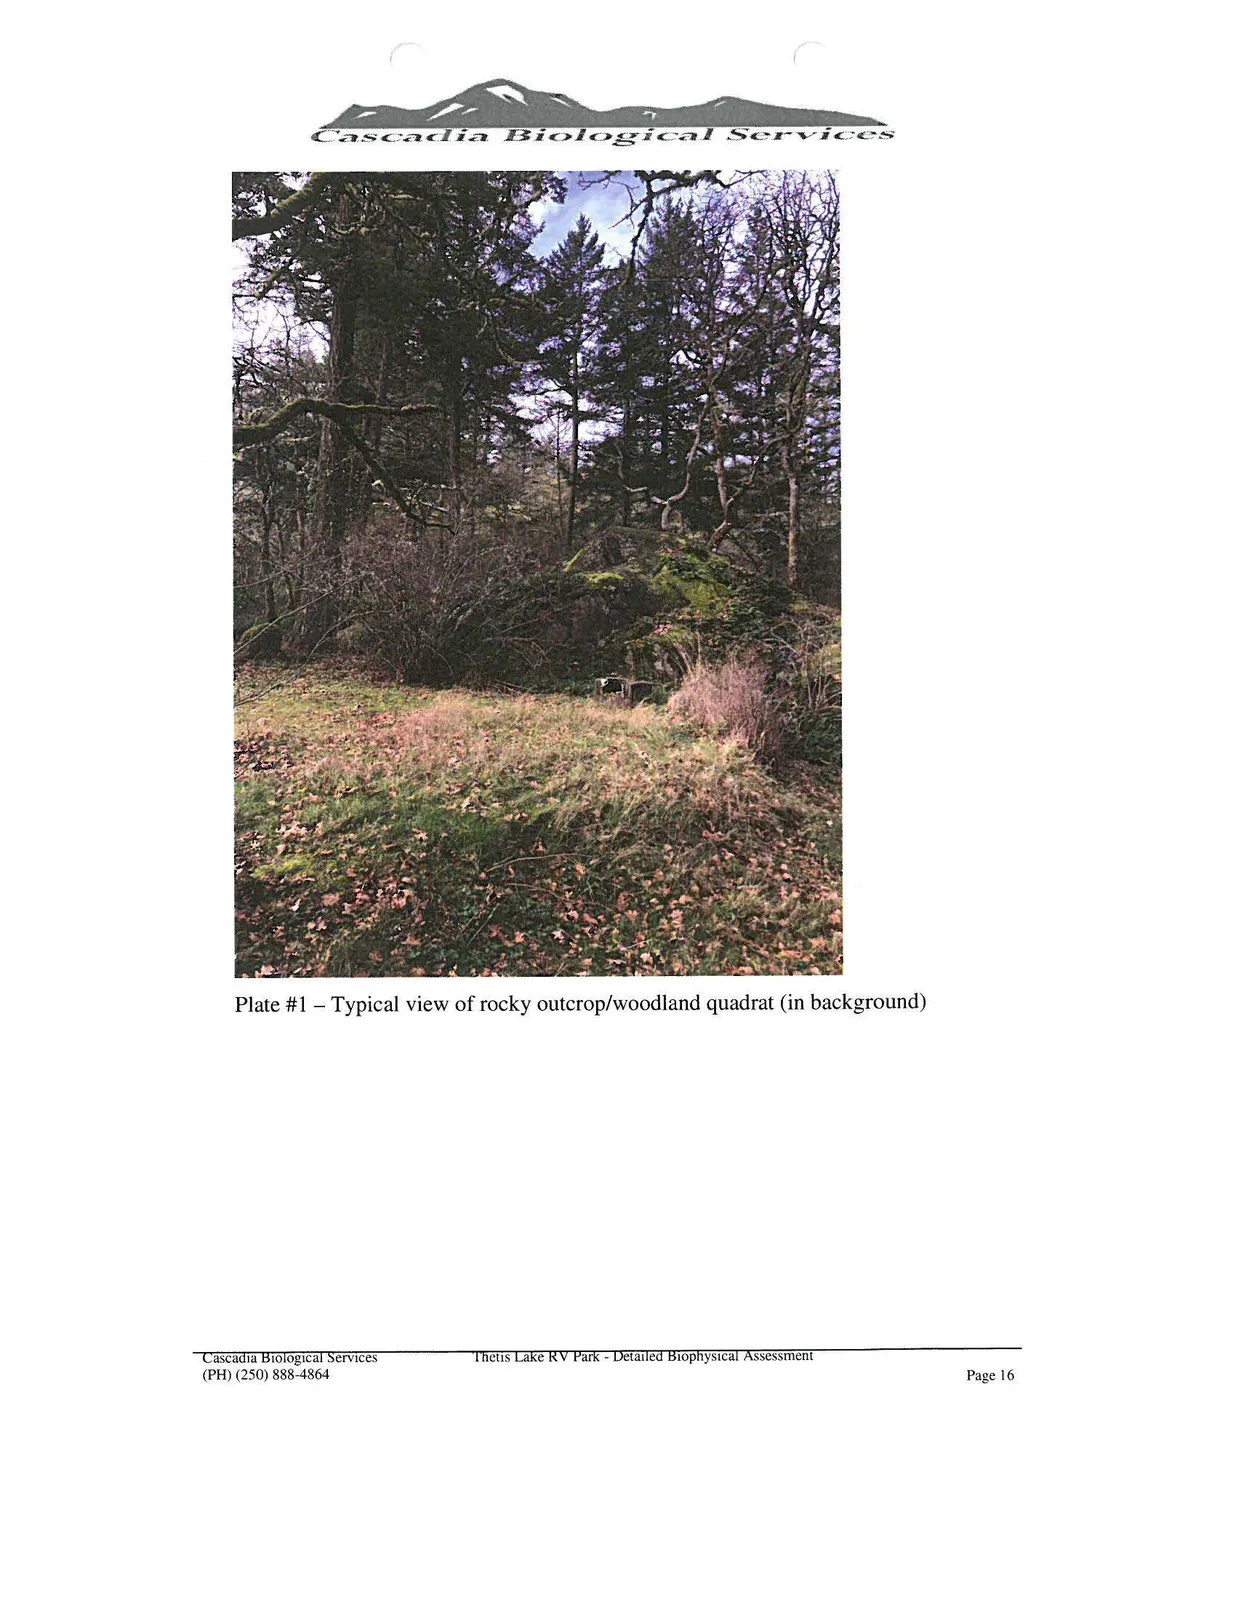
Plate #1 - Typical view of rocky outcrop/woodland quadrat (in background)
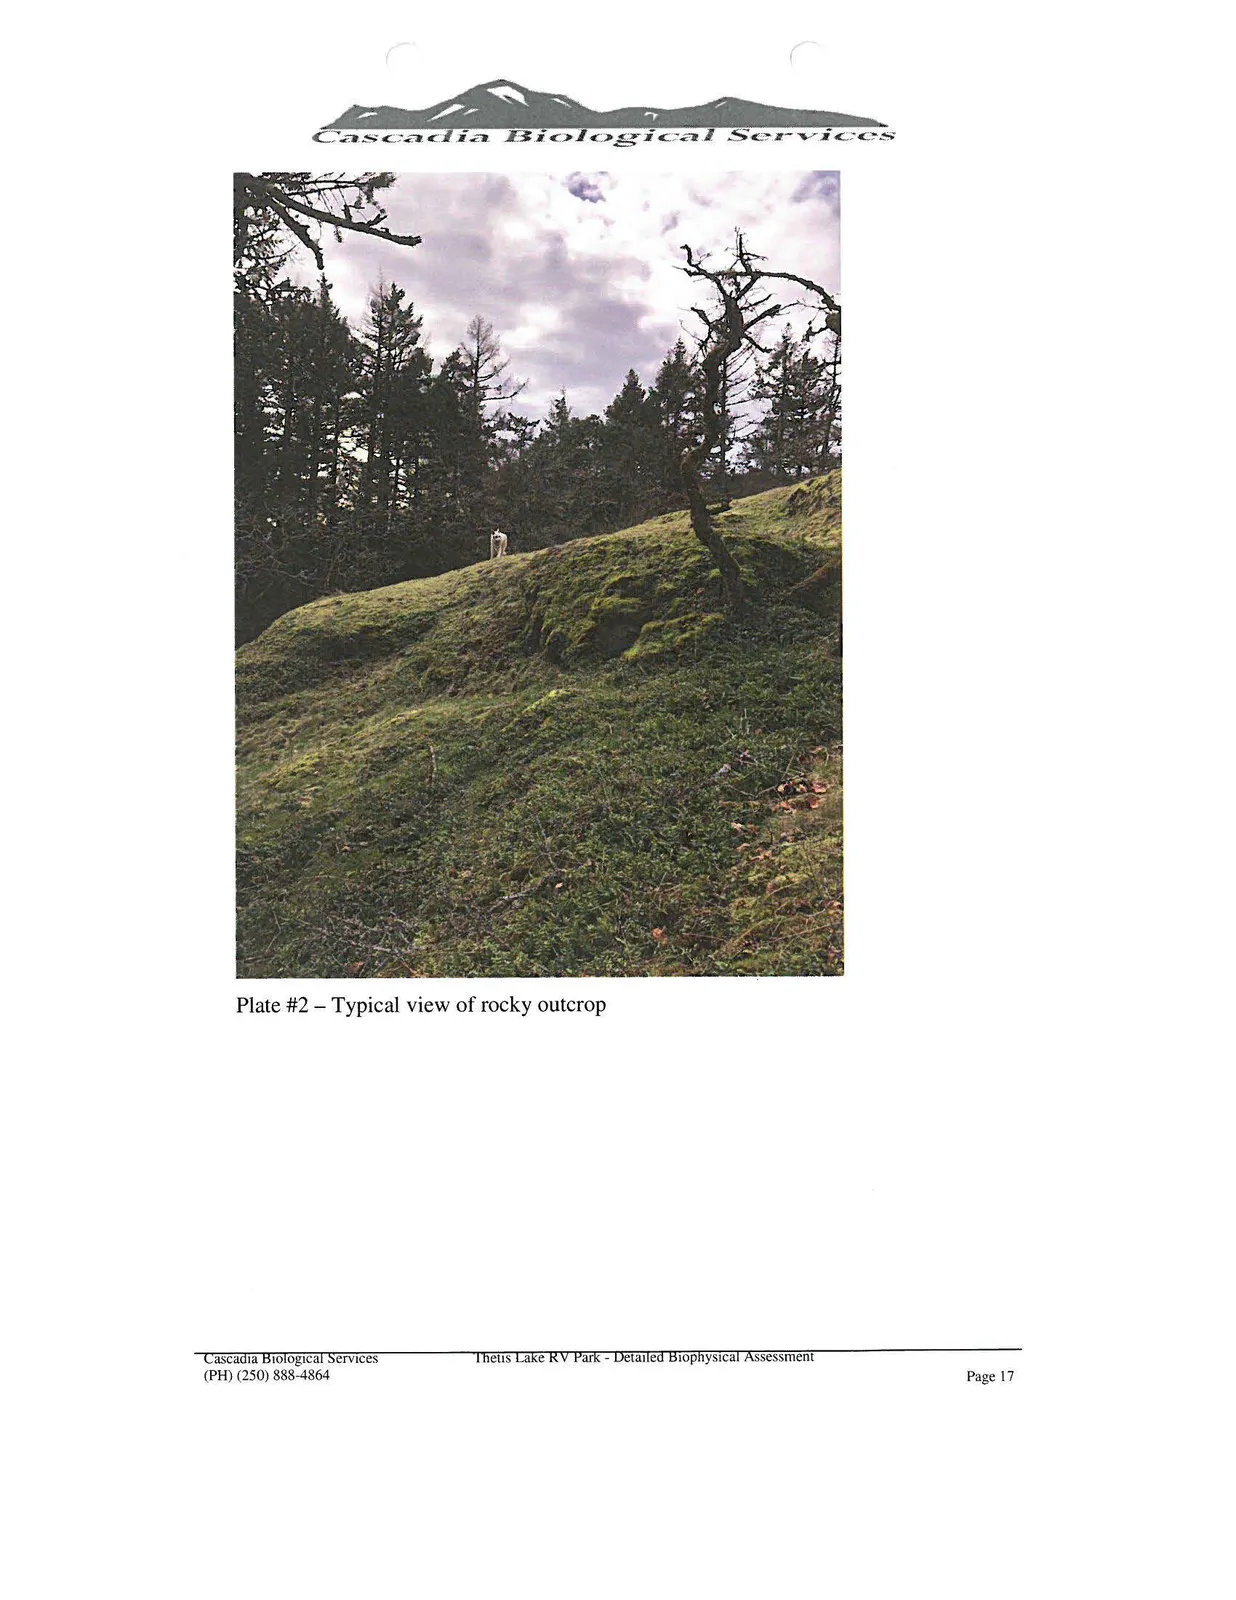
Plate #2 - Typical view of rocky outcrop
Table 3. Quadrat #2 - Disturbed Ecosystem
| Species List |
|---|
| Pseudotsuga menziesii ssp menziesii (Douglas fir) |
| Alnus rubra (Red Alder) |
| Prunus emarginata (Bitter Cherry) |
| Polystichum munitum (Sword Fern) |
| Gaultheria shallon (Salal) |
| Mahonia nervosa (Dull Oregon-Grape) |
| Kindbergia oregana (Oregon Beaked Moss) |
| Isothecium myosuroides (Cat-Tail Moss) |
| Brachythecium frigidum (Golden Short-Capsuled Moss) |
| Pteridium aquilinum (Bracken Fern) |
| Holodiscus discolor (Ocean Spray) |
| Leptarrhena pyrolifolia (Leatherleaf Saxifrage) |
| Hylocomium splendens (Step Moss) |
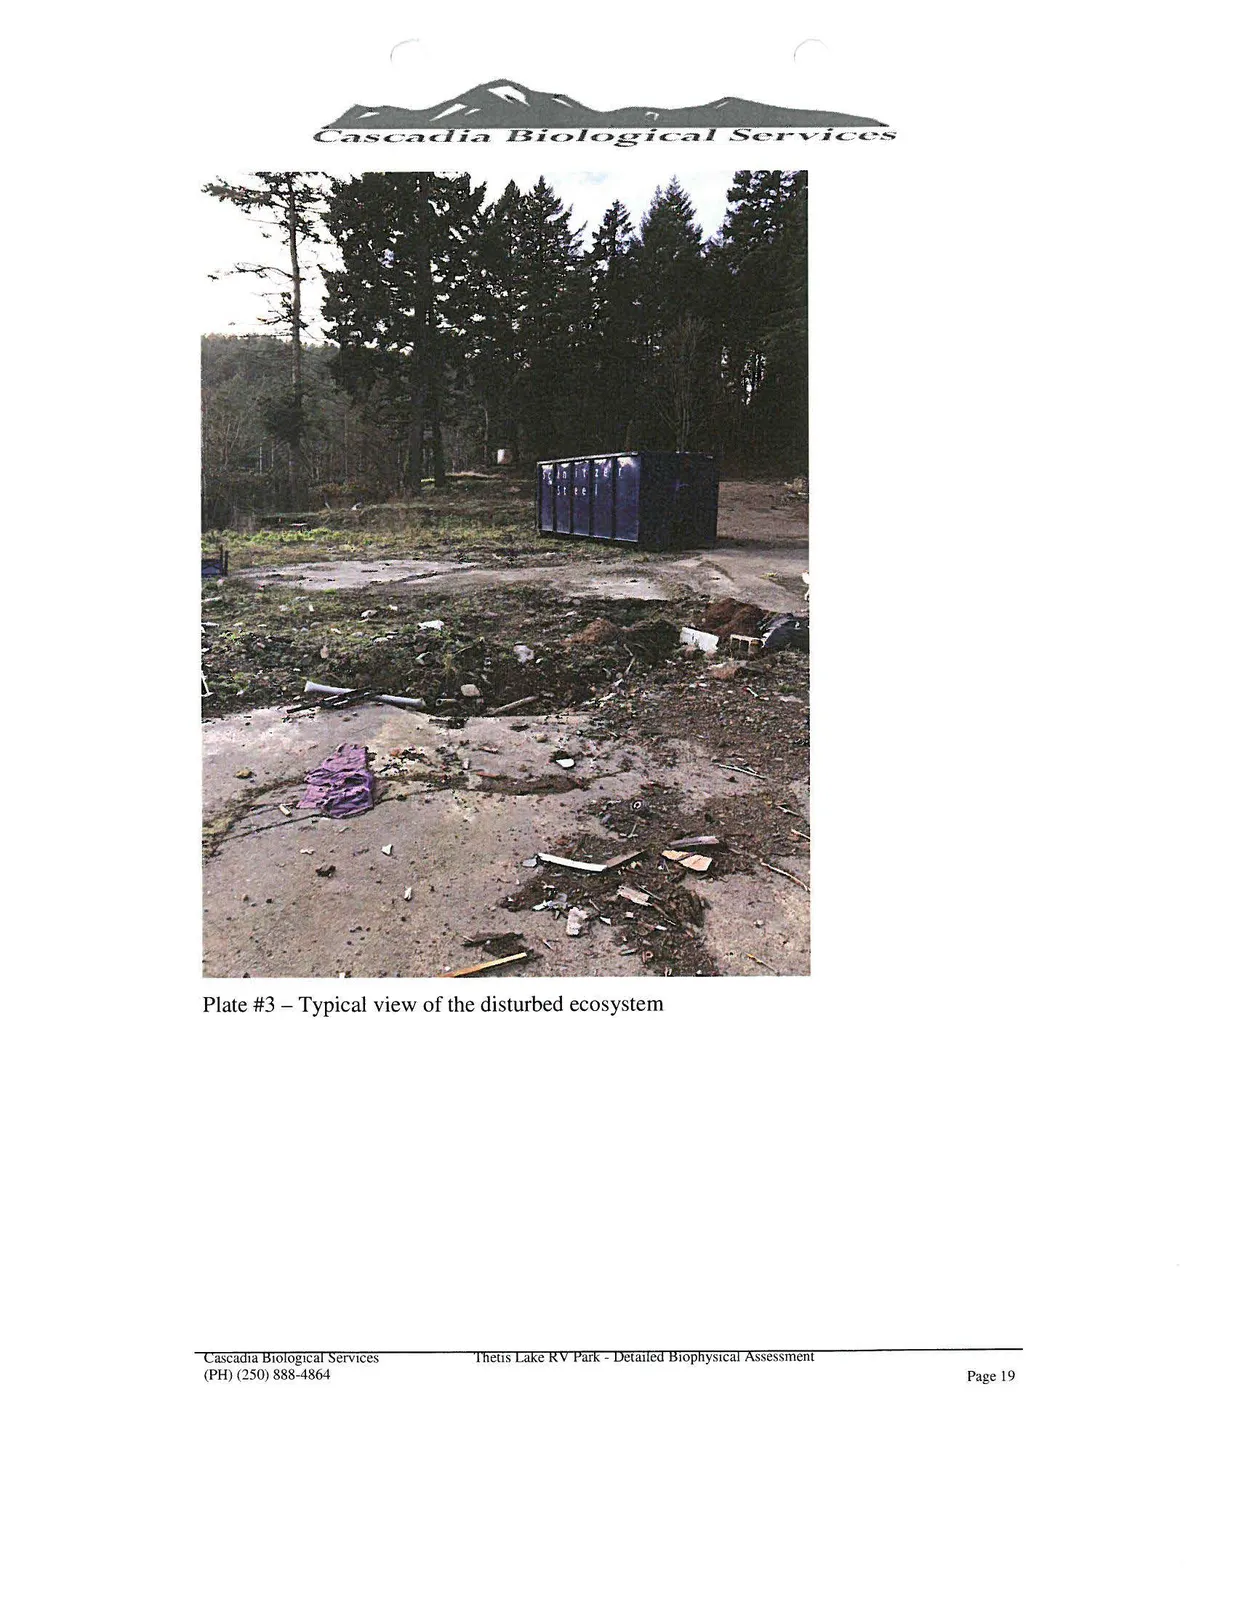
Plate #3 - Typical view of the disturbed ecosystem
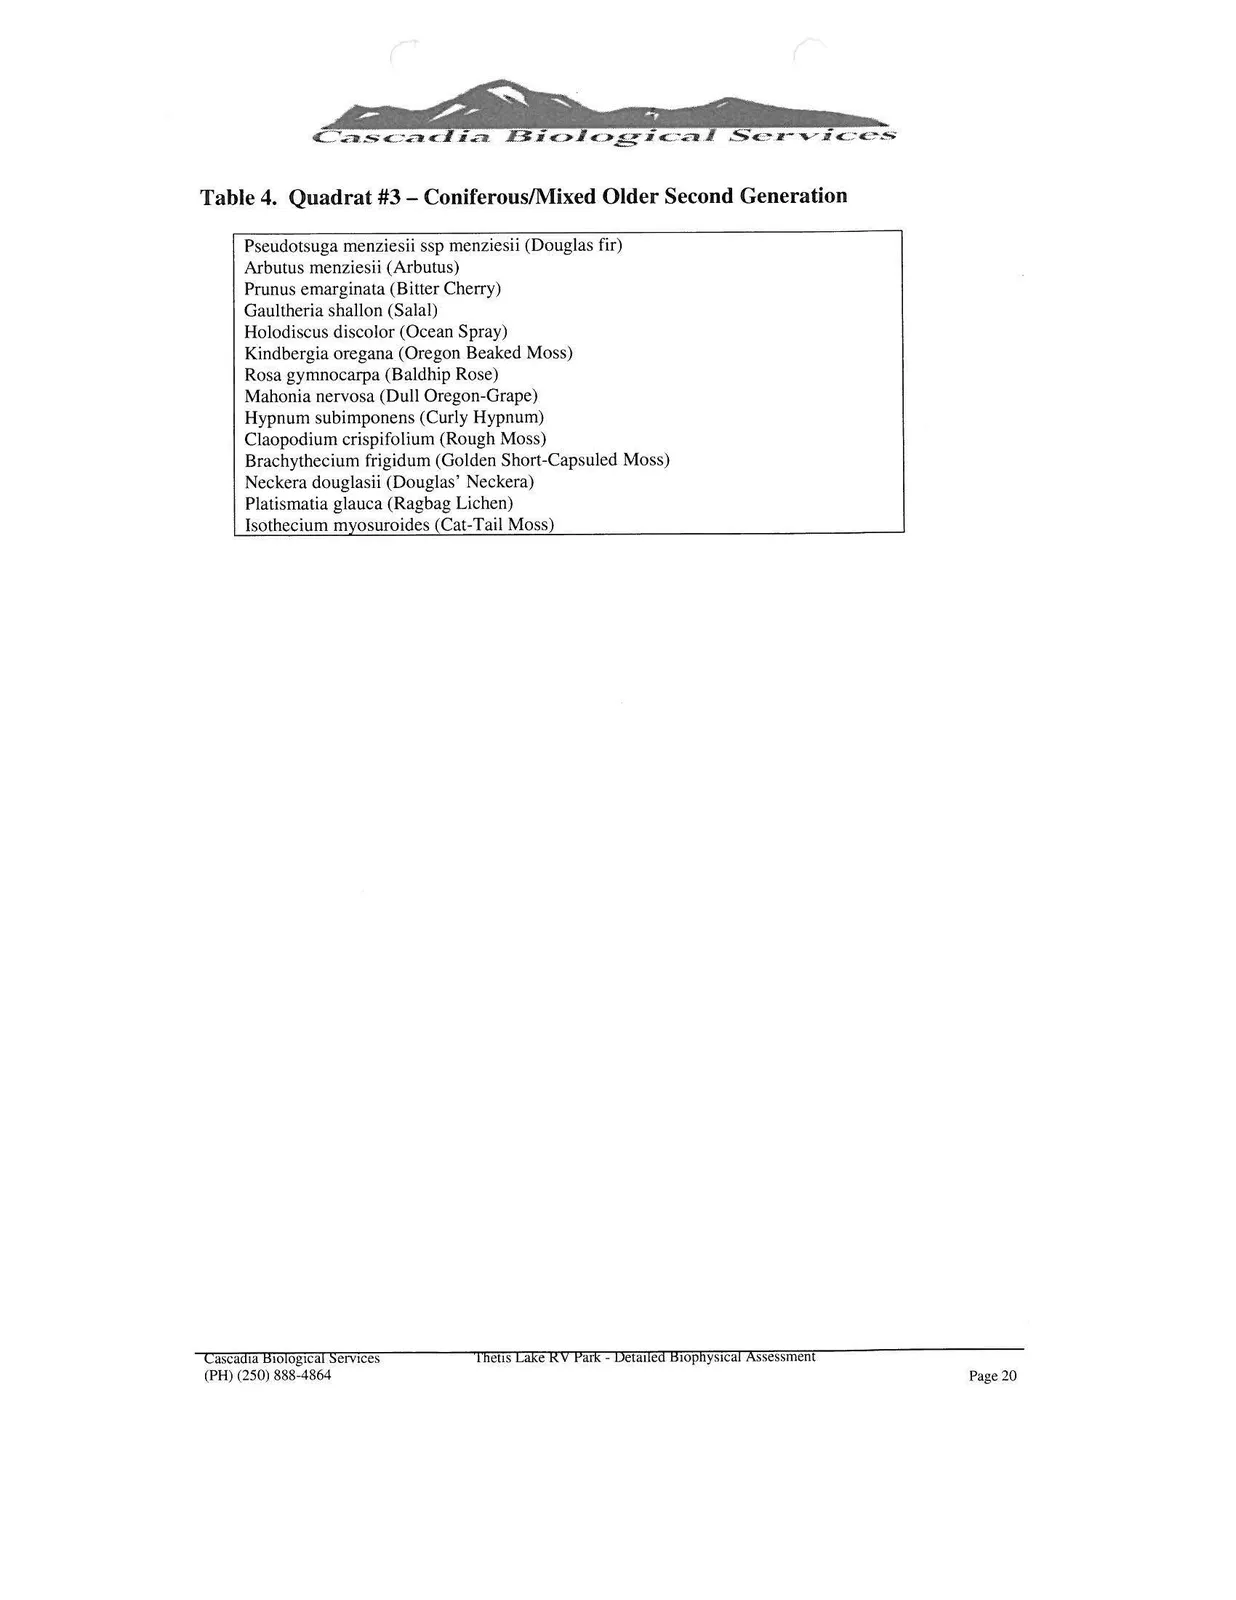
Table 4. Quadrat #3 - Coniferous/Mixed Older Second Generation
| Species List |
|---|
| Pseudotsuga menziesii ssp menziesii (Douglas fir) |
| Arbutus menziesii (Arbutus) |
| Prunus emarginata (Bitter Cherry) |
| Gaultheria shallon (Salal) |
| Holodiscus discolor (Ocean Spray) |
| Kindbergia oregana (Oregon Beaked Moss) |
| Rosa gymnocarpa (Baldhip Rose) |
| Mahonia nervosa (Dull Oregon-Grape) |
| Hypnum subimponens (Curly Hypnum) |
| Claopodium crispifolium (Rough Moss) |
| Brachythecium frigidum (Golden Short-Capsuled Moss) |
| Neckera douglasii (Douglas' Neckera) |
| Platismatia glauca (Ragbag Lichen) |
| Isothecium myosuroides (Cat-Tail Moss) |
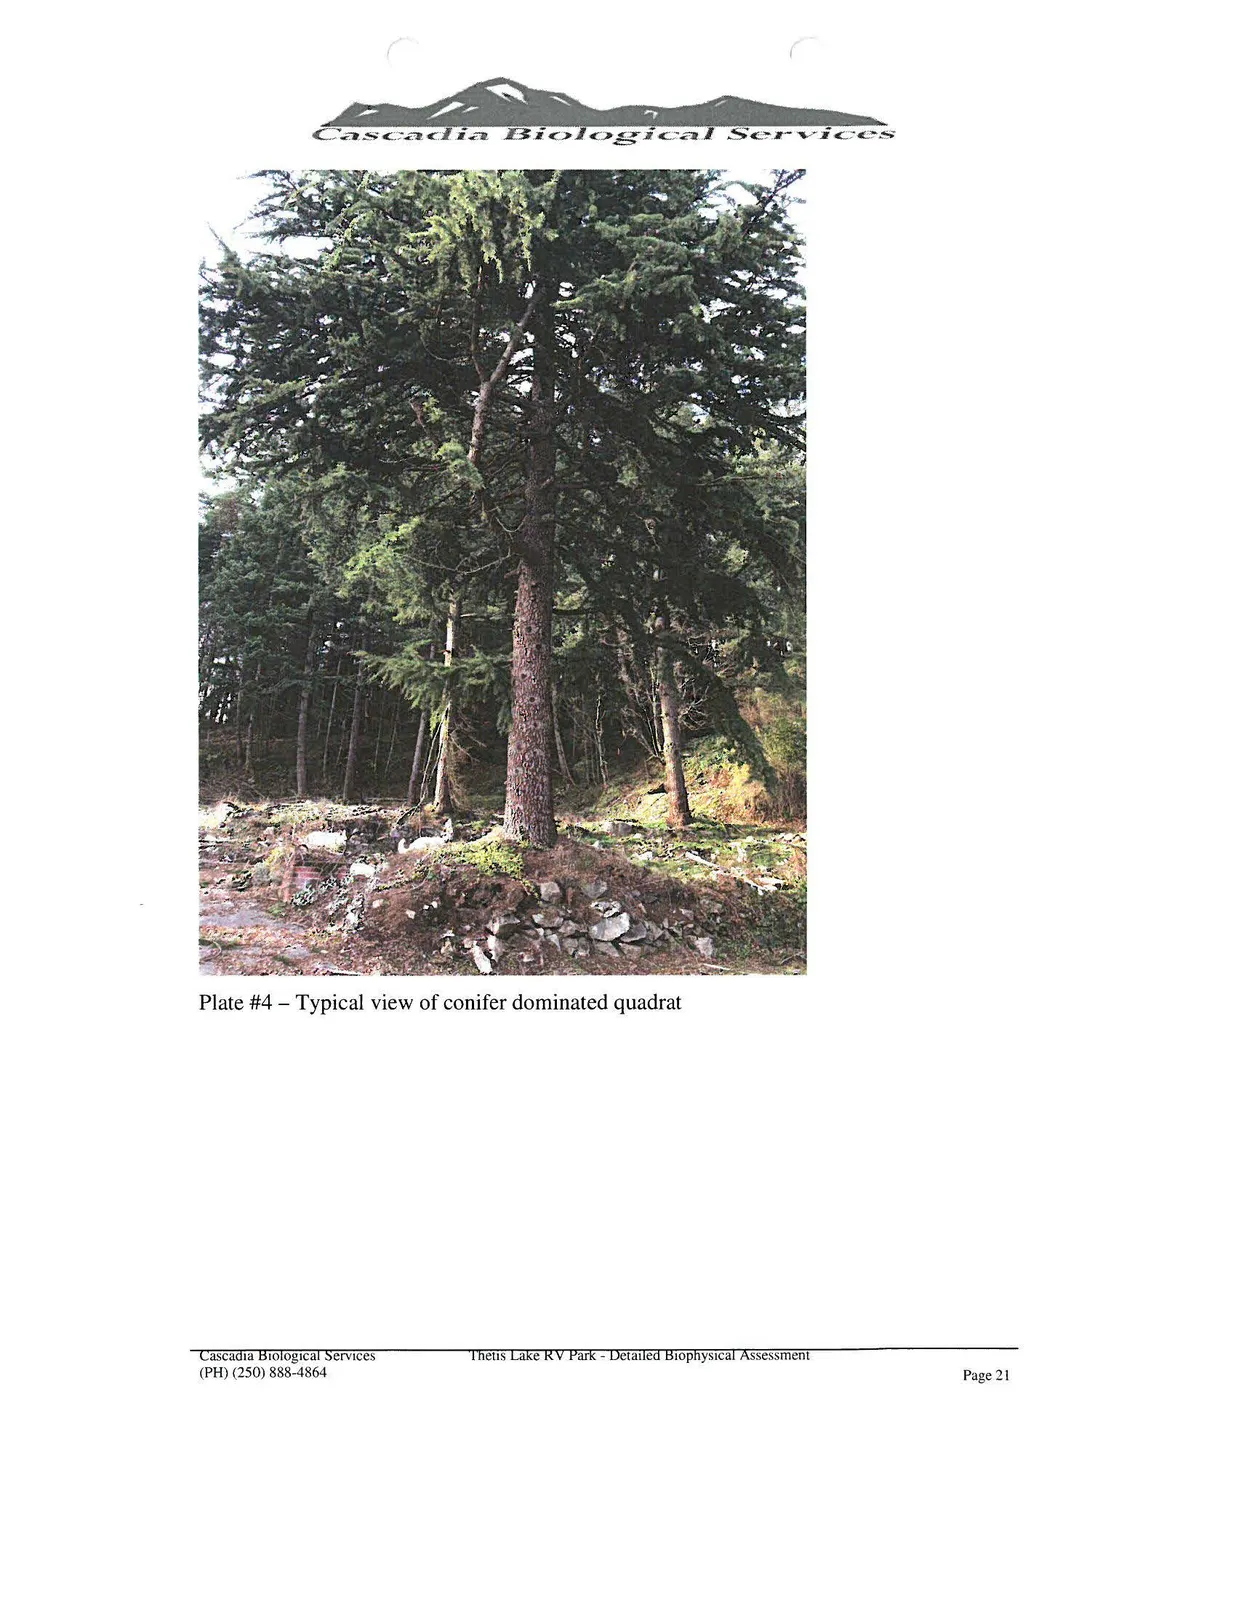
Plate #4 - Typical view of conifer dominated quadrat
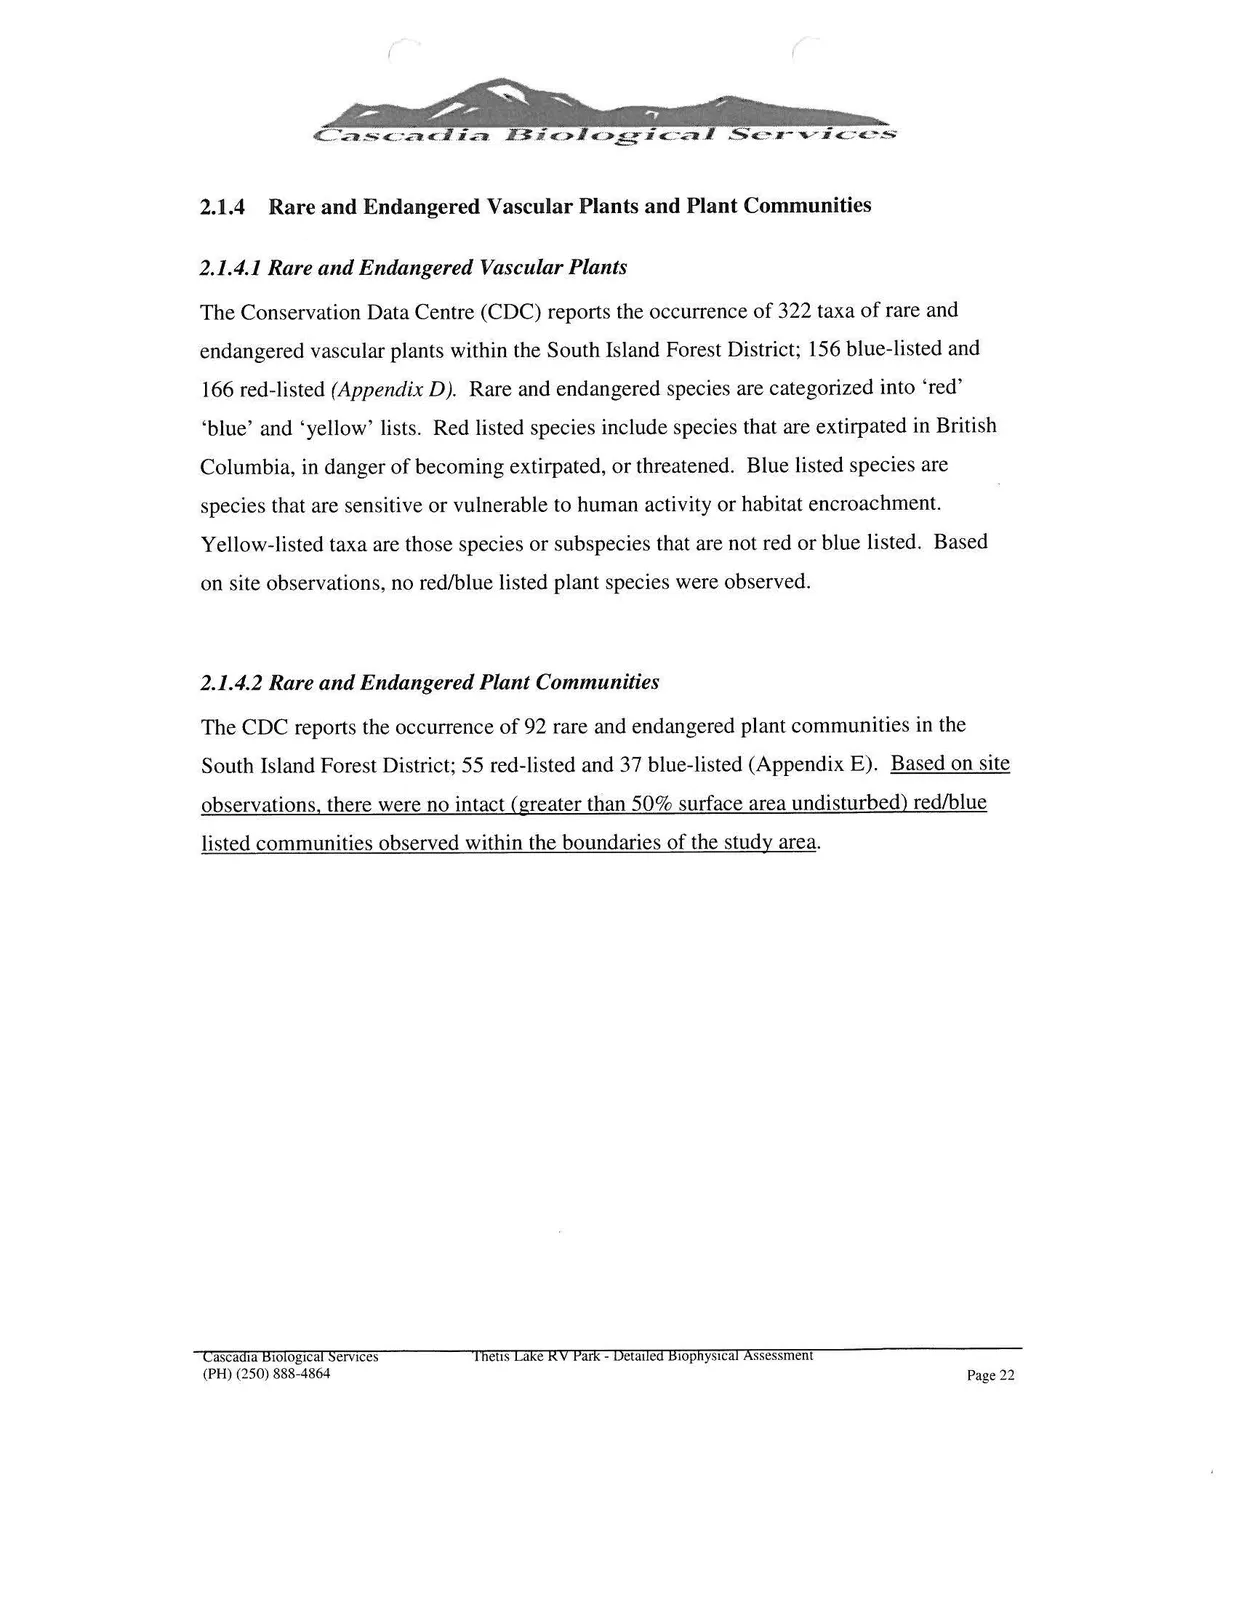
2.1.4 Rare and Endangered Vascular Plants and Plant Communities
2.1.4.1 Rare and Endangered Vascular Plants
The Conservation Data Centre (CDC) reports the occurrence of 322 taxa of rare and endangered vascular plants within the South Island Forest District; 156 blue-listed and 166 red-listed (Appendix D). Rare and endangered species are categorized into 'red', 'blue' and 'yellow' lists. Red listed species include species that are extirpated in British Columbia, in danger of becoming extirpated, or threatened. Blue listed species are species that are sensitive or vulnerable to human activity or habitat encroachment. Yellow-listed taxa are those species or subspecies that are not red or blue listed. Based on site observations, no red/blue listed plant species were observed.
2.1.4.2 Rare and Endangered Plant Communities
The CDC reports the occurrence of 92 rare and endangered plant communities in the South Island Forest District; 55 red-listed and 37 blue-listed (Appendix E). Based on site observations, there were no intact (greater than 50% surface area undisturbed) red/blue listed communities observed within the boundaries of the study area.
2.2 WILDLIFE
2.2.1 Survey Methodology
All wildlife surveys conducted on the subject property were performed as much as possible according to Resource Inventory Committee and/or Canadian Wildlife Service standards where possible. Other information collected included using various government databases and internet searches.
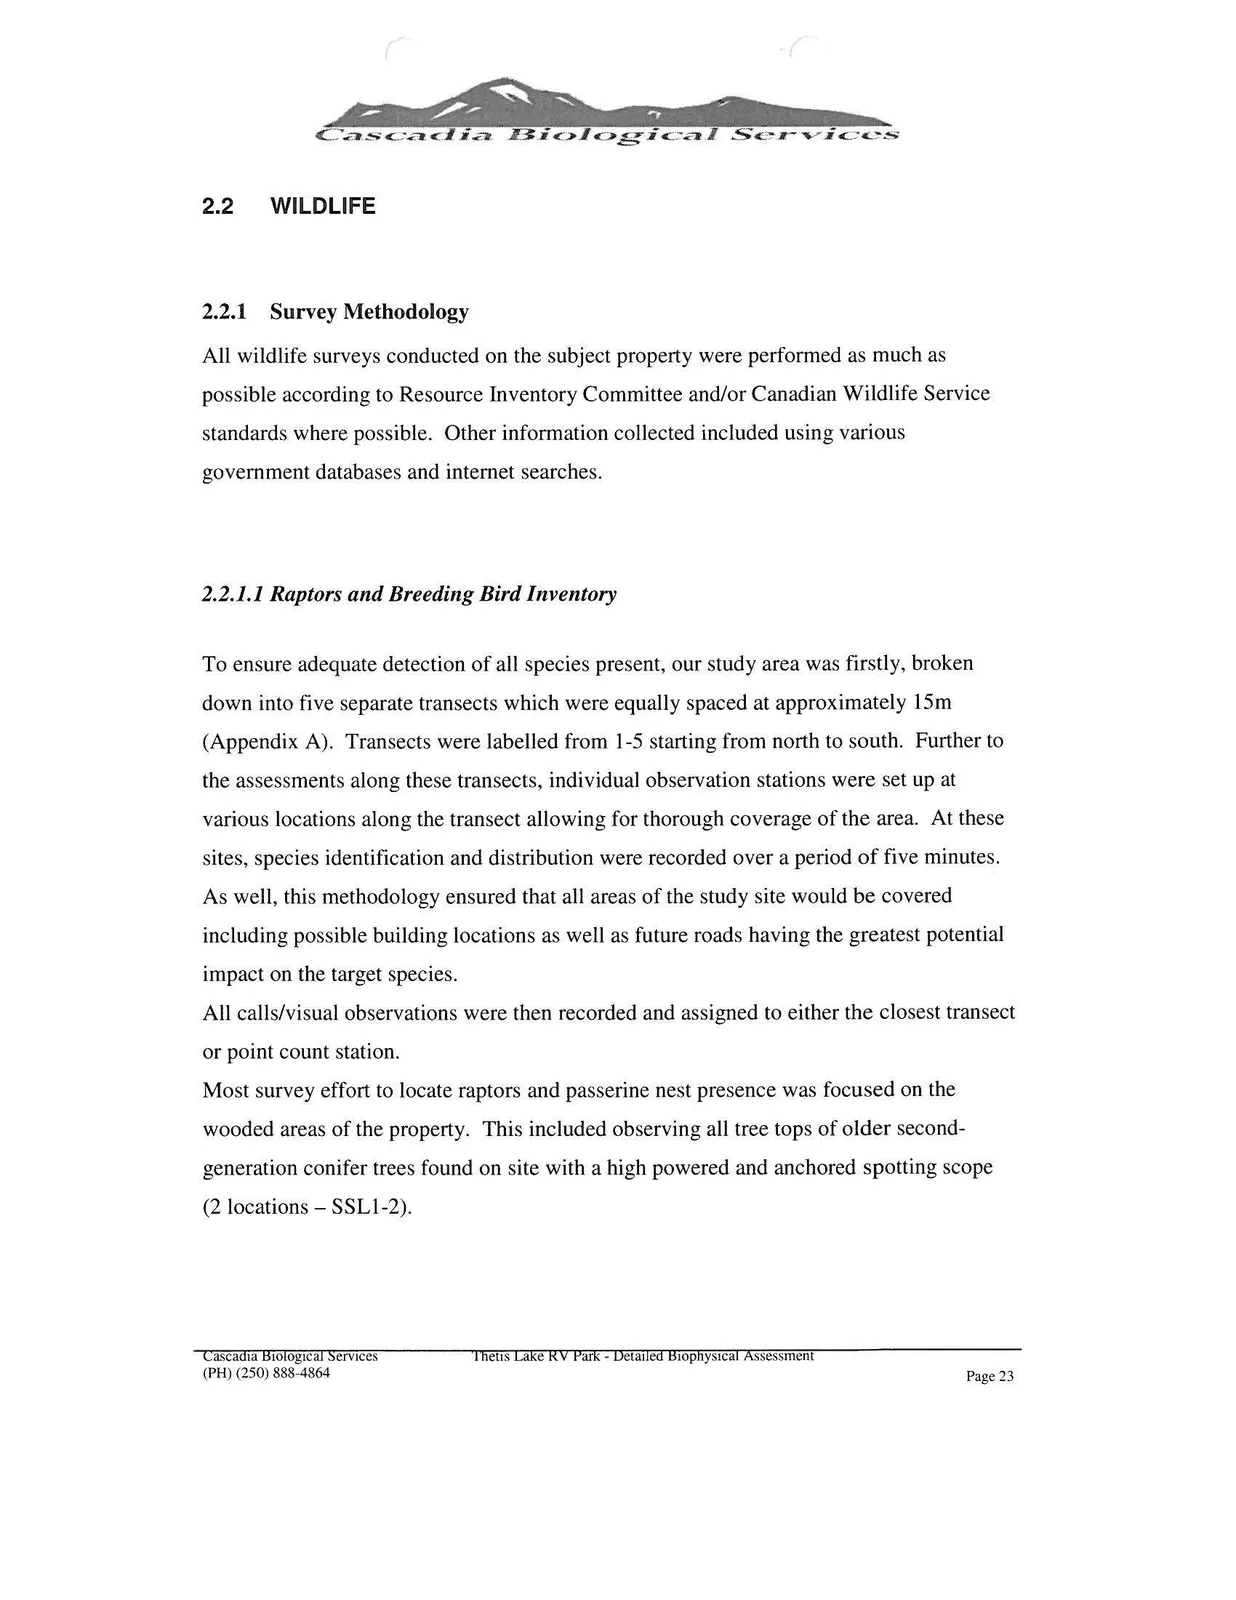
2.2.1.1 Raptors and Breeding Bird Inventory
To ensure adequate detection of all species present, our study area was firstly, broken down into five separate transects which were equally spaced at approximately 15m (Appendix A). Transects were labelled from 1-5 starting from north to south. Further to the assessments along these transects, individual observation stations were set up at various locations along the transect allowing for thorough coverage of the area. At these sites, species identification and distribution were recorded over a period of five minutes. As well, this methodology ensured that all areas of the study site would be covered including possible building locations as well as future roads having the greatest potential impact on the target species. All calls/visual observations were then recorded and assigned to either the closest transect or point count station.
Most survey effort to locate raptors and passerine nest presence was focused on the wooded areas of the property. This included observing all tree tops of older second-generation conifer trees found on site with a high powered and anchored spotting scope (2 locations - SSL1-2).
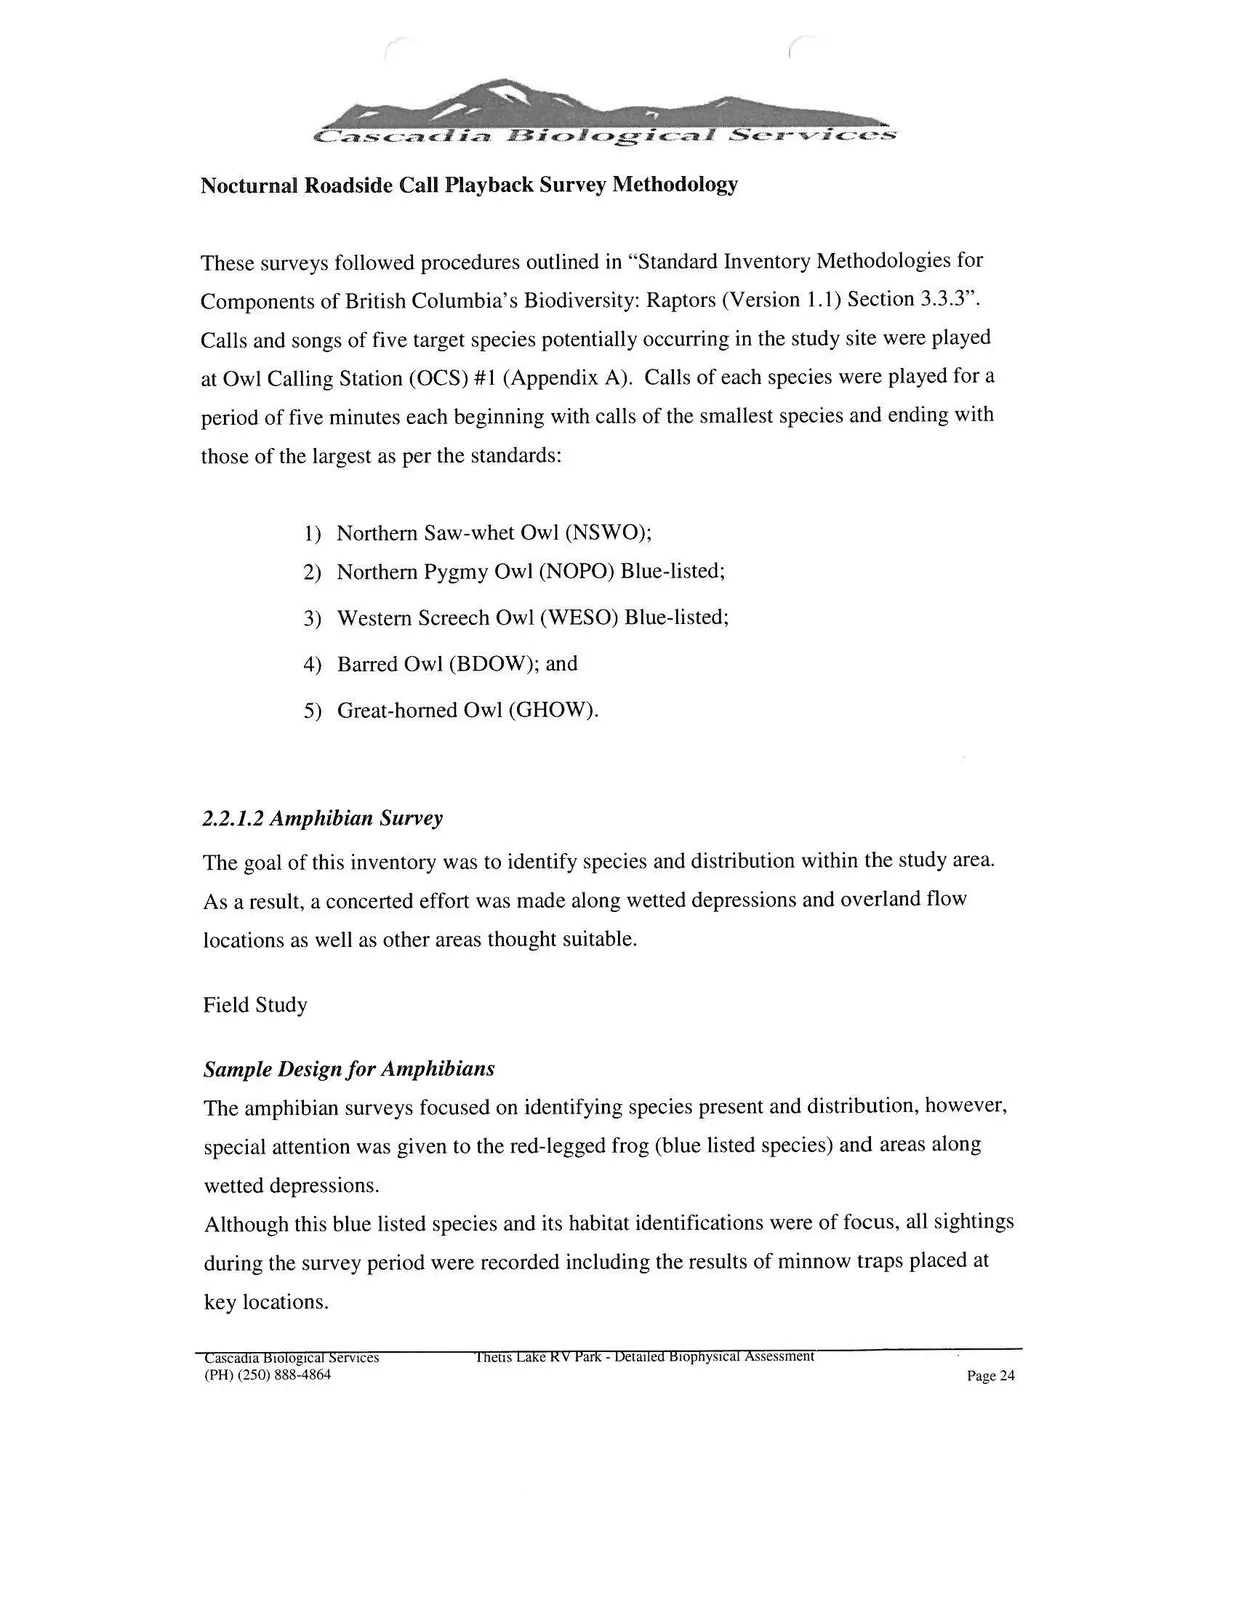
Nocturnal Roadside Call Playback Survey Methodology
These surveys followed procedures outlined in "Standard Inventory Methodologies for Components of British Columbia's Biodiversity: Raptors (Version 1.1) Section 3.3.3". Calls and songs of five target species potentially occurring in the study site were played at Owl Calling Station (OCS) #1 (Appendix A). Calls of each species were played for a period of five minutes each beginning with calls of the smallest species and ending with those of the largest as per the standards:
- Northern Saw-whet Owl (NSWO);
- Northern Pygmy Owl (NOPO) Blue-listed;
- Western Screech Owl (WESO) Blue-listed;
- Barred Owl (BDOW); and
- Great-horned Owl (GHOW).
2.2.1.2 Amphibian Survey
The goal of this inventory was to identify species and distribution within the study area. As a result, a concerted effort was made along wetted depressions and overland flow locations as well as other areas thought suitable.
Field Study
Sample Design for Amphibians
The amphibian surveys focused on identifying species present and distribution, however, special attention was given to the red-legged frog (blue listed species) and areas along wetted depressions. Although this blue listed species and its habitat identifications were of focus, all sightings during the survey period were recorded including the results of minnow traps placed at key locations.
2.2.1.3 Small Mammal Survey
This survey focused on all areas within the study area and followed the MoE Inventory Branch for the Terrestrial Ecosystems Task Force Resource Inventory Committee (RIC) protocols.
Office Procedures
The following office preparation was performed prior to the field surveys:
- Review of the "Inventory Methods for Small Mammals: Shrews, Voles, Mice & Rats", Standards for Components of British Columbia's Biodiversity, No. 31 (1998);
- Review the introductory manual No. 1 Species Inventory Fundamentals;
The survey addressed the building footprint in the development area, as well as areas with a high likelihood of species occurrence.
Field Sampling Procedures
Sample Design
This study involved determining species identification and distribution by establishing randomly located traps sites within the study area (Small Mammal Trap locations and Medium Mammal Traps Locations SMT 1-4/MMT 1-2). The number of traps were dependent on the potential species, and overall size of the study area. Live traps were used to minimize impacts to caught individuals. The following methodology was used during the survey:
- All traps were placed in areas where rodents and small to medium sized mammals were expected to occur in the project study site;
- Two small traps (mice, shrews etc.) and two larger traps (weasels, raccoons, cats etc,) were used at select locations;
- Each type of vegetation unit on the study site was sampled using this methodology and traps were placed in homogeneous habitat (Appendix A);
- GPS coordinates were taken for each trap location;
- All traps were flagged with flagging tape;
- Each trap was baited with peanut butter (mice, shrews) and sardines (larger traps);
- Traps were set for a period of 72 hrs.
- Once completed, all traps were removed;
2.2.1.4 Large Mammal Survey
The purpose of the large mammal ground survey was to:
- Assess species composition and distribution;
- Identify areas for potential habitat use.
The following ground-based survey methodology was conducted for this phase of the large mammal survey:
Office Procedure
- Review of BC Ministry documents Section 2 "Conducting Wildlife Inventory" in the introductory manual, Species Inventory Fundamentals (No. 1);
- Review of mapping for the area (i.e. air photo, 1:20,000 scale TRIM mapping);
- Identify potential habitat.
Sample Design
Identify species composition and distribution throughout the lot along delineated transects as well as thorough walk through covering 80% of the area. From this assessment, identify signs including scat, tracks, browsing areas, scrapings etc ..
Species Ratings and Accounts
Background
Attached in Appendix C is a list of BC Conservation Data Centre's Rare Vertebrate Animal Tracking List for the South Island Forest District (2019). Red and Blue rated vertebrates potentially occurring within this Forest District are listed. The COSEWIC and British Columbia's Red, Blue and Yellow rating status definition for each species identified are presented below.
COSEWIC ratings for species have been defined the following ways:
- Extinct - A species that no longer exists.
- Extirpated - A species that no longer exists in the wild in Canada, but occurring elsewhere (for example, in captivity or in the wild in the United States).
- Endangered - A species facing imminent extirpation or extinction.
- Threatened - A species likely to become endangered if limiting factors are not reversed.
- Vulnerable - A species of special concern because of characteristics that make it particularly sensitive to human activities or natural events.
- Not At Risk - A species that has been evaluated and found to be not at risk.
- Indeterminate - A species for which there is insufficient scientific information to support status designation.
Red, Blue and Yellow status as defined by the B.C. Conservation Data Centre's Red, Blue and Yellow definitions are as follows:
Red list: Includes any indigenous species or subspecies (taxa) considered to be Extirpated, Endangered, or Threatened in British Columbia. Extirpated taxa no longer exist in the wild in British Columbia, but do occur elsewhere. Endangered taxa are facing imminent extirpation or extinction. Threatened taxa are likely to become endangered if limiting factors are not reversed. Red-listed taxa include those that have been, or are being, evaluated for these designations.
Blue List: Includes any indigenous species or subspecies (taxa) considered to be Vulnerable in British Columbia. Vulnerable taxa are of special concern because of characteristics that make them particularly sensitive to human activities or natural events. Blue-listed taxa are at risk, but are not Extirpated, Endangered or Threatened.
Yellow list: Any indigenous species or subspecies (taxa), which is not at risk in British Columbia. The CDC tracks some Yellow listed taxa, which are vulnerable during times of seasonal concentration (eg. breeding colonies).
2.2.2 Assessment Results
2.2.2.1 Bird Inventory
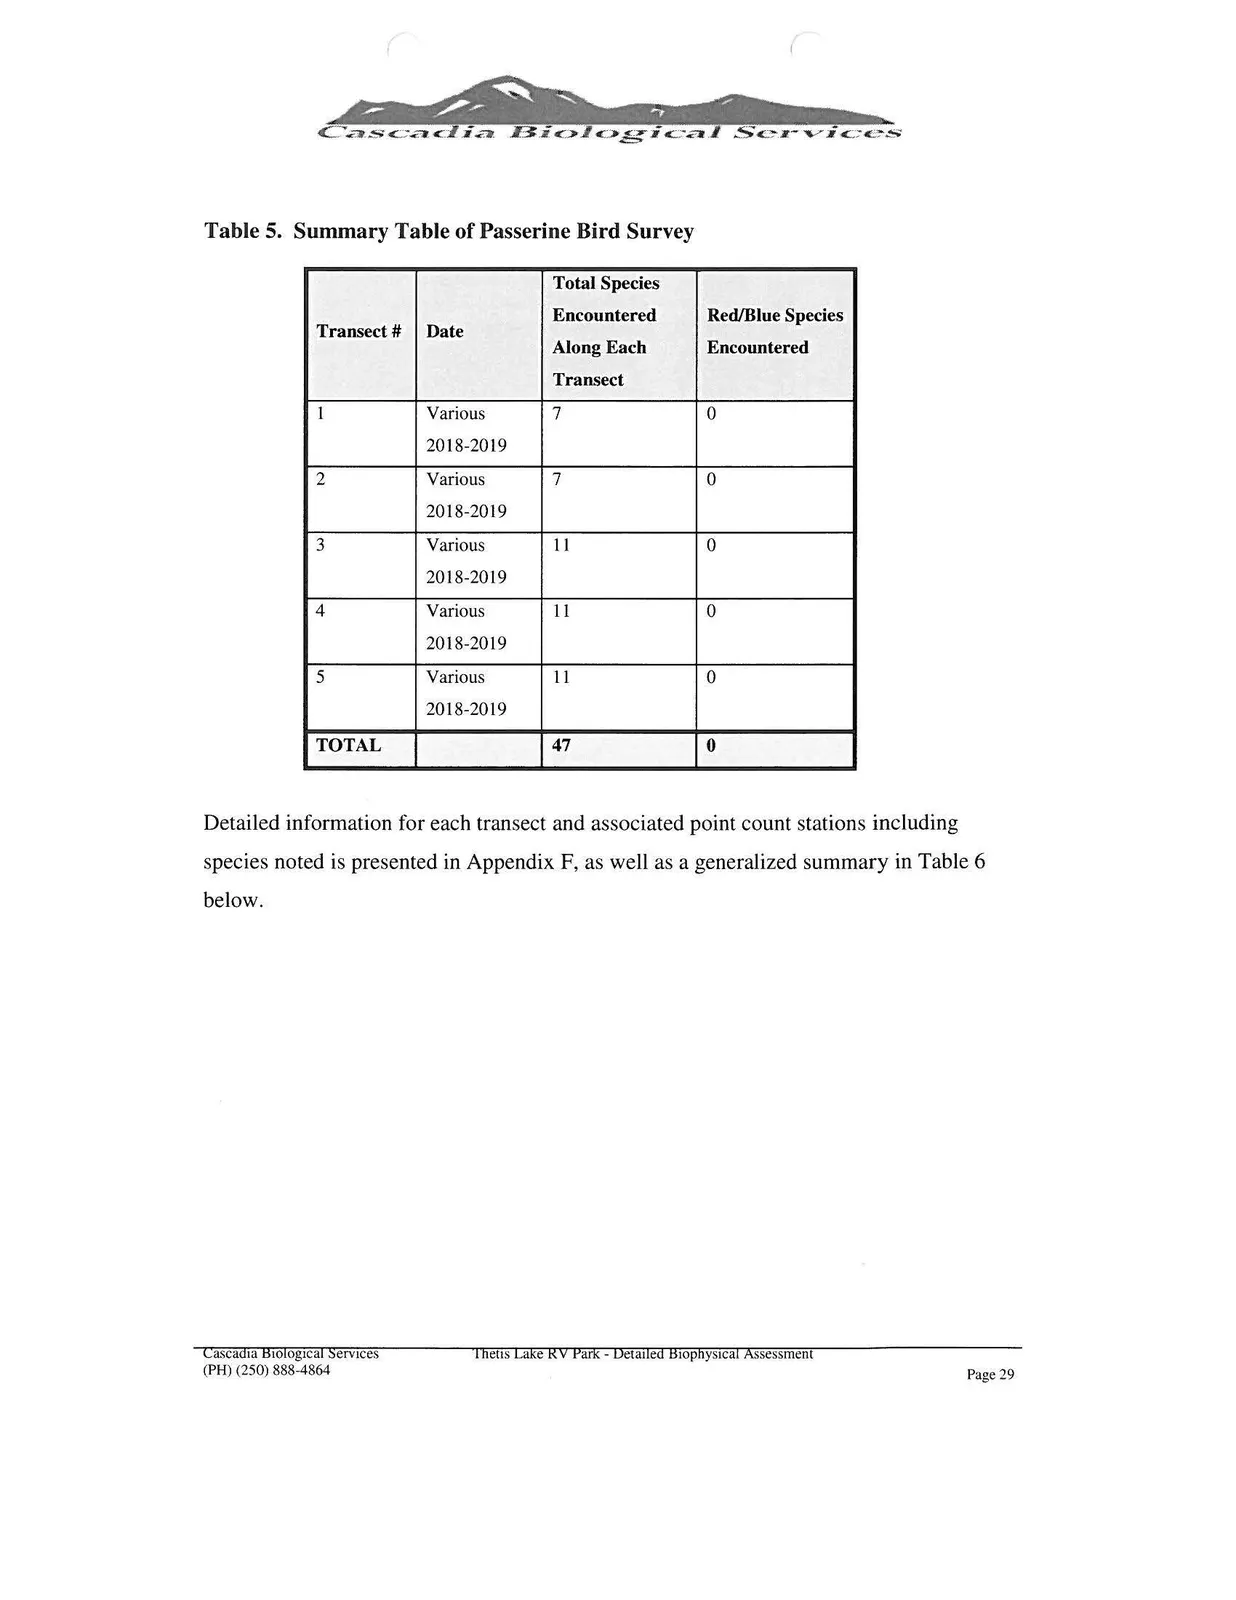
The bird survey was conducted on various dates between October 2018 and January of 2019. The night/nocturnal surveys were completed on the evenings of January 21st and 22nd of 2019. A total of 47 bird species (passerines and raptors) were encountered on the study site during the transect survey and as incidental sightings. As point count stations/owl calling stations were aligned along designated transects, the summary table below incorporates all birds identified to the nearest transect location and number. The following is a result of the transect/point count/auditory surveys performed on the delineated study area. Refer to Table 5 below.
Table 5. Summary Table of Passerine Bird Survey
| Transect # | Date | Total Species Encountered Along Each Transect | Red/Blue Species Encountered |
|---|---|---|---|
| 1 | Various 2018-2019 | 7 | 0 |
| 2 | Various 2018-2019 | 7 | 0 |
| 3 | Various 2018-2019 | 11 | 0 |
| 4 | Various 2018-2019 | 11 | 0 |
| 5 | Various 2018-2019 | 11 | 0 |
| TOTAL | 47 | 0 |
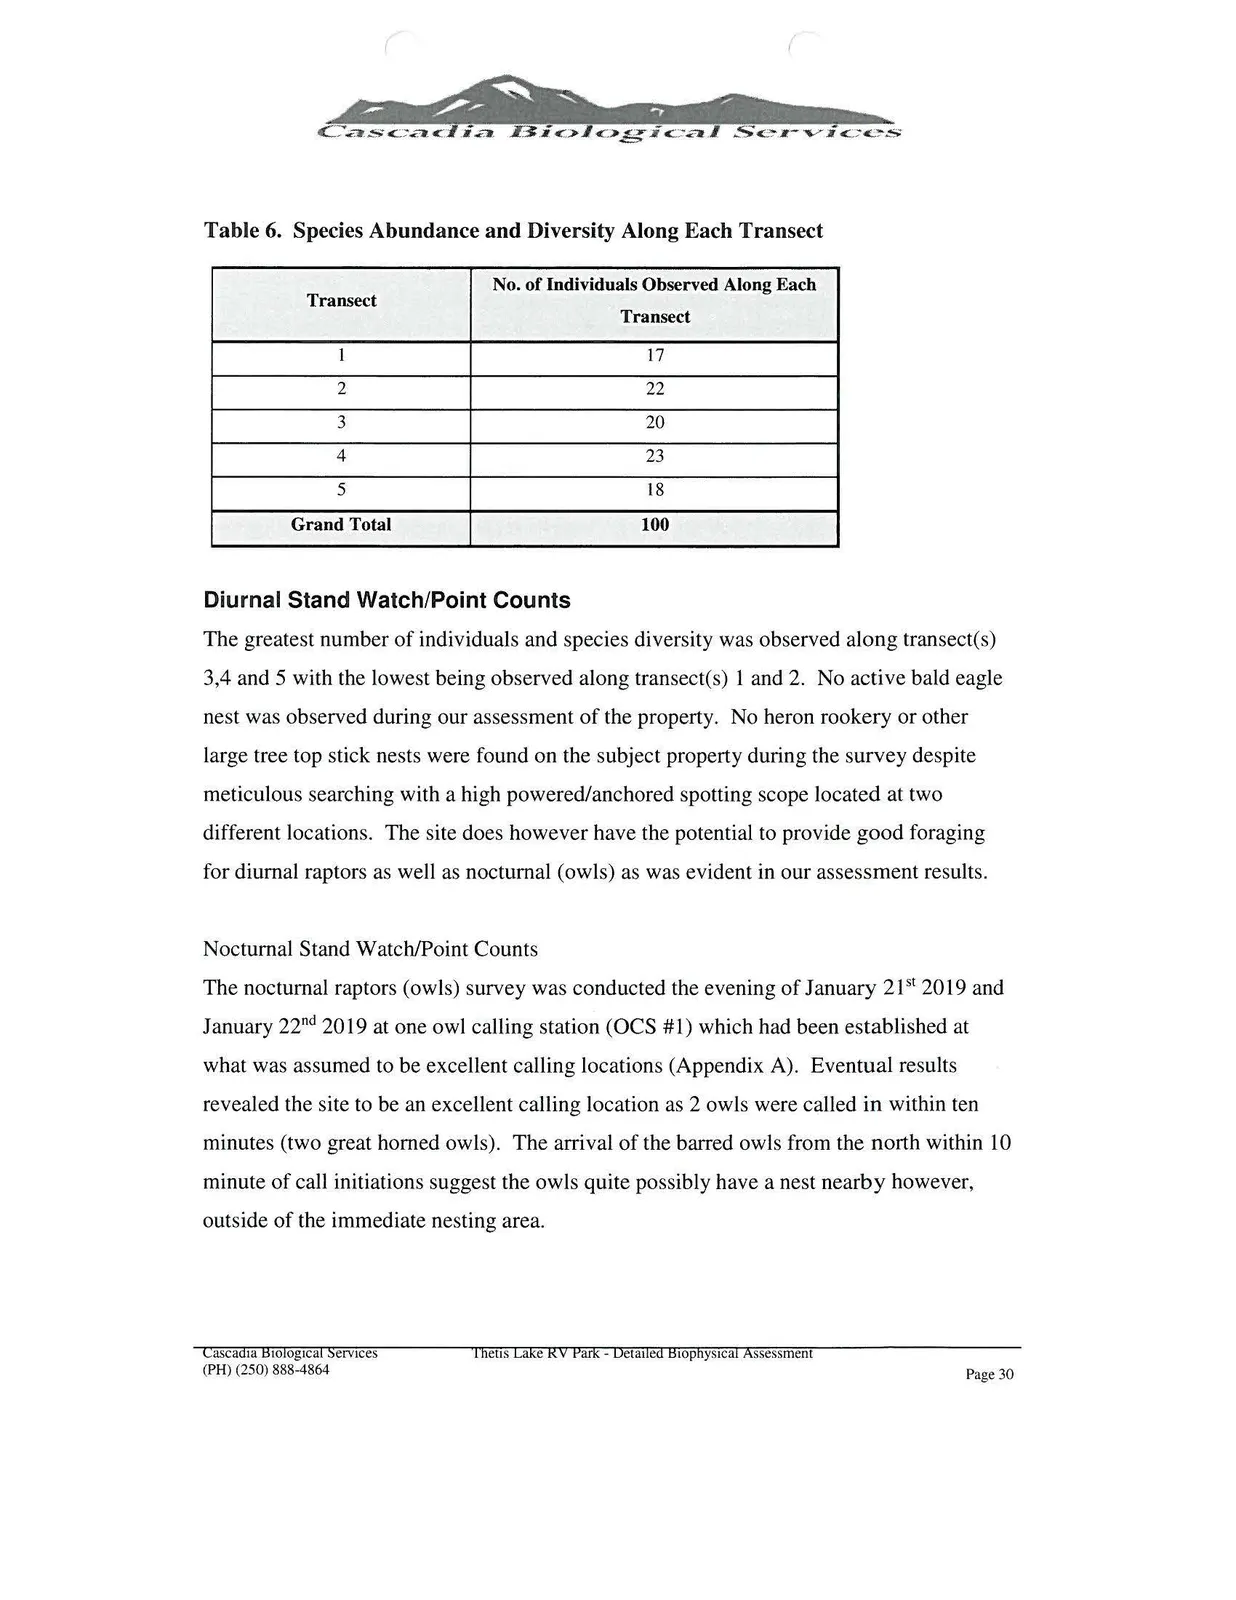
Detailed information for each transect and associated point count stations including species noted is presented in Appendix F, as well as a generalized summary in Table 6 below.
Table 6. Species Abundance and Diversity Along Each Transect
| Transect | No. of Individuals Observed Along Each Transect |
|---|---|
| 1 | 17 |
| 2 | 22 |
| 3 | 20 |
| 4 | 23 |
| 5 | 18 |
| Grand Total | 100 |
Diurnal Stand Watch/Point Counts
The greatest number of individuals and species diversity was observed along transect(s) 3,4 and 5 with the lowest being observed along transect(s) 1 and 2. No active bald eagle nest was observed during our assessment of the property. No heron rookery or other large tree top stick nests were found on the subject property during the survey despite meticulous searching with a high powered/anchored spotting scope located at two different locations. The site does however have the potential to provide good foraging for diurnal raptors as well as nocturnal (owls) as was evident in our assessment results.
Nocturnal Stand Watch/Point Counts
The nocturnal raptors (owls) survey was conducted the evening of January 21st 2019 and January 22nd 2019 at one owl calling station (OCS #1) which had been established at what was assumed to be excellent calling locations (Appendix A). Eventual results revealed the site to be an excellent calling location as 2 owls were called in within ten minutes (two great horned owls). The arrival of the barred owls from the north within 10 minute of call initiations suggest the owls quite possibly have a nest nearby however, outside of the immediate nesting area.
Document Images
(26)