Appendix
Attachment A: 2018 Financial Results Details
May 14, 2019Pages 75–782 sections
Detailed financial tables showing revenue and expenses by department for the 2018 fiscal year compared to the budget.
Total Revenue Actual: $14,048,556Total Expense Actual: $13,318,067Net operating surplus/deficit: ($730,489) actual vs ($458,275) budget
Attachment A: 2018 Financial Results Details
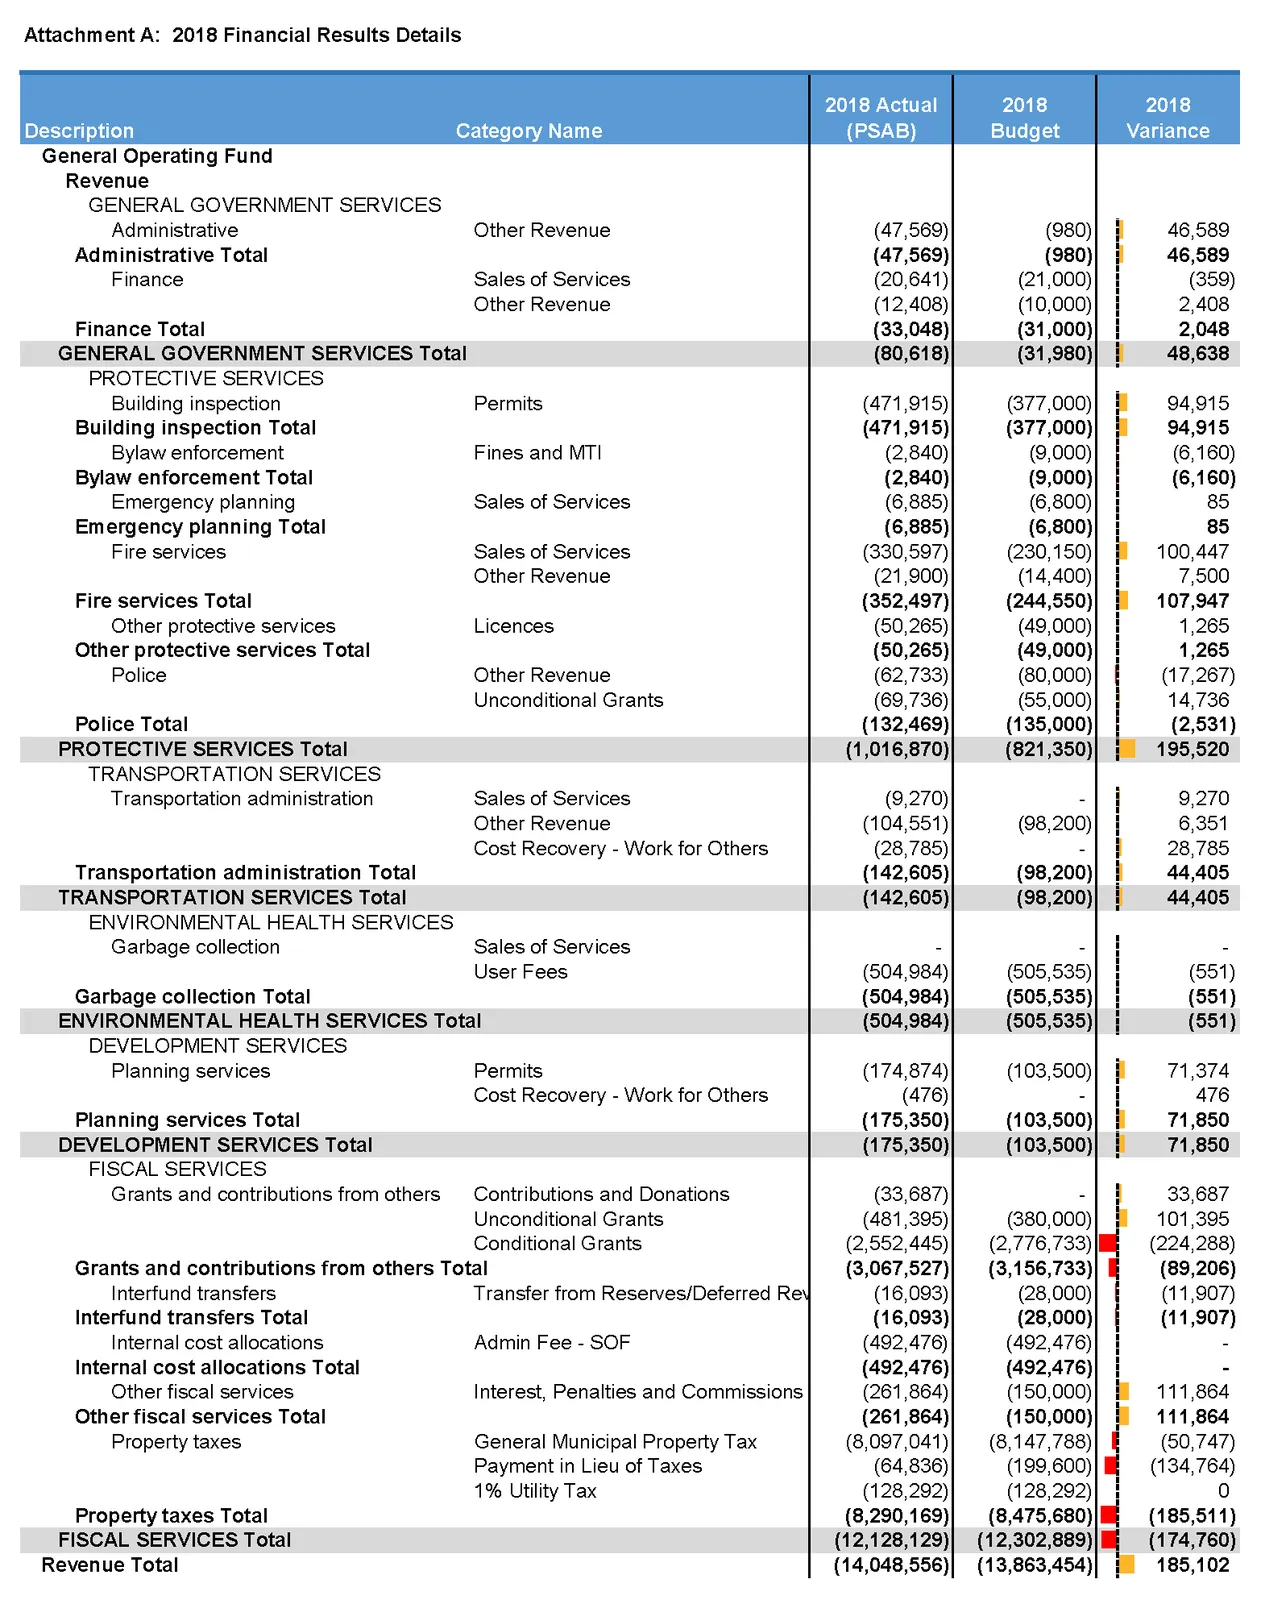
General Operating Fund
Revenue
| Description | Category Name | 2018 Actual (PSAB) | 2018 Budget | 2018 Variance |
|---|---|---|---|---|
| GENERAL GOVERNMENT SERVICES | ||||
| Administrative | Other Revenue | (47,569) | (980) | 46,589 |
| Administrative Total | (47,569) | (980) | 46,589 | |
| Finance | Sales of Services | (20,641) | (21,000) | (359) |
| Other Revenue | (12,408) | (10,000) | 2,408 | |
| Finance Total | (33,048) | (31,000) | 2,048 | |
| GENERAL GOVERNMENT SERVICES Total | (80,618) | (31,980) | 48,638 | |
| PROTECTIVE SERVICES | ||||
| Building inspection | Permits | (471,915) | (377,000) | 94,915 |
| Building inspection Total | (471,915) | (377,000) | 94,915 | |
| Bylaw enforcement | Fines and MTI | (2,840) | (9,000) | (6,160) |
| Bylaw enforcement Total | (2,840) | (9,000) | (6,160) | |
| Emergency planning | Sales of Services | (6,885) | (6,800) | 85 |
| Emergency planning Total | (6,885) | (6,800) | 85 | |
| Fire services | Sales of Services | (330,597) | (230,150) | 100,447 |
| Other Revenue | (21,900) | (14,400) | 7,500 | |
| Fire services Total | (352,497) | (244,550) | 107,947 | |
| Other protective services | Licences | (50,265) | (49,000) | 1,265 |
| Other protective services Total | (50,265) | (49,000) | 1,265 | |
| Police | Other Revenue | (62,733) | (80,000) | (17,267) |
| Unconditional Grants | (69,736) | (55,000) | 14,736 | |
| Police Total | (132,469) | (135,000) | (2,531) | |
| PROTECTIVE SERVICES Total | (1,016,870) | (821,350) | 195,520 | |
| TRANSPORTATION SERVICES | ||||
| Transportation administration | Sales of Services | (9,270) | - | 9,270 |
| Other Revenue | (104,551) | (98,200) | 6,351 | |
| Cost Recovery - Work for Others | (28,785) | - | 28,785 | |
| Transportation administration Total | (142,605) | (98,200) | 44,405 | |
| TRANSPORTATION SERVICES Total | (142,605) | (98,200) | 44,405 | |
| ENVIRONMENTAL HEALTH SERVICES | ||||
| Garbage collection | Sales of Services | - | - | - |
| User Fees | (504,984) | (505,535) | (551) | |
| Garbage collection Total | (504,984) | (505,535) | (551) | |
| ENVIRONMENTAL HEALTH SERVICES Total | (504,984) | (505,535) | (551) | |
| DEVELOPMENT SERVICES | ||||
| Planning services | Permits | (174,874) | (103,500) | 71,374 |
| Cost Recovery - Work for Others | (476) | - | 476 | |
| Planning services Total | (175,350) | (103,500) | 71,850 | |
| DEVELOPMENT SERVICES Total | (175,350) | (103,500) | 71,850 | |
| FISCAL SERVICES | ||||
| Grants and contributions from others | Contributions and Donations | (33,687) | - | 33,687 |
| Unconditional Grants | (481,395) | (380,000) | 101,395 | |
| Conditional Grants | (2,552,445) | (2,776,733) | (224,288) | |
| Grants and contributions from others Total | (3,067,527) | (3,156,733) | (89,206) | |
| Interfund transfers | Transfer from Reserves/Deferred Rev | (16,093) | (28,000) | (11,907) |
| Interfund transfers Total | (16,093) | (28,000) | (11,907) | |
| Internal cost allocations | Admin Fee - SOF | (492,476) | (492,476) | - |
| Internal cost allocations Total | (492,476) | (492,476) | - | |
| Other fiscal services | Interest, Penalties and Commissions | (261,864) | (150,000) | 111,864 |
| Other fiscal services Total | (261,864) | (150,000) | 111,864 | |
| Property taxes | General Municipal Property Tax | (8,097,041) | (8,147,788) | (50,747) |
| Payment in Lieu of Taxes | (64,836) | (199,600) | (134,764) | |
| 1% Utility Tax | (128,292) | (128,292) | 0 | |
| Property taxes Total | (8,290,169) | (8,475,680) | (185,511) | |
| FISCAL SERVICES Total | (12,128,129) | (12,302,889) | (174,760) | |
| Revenue Total | (14,048,556) | (13,863,454) | 185,102 |
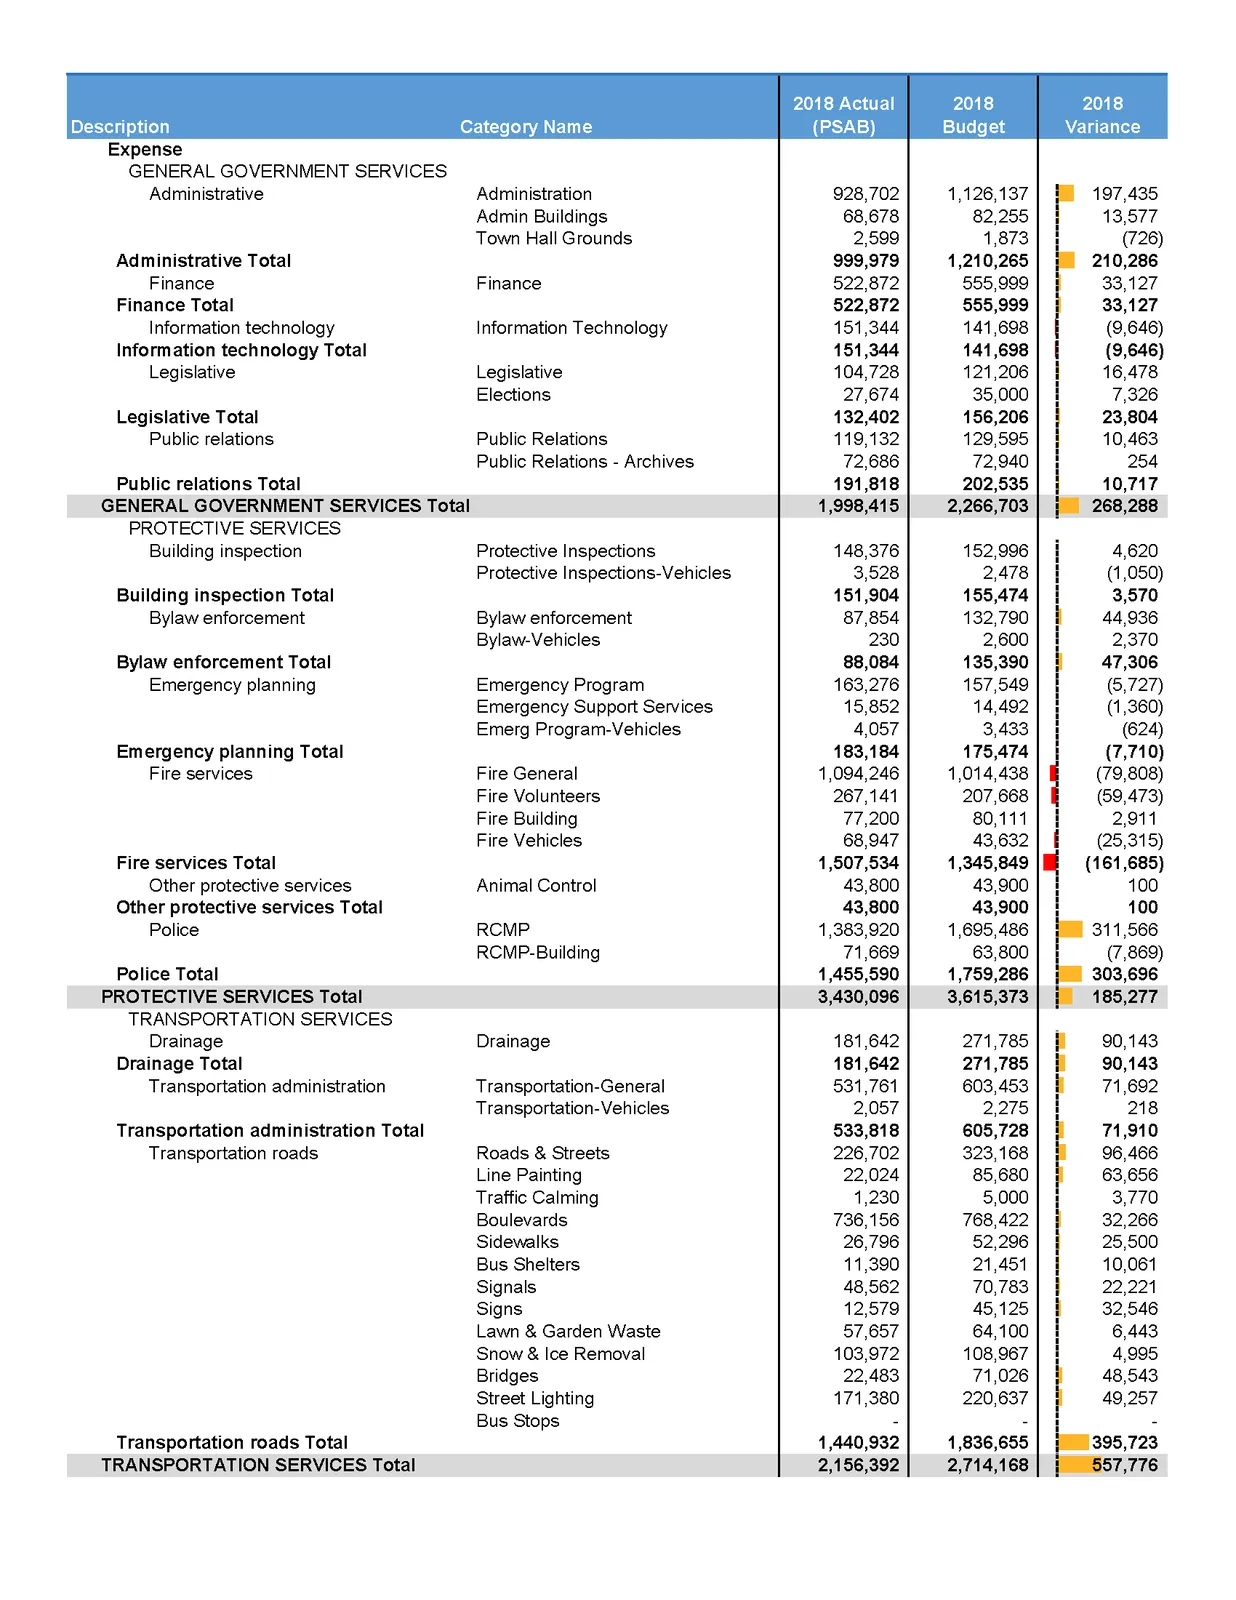
Expense
| Description | Category Name | 2018 Actual (PSAB) | 2018 Budget | 2018 Variance |
|---|---|---|---|---|
| GENERAL GOVERNMENT SERVICES | ||||
| Administrative | Administration | 928,702 | 1,126,137 | 197,435 |
| Admin Buildings | 68,678 | 82,255 | 13,577 | |
| Town Hall Grounds | 2,599 | 1,873 | (726) | |
| Administrative Total | 999,979 | 1,210,265 | 210,286 | |
| Finance | Finance | 522,872 | 555,999 | 33,127 |
| Finance Total | 522,872 | 555,999 | 33,127 | |
| Information technology | Information Technology | 151,344 | 141,698 | (9,646) |
| Information technology Total | 151,344 | 141,698 | (9,646) | |
| Legislative | Legislative | 104,728 | 121,206 | 16,478 |
| Elections | 27,674 | 35,000 | 7,326 | |
| Legislative Total | 132,402 | 156,206 | 23,804 | |
| Public relations | Public Relations | 119,132 | 129,595 | 10,463 |
| Public Relations - Archives | 72,686 | 72,940 | 254 | |
| Public relations Total | 191,818 | 202,535 | 10,717 | |
| GENERAL GOVERNMENT SERVICES Total | 1,998,415 | 2,266,703 | 268,288 | |
| PROTECTIVE SERVICES | ||||
| Building inspection | Protective Inspections | 148,376 | 152,996 | 4,620 |
| Protective Inspections-Vehicles | 3,528 | 2,478 | (1,050) | |
| Building inspection Total | 151,904 | 155,474 | 3,570 | |
| Bylaw enforcement | Bylaw enforcement | 87,854 | 132,790 | 44,936 |
| Bylaw-Vehicles | 230 | 2,600 | 2,370 | |
| Bylaw enforcement Total | 88,084 | 135,390 | 47,306 | |
| Emergency planning | Emergency Program | 163,276 | 157,549 | (5,727) |
| Emergency Support Services | 15,852 | 14,492 | (1,360) | |
| Emerg Program-Vehicles | 4,057 | 3,433 | (624) | |
| Emergency planning Total | 183,184 | 175,474 | (7,710) | |
| Fire services | Fire General | 1,094,246 | 1,014,438 | (79,808) |
| Fire Volunteers | 267,141 | 207,668 | (59,473) | |
| Fire Building | 77,200 | 80,111 | 2,911 | |
| Fire Vehicles | 68,947 | 43,632 | (25,315) | |
| Fire services Total | 1,507,534 | 1,345,849 | (161,685) | |
| Other protective services | Animal Control | 43,800 | 43,900 | 100 |
| Other protective services Total | 43,800 | 43,900 | 100 | |
| Police | RCMP | 1,383,920 | 1,695,486 | 311,566 |
| RCMP-Building | 71,669 | 63,800 | (7,869) | |
| Police Total | 1,455,590 | 1,759,286 | 303,696 | |
| PROTECTIVE SERVICES Total | 3,430,096 | 3,615,373 | 185,277 | |
| TRANSPORTATION SERVICES | ||||
| Drainage | Drainage | 181,642 | 271,785 | 90,143 |
| Drainage Total | 181,642 | 271,785 | 90,143 | |
| Transportation administration | Transportation-General | 531,761 | 603,453 | 71,692 |
| Transportation-Vehicles | 2,057 | 2,275 | 218 | |
| Transportation administration Total | 533,818 | 605,728 | 71,910 | |
| Transportation roads | Roads & Streets | 226,702 | 323,168 | 96,466 |
| Line Painting | 22,024 | 85,680 | 63,656 | |
| Traffic Calming | 1,230 | 5,000 | 3,770 | |
| Boulevards | 736,156 | 768,422 | 32,266 | |
| Sidewalks | 26,796 | 52,296 | 25,500 | |
| Bus Shelters | 11,390 | 21,451 | 10,061 | |
| Signals | 48,562 | 70,783 | 22,221 | |
| Signs | 12,579 | 45,125 | 32,546 | |
| Lawn & Garden Waste | 57,657 | 64,100 | 6,443 | |
| Snow & Ice Removal | 103,972 | 108,967 | 4,995 | |
| Bridges | 22,483 | 71,026 | 48,543 | |
| Street Lighting | 171,380 | 220,637 | 49,257 | |
| Bus Stops | - | - | - | |
| Transportation roads Total | 1,440,932 | 1,836,655 | 395,723 | |
| TRANSPORTATION SERVICES Total | 2,156,392 | 2,714,168 | 557,776 |
Page 75–78
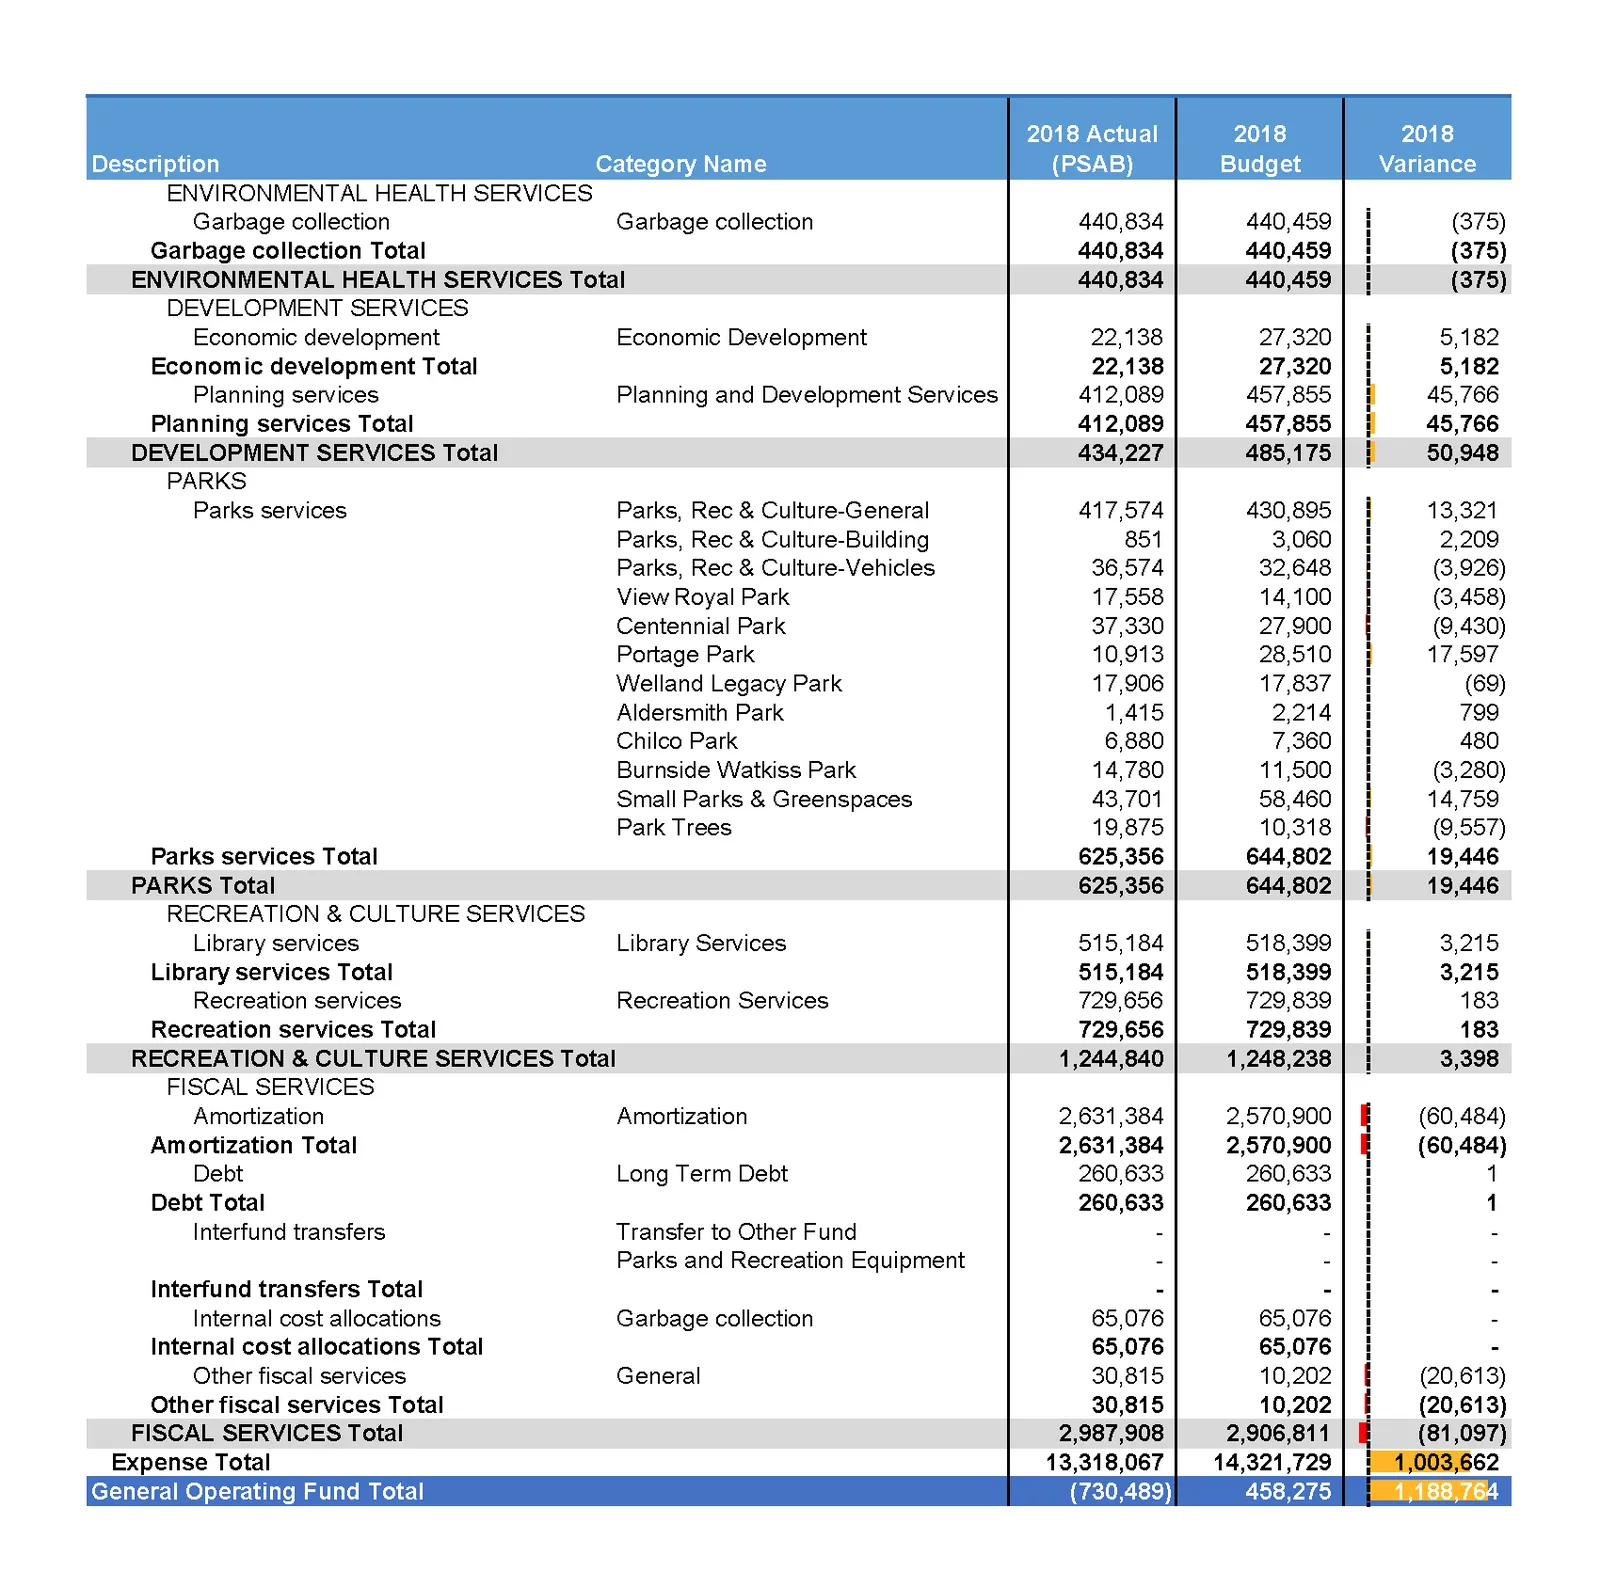
| Description | Category Name | 2018 Actual (PSAB) | 2018 Budget | 2018 Variance |
|---|---|---|---|---|
| ENVIRONMENTAL HEALTH SERVICES | ||||
| Garbage collection | Garbage collection | 440,834 | 440,459 | (375) |
| Garbage collection Total | 440,834 | 440,459 | (375) | |
| ENVIRONMENTAL HEALTH SERVICES Total | 440,834 | 440,459 | (375) | |
| DEVELOPMENT SERVICES | ||||
| Economic development | Economic Development | 22,138 | 27,320 | 5,182 |
| Economic development Total | 22,138 | 27,320 | 5,182 | |
| Planning services | Planning and Development Services | 412,089 | 457,855 | 45,766 |
| Planning services Total | 412,089 | 457,855 | 45,766 | |
| DEVELOPMENT SERVICES Total | 434,227 | 485,175 | 50,948 | |
| PARKS | ||||
| Parks services | Parks, Rec & Culture-General | 417,574 | 430,895 | 13,321 |
| Parks, Rec & Culture-Building | 851 | 3,060 | 2,209 | |
| Parks, Rec & Culture-Vehicles | 36,574 | 32,648 | (3,926) | |
| View Royal Park | 17,558 | 14,100 | (3,458) | |
| Centennial Park | 37,330 | 27,900 | (9,430) | |
| Portage Park | 10,913 | 28,510 | 17,597 | |
| Welland Legacy Park | 17,906 | 17,837 | (69) | |
| Aldersmith Park | 1,415 | 2,214 | 799 | |
| Chilco Park | 6,880 | 7,360 | 480 | |
| Burnside Watkiss Park | 14,780 | 11,500 | (3,280) | |
| Small Parks & Greenspaces | 43,701 | 58,460 | 14,759 | |
| Park Trees | 19,875 | 10,318 | (9,557) | |
| Parks services Total | 625,356 | 644,802 | 19,446 | |
| PARKS Total | 625,356 | 644,802 | 19,446 | |
| RECREATION & CULTURE SERVICES | ||||
| Library services | Library Services | 515,184 | 518,399 | 3,215 |
| Library services Total | 515,184 | 518,399 | 3,215 | |
| Recreation services | Recreation Services | 729,656 | 729,839 | 183 |
| Recreation services Total | 729,656 | 729,839 | 183 | |
| RECREATION & CULTURE SERVICES Total | 1,244,840 | 1,248,238 | 3,398 | |
| FISCAL SERVICES | ||||
| Amortization | Amortization | 2,631,384 | 2,570,900 | (60,484) |
| Amortization Total | 2,631,384 | 2,570,900 | (60,484) | |
| Debt | Long Term Debt | 260,633 | 260,633 | 1 |
| Debt Total | 260,633 | 260,633 | 1 | |
| Interfund transfers | Transfer to Other Fund | - | - | - |
| Parks and Recreation Equipment | - | - | - | |
| Interfund transfers Total | - | - | - | |
| Internal cost allocations | Garbage collection | 65,076 | 65,076 | - |
| Internal cost allocations Total | 65,076 | 65,076 | - | |
| Other fiscal services | General | 30,815 | 10,202 | (20,613) |
| Other fiscal services Total | 30,815 | 10,202 | (20,613) | |
| FISCAL SERVICES Total | 2,987,908 | 2,906,811 | (81,097) | |
| Expense Total | 13,318,067 | 14,321,729 | 1,003,662 | |
| General Operating Fund Total | (730,489) | 458,275 | 1,188,764 |
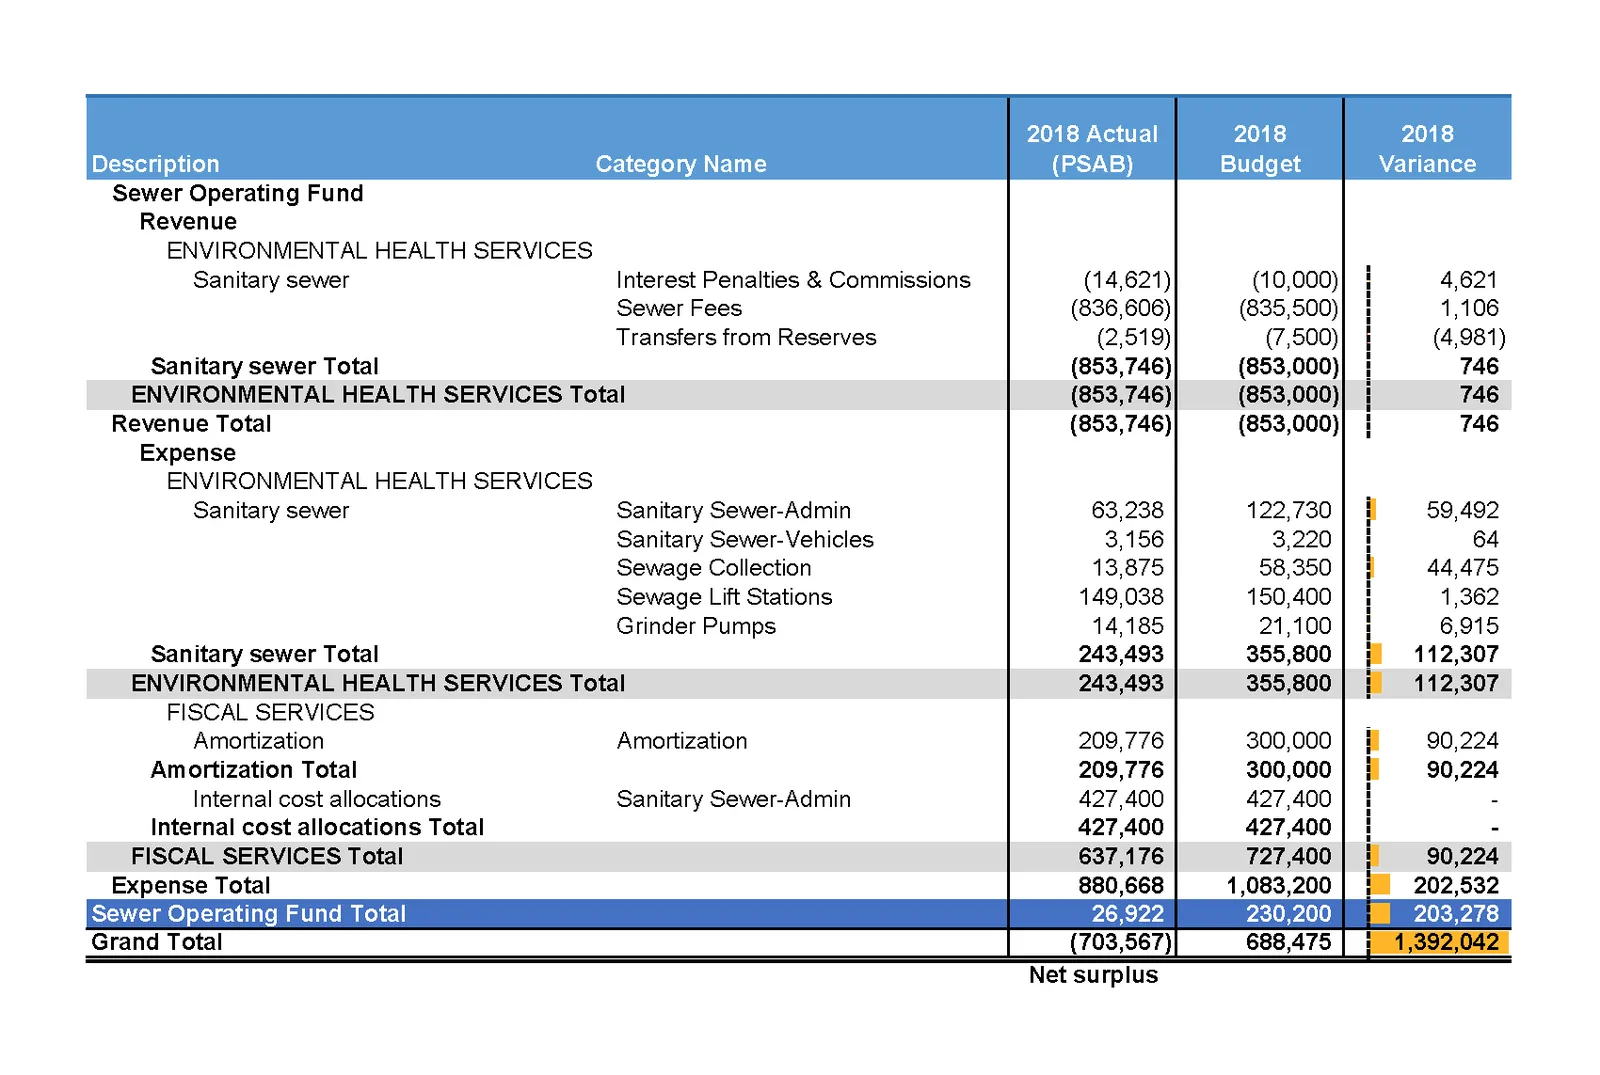
Sewer Operating Fund
Revenue
| Description | Category Name | 2018 Actual (PSAB) | 2018 Budget | 2018 Variance |
|---|---|---|---|---|
| ENVIRONMENTAL HEALTH SERVICES | ||||
| Sanitary sewer | Interest Penalties & Commissions | (14,621) | (10,000) | 4,621 |
| Sewer Fees | (836,606) | (835,500) | 1,106 | |
| Transfers from Reserves | (2,519) | (7,500) | (4,981) | |
| Sanitary sewer Total | (853,746) | (853,000) | 746 | |
| ENVIRONMENTAL HEALTH SERVICES Total | (853,746) | (853,000) | 746 | |
| Revenue Total | (853,746) | (853,000) | 746 |
Expense
| Description | Category Name | 2018 Actual (PSAB) | 2018 Budget | 2018 Variance |
|---|---|---|---|---|
| ENVIRONMENTAL HEALTH SERVICES | ||||
| Sanitary sewer | Sanitary Sewer-Admin | 63,238 | 122,730 | 59,492 |
| Sanitary Sewer-Vehicles | 3,156 | 3,220 | 64 | |
| Sewage Collection | 13,875 | 58,350 | 44,475 | |
| Sewage Lift Stations | 149,038 | 150,400 | 1,362 | |
| Grinder Pumps | 14,185 | 21,100 | 6,915 | |
| Sanitary sewer Total | 243,493 | 355,800 | 112,307 | |
| ENVIRONMENTAL HEALTH SERVICES Total | 243,493 | 355,800 | 112,307 | |
| FISCAL SERVICES | ||||
| Amortization | Amortization | 209,776 | 300,000 | 90,224 |
| Amortization Total | 209,776 | 300,000 | 90,224 | |
| Internal cost allocations | Sanitary Sewer-Admin | 427,400 | 427,400 | - |
| Internal cost allocations Total | 427,400 | 427,400 | - | |
| FISCAL SERVICES Total | 637,176 | 727,400 | 90,224 | |
| Expense Total | 880,668 | 1,083,200 | 202,532 | |
| Sewer Operating Fund Total | 26,922 | 230,200 | 203,278 | |
| Grand Total | (703,567) | 688,475 | 1,392,042 |
Net surplus
Page 75–78
Extracted from: 2019 05 14 Committee of the Whole Agenda - Agenda - Pdf