View Royal Housing Indicators Summary
An infographic-style summary of demographic trends, housing stock structural types, and affordability trends in View Royal.
View Royal Housing Indicators Summary
In 2019, the Town of View Royal initiated a housing needs assessment to better understand existing needs and future demands for housing. The study aims to:
- Document housing issues, including affordability, overcrowding, state of repair, and ability of median-earning households to afford current rental and ownership housing in View Royal
- Develop an evidence base for changes within the community to inform housing policy and the Town’s Official Community Plan
- Develop projections for household type and population growth to determine potential future demands and pressures
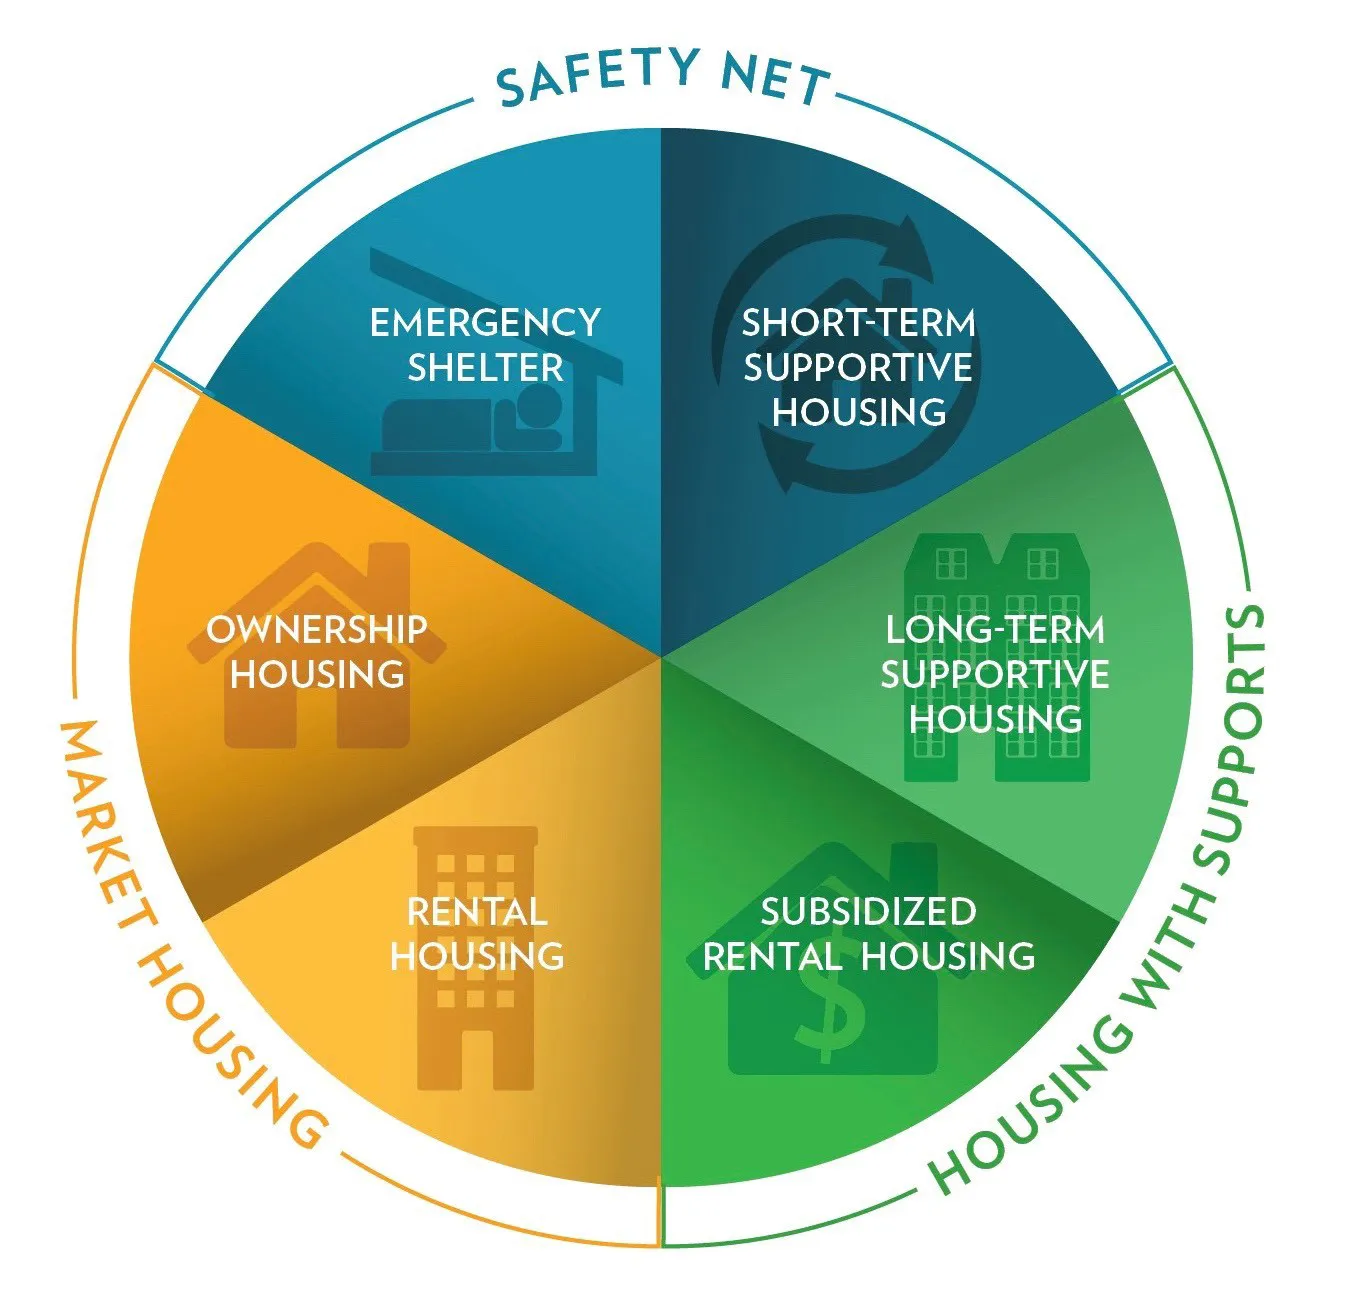
- Document the state of the housing continuum
Royal View’s Housing Continuum
Demographic Trends
POPULATION & HOUSEHOLD GROWTH
In 2016, the population of View Royal was about 10,900 residents, up about 19% from about 8,800 in 2006. According to regional growth population projections, by 2038 there will be 15,400 new residents in View Royal, representing 7,150 households. Overall, View Royal’s age demographics are comparable to the region as a whole. View Royal has an older population, with 18% of residents 65 years or older, or 1,745 residents. This is slightly lower than 20% in the CRD as a whole. The working age population (aged 25-64) represent 56% of the population, or 5,585 residents, compared to 56% in the CRD as a whole. Twenty-one percent of the population is 19 or younger, and 5% are between 20 to 24 years.
[Chart: Population and Household Projections line graph showing population growing from 10,870 in 2016 to 15,410 in 2038, and households growing from 4,220 in 2016 to 7,150 in 2038]
HOUSING STOCK
Housing in View Royal is predominantly single-detached homes, apartments in a flat or duplex², or semi-detached house. These structural types comprise about two-thirds of View Royal’s housing stock, with units in small apartments and row/townhouses comprising the remain one-third.
Housing Units by Structural Type
[Chart: Bar chart showing Housing Units by Structural Type: Single-Detached House (1,655 units, 40%); Apartment in >5 Storey Building (80 units, 2%); Semi-Detached House (180 units, 4%); Row House (735 units, 18%); Apartment or Flat in Duplex (865 units, 21%); Apartment in <5 Storey Building (620 units, 15%); Other Single-Attached House (15 units, 0%)]
² Typically meaning either a duplex, or a secondary suite and main suite in a single-detached home.
Housing Trends
TENURE & INCOME
Overall, the median household income in View Royal is higher than the region as a whole, $83,968 in View Royal, compared to $69,642 across the CRD. The median income grew by 5.6% between 2006 and 2011.
Income
- RENTERS: $57,180
- OWNERS: $96,317
Households
- RENTERS: 1,170
- OWNERS: 2,985
HOMEOWNERSHIP
Between 2010 and 2018, the average sale price of a single family home in View Royal increased by more than 35%, while the cost of a townhouse increase by 28% and the cost of a condominium increased by nearly half (49%)
[Chart: Sales Prices by Dwelling Type, 2010-2018 line graph showing: Single Family rising from $603,972 to $819,233; Townhouses rising from $398,758 to $512,363; and Condos rising from $274,217 to $407,700]
Median-earning couples without children are able to afford smaller dwelling types (apartments), but may have challenges affording a row home and cannot afford an average price single-detached home. Median earning couples with children are also unable to afford a single-family home, but can afford average price row homes and apartments, even when factoring in additional shelter costs, such as property tax, services and utilities.
Affordability for Owners, View Royal, 2018
| HOUSEHOLDS | MEDIAN HOUSEHOLD INCOME (2018)³ | AFFORDABLE SHELTER PAYMENTS⁴ | MORTGAGE PAYMENT, SINGLE-DETACHED $819,233 | MORTGAGE PAYMENT, ROW HOUSE $512,362 | MORTGAGE PAYMENT, APARTMENT $407,700 |
|---|---|---|---|---|---|
| COUPLE-WITH-CHILDREN | $126,928 | $3,173 | $3,664 | $2,291 | $1,808 |
| COUPLE-WITHOUT-CHILDREN | $97,221 | $2,431 | $3,664 | $2,291 | $1,808 |
| LONE-PARENT | $63,365 | $1,584 | $3,664 | $2,291 | $1,808 |
| ONE-PERSON HOUSEHOLD | $45,844 | $1,146 | $3,664 | $2,291 | $1,808 |
RENTERSHIP
Between 2010 and 2018, there have consistently been about 260 purpose-built rental units counted by CMHC in their Rental Market Survey. These represent only a little over one in five of all rental units counted in 2016, meaning that of the 1,170 renters counted by the Census nearly 4 in 5 were in some form of secondary rental unit. Between 2008, purpose-built rental units saw a 33% increase in average rents.
[Chart: Median Rents by Number of Bedrooms, 2008 - 2018 line graph showing: Total increasing from $1,009 to $1,500; 2 bedroom increasing from $890 to $1,380]
Affordability for Renters, View Royal, 2018
| HOUSEHOLDS | MEDIAN HOUSEHOLD INCOME (2018)³ | AFFORDABLE SHELTER PAYMENTS⁴ | 1 BEDROOM | 2 BEDROOM | 3 BEDROOM | AVERAGE TOTAL |
|---|---|---|---|---|---|---|
| COUPLE-WITH-CHILDREN | $126,928 | $3,173 | n/a | $1,380 | n/a | $1,500 |
| COUPLE-WITHOUT-CHILDREN | $97,221 | $2,431 | n/a | $1,380 | n/a | $1,500 |
| LONE-PARENT | $63,365 | $1,584 | n/a | $1,380 | n/a | $1,500 |
| ONE-PERSON HOUSEHOLD | $45,844 | $1,146 | n/a | $1,380 | n/a | $1,500 |
² Two-bedroom home was selected, both because of quality of data and to suggest a modestly priced and sized home. ³ Incomes are adjusted to 2018 estimates using historical growth rates. ⁴ For owners, shelter costs include, as applicable, mortgage payments (principal and interest), property taxes, condominium fees, and payments for electricity, fuel, water and other municipal services. For the purposes of this exercise mortgage payments are calculated using a 25-year amortization, with 2.99% interest, and a 10% downpayment. Mortgage costs do not include any other shelter costs.
CORE HOUSING NEED AND NON-MARKET UNITS
Core housing need provides a strong indicator of the need for non-market housing units. Overall, there are 355 households in core housing need in View Royal; 225 of these households (63%) are renters and 125 of these are owners. One hundred sixty households are in extreme core housing need, composed of 85 renters and 75 owners. This indicates a need for up to 225 non-market rental units in order to support renting households in core housing need, and may indicate other supports are necessary for owners in core housing need.
Summary of Key Issues
COST OF HOUSING
Currently, the increase in housing costs is outpacing the rise incomes in View Royal. While median household income grew by about 0.6% per year between 2006 and 2016, home prices grew by between about 4% and 6% per year (depending on type) between 2010 and 2018. While these time periods do not exactly correspond, they provide an overall indication that rising incomes are not keeping pace with the cost of ownership.
DIVERSITY OF HOUSING STOCK AND AFFORDABILITY
View Royal’s stock remains predominantly single-detached dwellings or comparable housing types. However, these are the least affordable unit types and out of reach of all median earning household groups, even if they are typically dual income (e.g. couples with children). However, more diverse housing stock is not being built to keep pace with the need for more affordable options for first-time buyers and young families purchasing in the community.
NO NEW PURPOSE BUILT RENTAL
The number of purpose-built rental units in View Royal has remained stagnant since at least 2010. About 80% of renters are in the secondary market, renting suites, private homes and condominiums. However, there is less security of tenure in the secondary market, due to home resale, evictions in order to house family members, or shifting secondary suites to short-term vacation rentals.
NEED FOR NON-MARKET UNITS
Core housing need and extreme core housing need are most pronounced in renter households, indicating a need for additional non-market supports, and speaks to the need for about 225 new non-market units to support existing affordable housing need, with about 85 of these households in extreme need and likely suffering significant housing vulnerability.
Document Images
(1)