Attachment 5. Transportation Impact Assessment – Watt Consulting Group
Technical report assessing the traffic impacts on the Watkiss Way and Erskine Lane intersection.
7 ERSKINE LANE RE-DEVELOPMENT
Traffic Impact Assessment
Prepared for: Mark Johnston Prepared by: Watt Consulting Group Our File: 2296.B01 Date: January 3, 2018
TABLE OF CONTENTS
1.0 INTRODUCTION ........................................................................................ 1 1.1 Study Area .......................................................................................... 1 2.0 EXISTING CONDITIONS ............................................................................ 1 2.1 Land Use ............................................................................................. 1 2.2 Road Network ...................................................................................... 2 2.3 Traffic Count ........................................................................................ 2 2.4 Traffic Modelling – Background Information ........................................ 2 2.5 Existing Traffic – Results ..................................................................... 2 3.0 POST DEVELOPMENT CONDITIONS ....................................................... 3 3.1 Proposed Land Use ............................................................................. 3 3.2 Site Access .......................................................................................... 3 3.3 Trip Generation .................................................................................... 4 3.4 Trip Assignment ................................................................................... 4 3.5 Post Development Traffic Analysis Results - Full Build Out ................. 4 4.0 2027 POST DEVELOPMENT CONDITIONS .............................................. 6 4.1 2027 Post Development Conditions .................................................... 6 4.2 Left Turn Lane Warrant Review ........................................................... 7 5.0 OTHER MODES .......................................................................................... 7 5.1 Pedestrians and Cyclists ..................................................................... 7 5.2 Transit ................................................................................................. 7 6.0 CONCLUSIONS .......................................................................................... 8 7.0 RECOMMENDATION ................................................................................. 8
APPENDICES
Appendix A: Synchro Background
LIST OF FIGURES
Figure 1: Study Area and Site Location ............................................................. 1 Figure 2: 2017 Existing Volumes and Levels of Service .................................... 3 Figure 3: Proposed Site Plan (2nd Floor) .......................................................... 3 Figure 4: 2017 Post Development PM Volumes and Levels of Service ............. 5 Figure 5: 2027 Post Development PM Volumes and Levels of Service ............. 7
LIST OF TABLES
Table 1: Peak Hour Trip Generation .................................................................. 4 Table 2: 2017 AM Peak Hour Traffic Conditions Comparison .......................... 5 Table 3: 2017 PM Peak Hour Traffic Conditions Comparison .......................... 5 Table 4: 2027 AM Peak Hour Traffic Conditions Comparison .......................... 6 Table 5: 2027 PM Peak Hour Traffic Conditions Comparison .......................... 6
1.0 INTRODUCTION
Watt Consulting Group was retained by Mark Johnston to conduct a traffic impact assessment for a proposed residential development at 7 Erskine Lane in View Royal, BC. An analysis of post-development conditions was undertaken in order to provide a clear view of the impacts on the intersection of Watkiss Way / Erskine Lane. Study recommendations and conclusions are to provide safe and efficient movement of vehicular traffic for the proposed development while minimizing the impact to non-site trips.
1.1 STUDY AREA
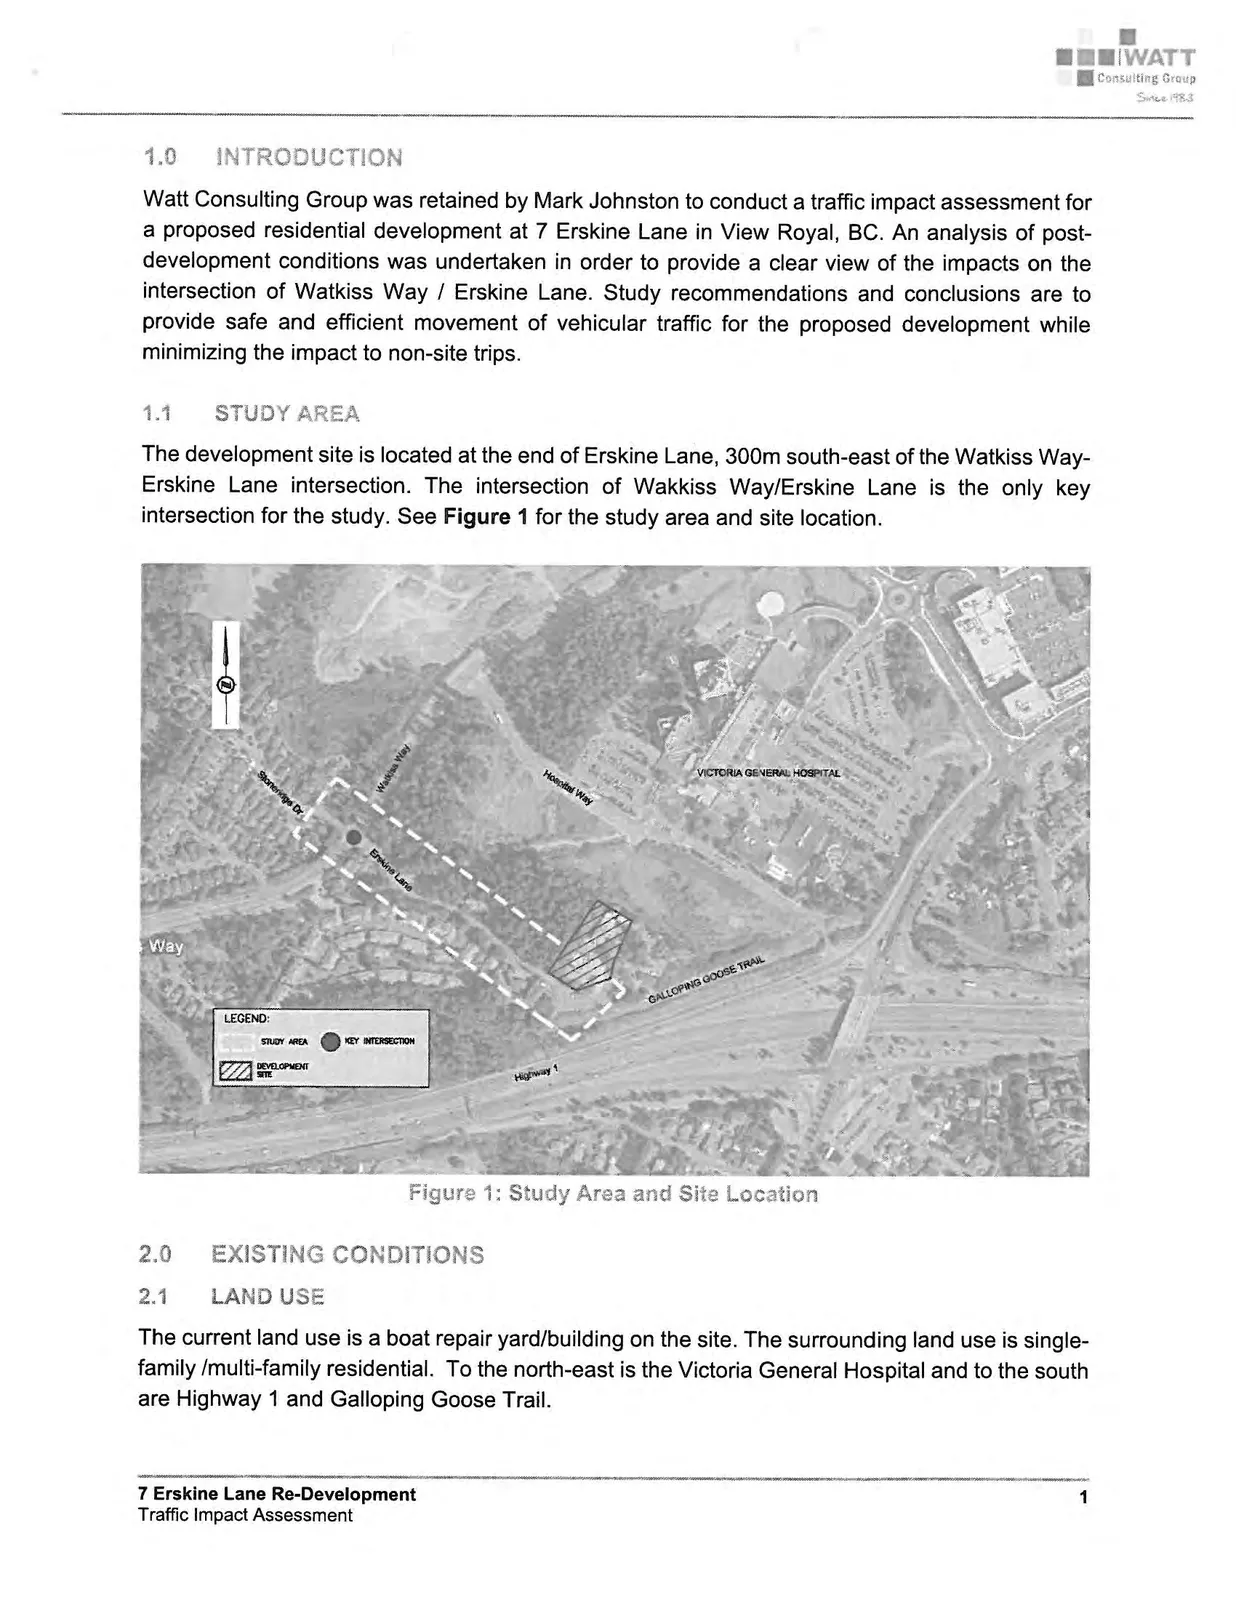
The development site is located at the end of Erskine Lane, 300m south-east of the Watkiss Way-Erskine Lane intersection. The intersection of Wakkiss Way/Erskine Lane is the only key intersection for the study. See Figure 1 for the study area and site location.
2.0 EXISTING CONDITIONS
2.1 LAND USE
The current land use is a boat repair yard/building on the site. The surrounding land use is single-family /multi-family residential. To the north-east is the Victoria General Hospital and to the south are Highway 1 and Galloping Goose Trail.
2.2 ROAD NETWORK
Watkiss Way is a two-lane undivided major road. Erskine Lane is a no-through local road providing access to the development site. As Erskine Lane dead ends at the site, all site traffic will use the intersection of Watkiss Way / Erskine Lane.
The four-legged intersection of Watkiss Way / Erskine Lane is stop-controlled on Erskine Lane with no separate left turn lanes.
2.3 TRAFFIC COUNT
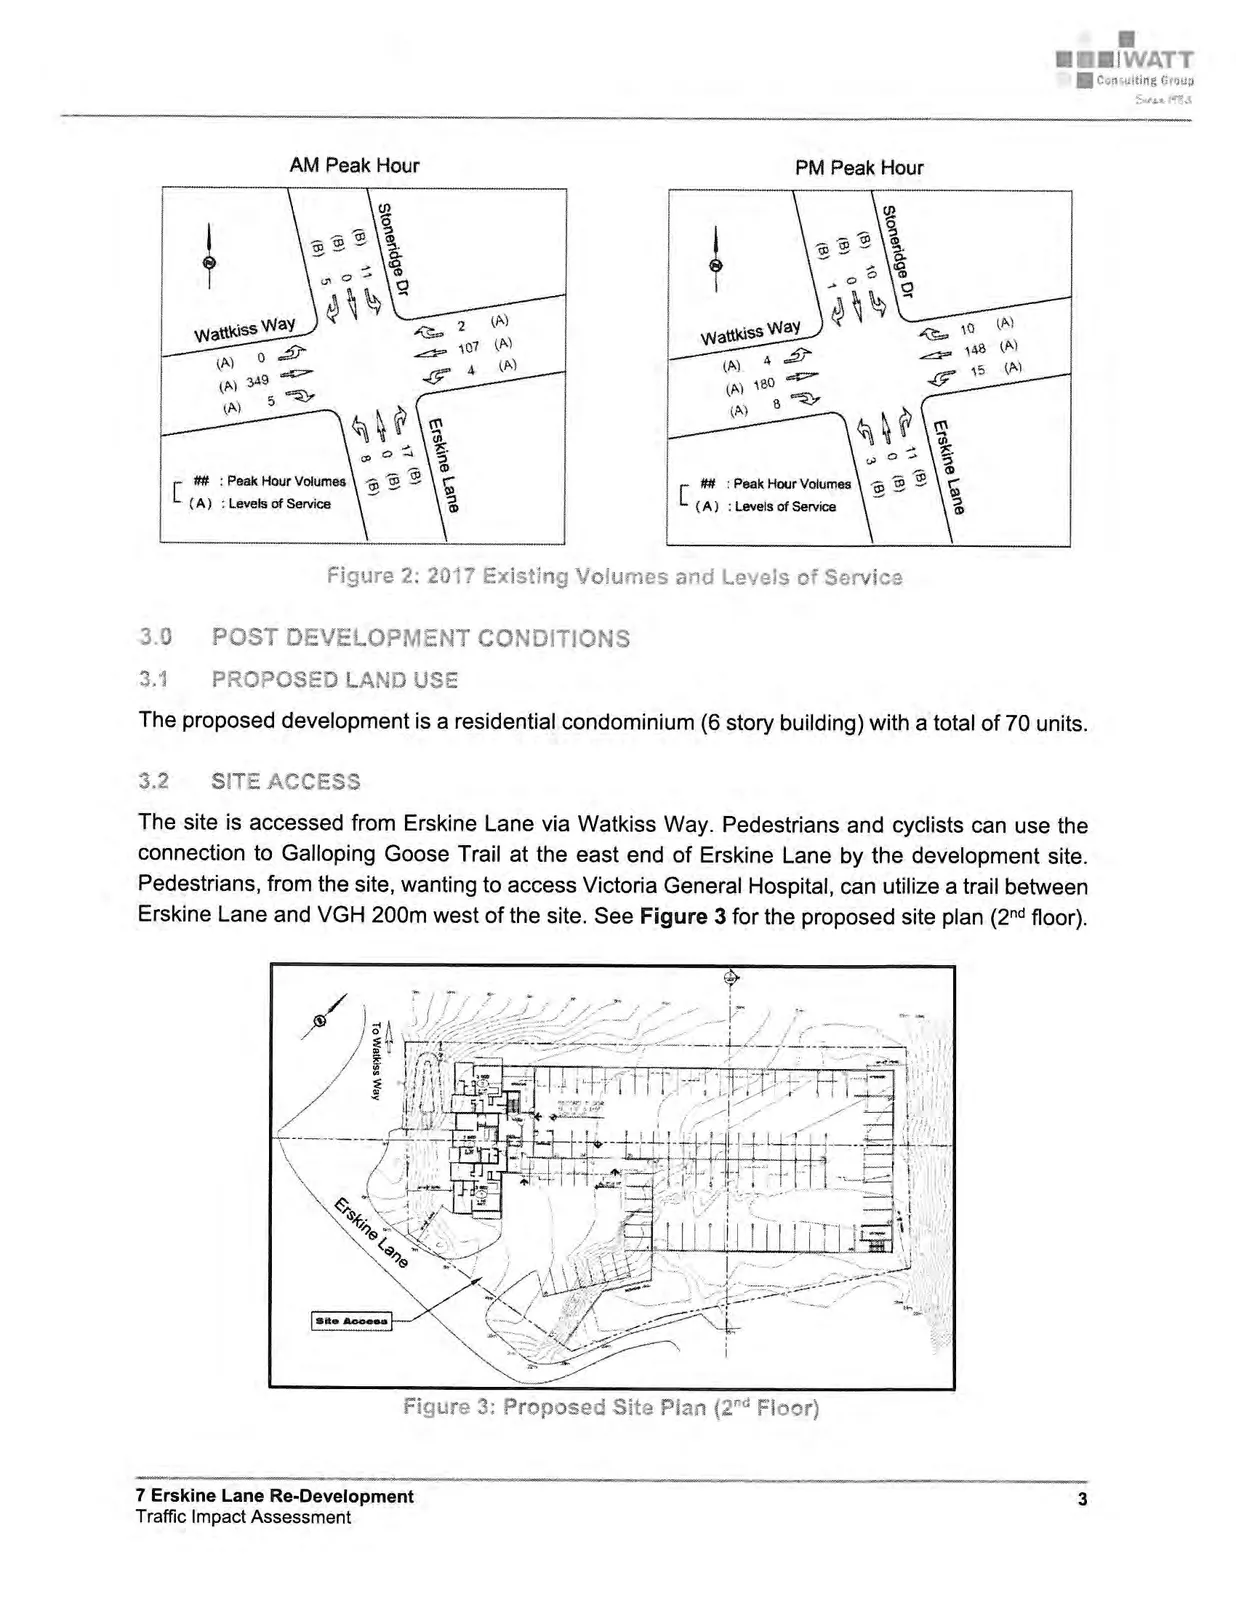
Turning movement counts were undertaken at the intersection of Watkiss Way / Erskine Lane-Stoneridge Drive in the AM and PM peak hours on November 16, 2017. See Figure 2 for the existing traffic volumes.
2.4 TRAFFIC MODELLING – BACKGROUND INFORMATION
Analysis of the traffic conditions at the intersections within the study area were undertaken using Synchro software (for signalized and stop-controlled intersections).
Synchro / SimTraffic is a two-part traffic modelling software that provides analysis of traffic conditions based on traffic control, geometry, volumes and traffic operations. Synchro software (Synchro 8) is used because of its ability to provide analysis using the Highway Capacity Manual (2010) methodology, while SimTraffic integrates established driver behaviours and characteristics to simulate actual conditions by randomly "seeding" or positioning vehicles travelling throughout the network. These measures of effectiveness include level of service (LOS), delay and 95th percentile queue length.
The type of traffic control are analyzed to determine the level of service and delays. The level of services are broken down into six letter grades with LOS A being excellent operations and LOS F being unstable/failure operations. Level of service C is generally considered to be an acceptable LOS by most municipalities. Level of service D is generally considered to be on the threshold between acceptable and unacceptable operations. A description of level of service and Synchro is provided in Appendix A.
2.5 EXISTING TRAFFIC – RESULTS
Existing traffic conditions were analyzed at the Watkiss Way / Erskine Lane intersection in the AM and PM peak hours using Synchro. Overall traffic conditions are at good levels of service based on the analysis. All movements are operating at a LOS A or B in the AM and PM peak hours. See Figure 2 for the 2017 existing peak hour volumes and levels of service.
3.0 POST DEVELOPMENT CONDITIONS
3.1 PROPOSED LAND USE
The proposed development is a residential condominium (6 story building) with a total of 70 units.
3.2 SITE ACCESS
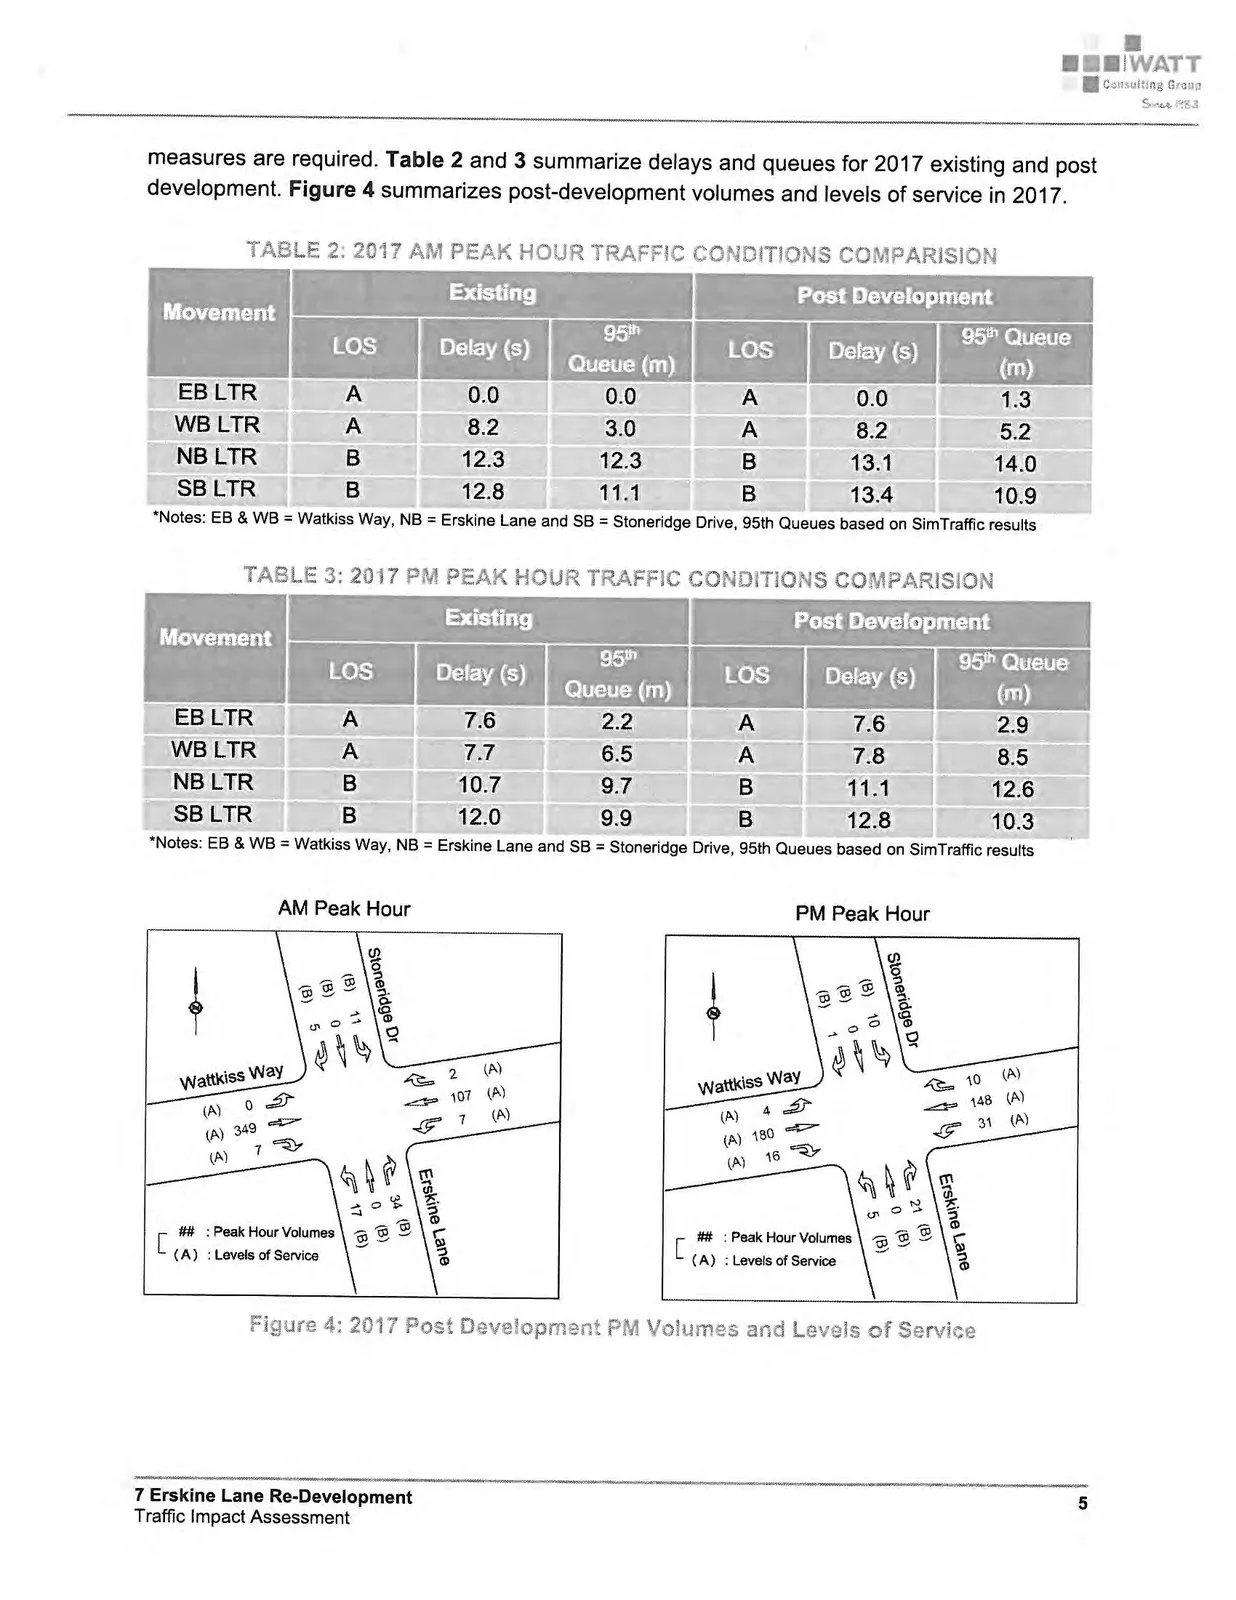
The site is accessed from Erskine Lane via Watkiss Way. Pedestrians and cyclists can use the connection to Galloping Goose Trail at the east end of Erskine Lane by the development site. Pedestrians, from the site, wanting to access Victoria General Hospital, can utilize a trail between Erskine Lane and VGH 200m west of the site. See Figure 3 for the proposed site plan (2nd floor).
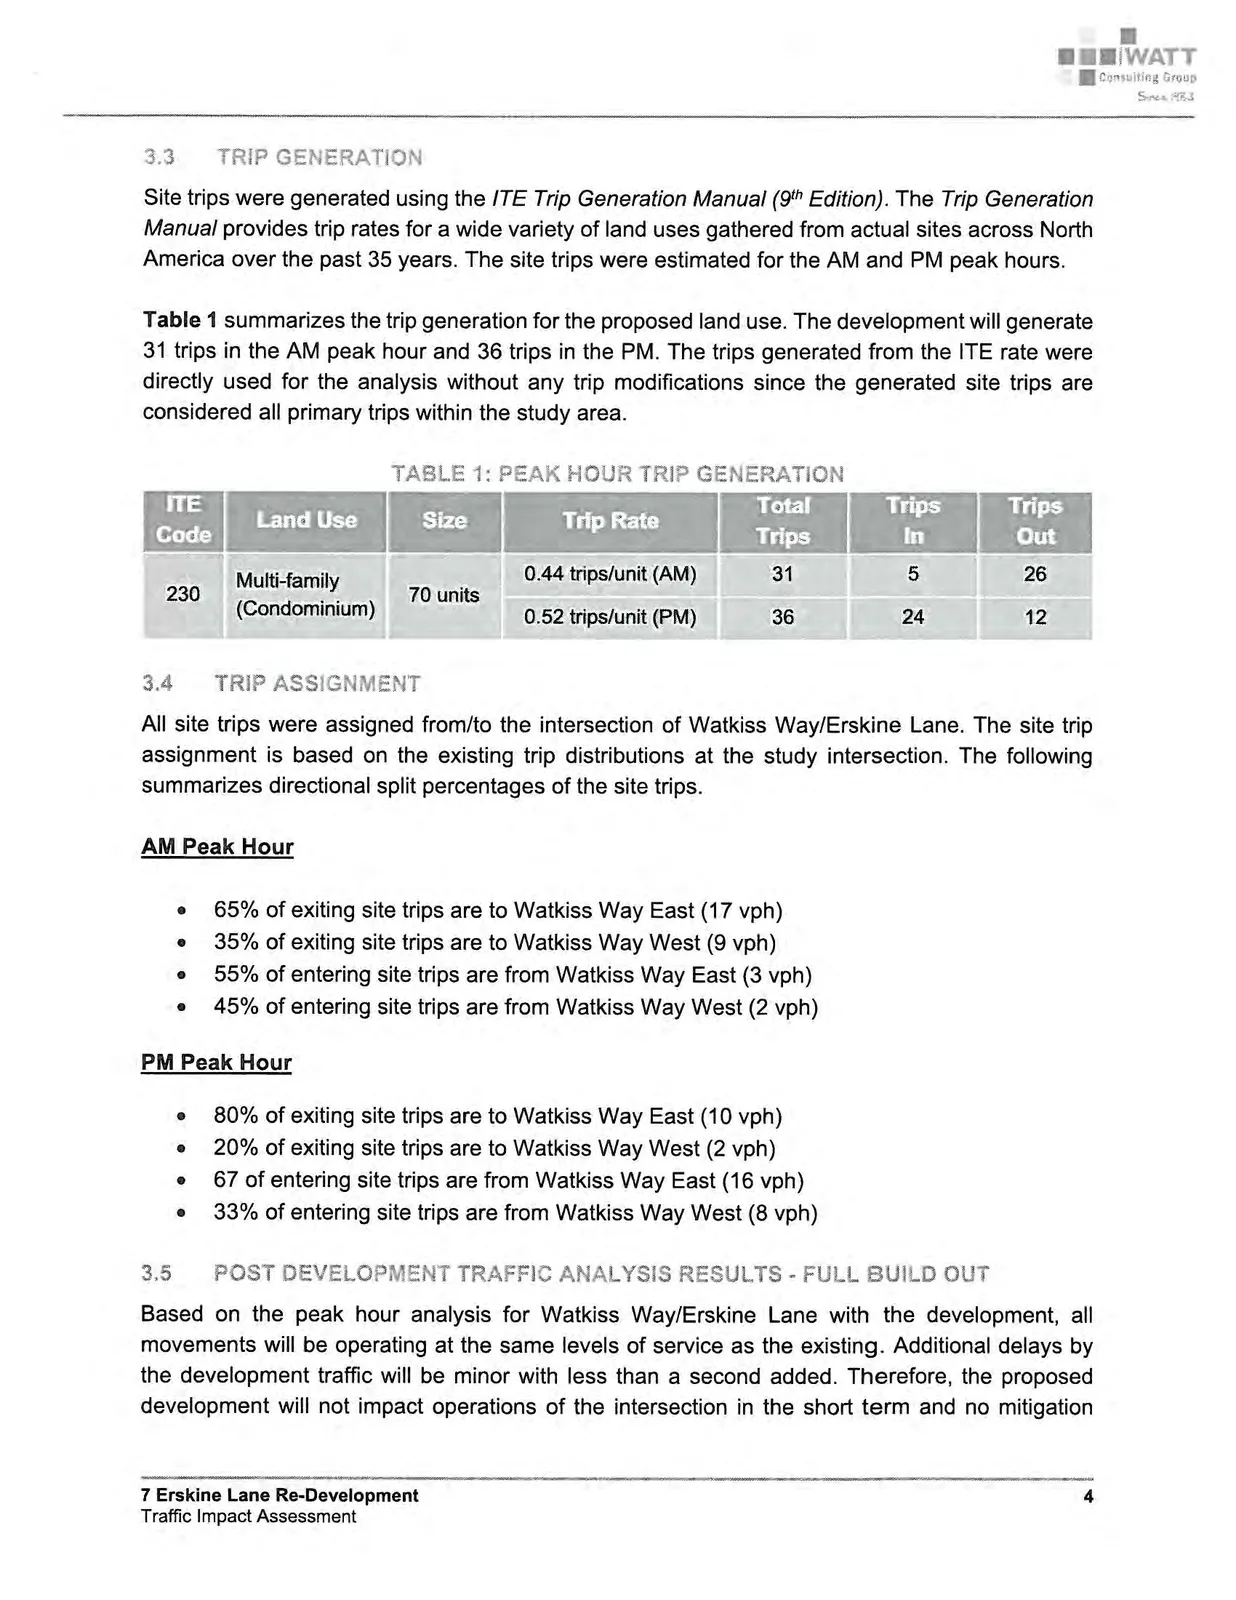
3.3 TRIP GENERATION
Site trips were generated using the ITE Trip Generation Manual (9th Edition). The Trip Generation Manual provides trip rates for a wide variety of land uses gathered from actual sites across North America over the past 35 years. The site trips were estimated for the AM and PM peak hours.
Table 1 summarizes the trip generation for the proposed land use. The development will generate 31 trips in the AM peak hour and 36 trips in the PM. The trips generated from the ITE rate were directly used for the analysis without any trip modifications since the generated site trips are considered all primary trips within the study area.
TABLE 1: PEAK HOUR TRIP GENERATION
| ITE Code | Land Use | Size | Trip Rate | Total Trips | Trips In | Trips Out |
|---|---|---|---|---|---|---|
| 230 | Multi-family (Condominium) | 70 units | 0.44 trips/unit (AM) | 31 | 5 | 26 |
| 0.52 trips/unit (PM) | 36 | 24 | 12 |
3.4 TRIP ASSIGNMENT
All site trips were assigned from/to the intersection of Watkiss Way/Erskine Lane. The site trip assignment is based on the existing trip distributions at the study intersection. The following summarizes directional split percentages of the site trips.
AM Peak Hour
- 65% of exiting site trips are to Watkiss Way East (17 vph)
- 35% of exiting site trips are to Watkiss Way West (9 vph)
- 55% of entering site trips are from Watkiss Way East (3 vph)
- 45% of entering site trips are from Watkiss Way West (2 vph)
PM Peak Hour
- 80% of exiting site trips are to Watkiss Way East (10 vph)
- 20% of exiting site trips are to Watkiss Way West (2 vph)
- 67% of entering site trips are from Watkiss Way East (16 vph)
- 33% of entering site trips are from Watkiss Way West (8 vph)
3.5 POST DEVELOPMENT TRAFFIC ANALYSIS RESULTS - FULL BUILD OUT
Based on the peak hour analysis for Watkiss Way/Erskine Lane with the development, all movements will be operating at the same levels of service as the existing. Additional delays by the development traffic will be minor with less than a second added. Therefore, the proposed development will not impact operations of the intersection in the short term and no mitigation measures are required. Table 2 and 3 summarize delays and queues for 2017 existing and post development. Figure 4 summarizes post-development volumes and levels of service in 2017.
TABLE 2: 2017 AM PEAK HOUR TRAFFIC CONDITIONS COMPARISON
| Movement | Existing | Post Development | | :--- | :---: | :---: | :---: | :---: | | | LOS | Delay (s) | 95th Queue (m) | LOS | Delay (s) | 95th Queue (m) | | EB LTR | A | 0.0 | 0.0 | A | 0.0 | 1.3 | | WB LTR | A | 8.2 | 3.0 | A | 8.2 | 5.2 | | NB LTR | B | 12.3 | 12.3 | B | 13.1 | 14.0 | | SB LTR | B | 12.8 | 11.1 | B | 13.4 | 10.9 |
*Notes: EB & WB = Watkiss Way, NB = Erskine Lane and SB = Stoneridge Drive, 95th Queues based on SimTraffic results
TABLE 3: 2017 PM PEAK HOUR TRAFFIC CONDITIONS COMPARISON
| Movement | Existing | Post Development | | :--- | :---: | :---: | :---: | :---: | | | LOS | Delay (s) | 95th Queue (m) | LOS | Delay (s) | 95th Queue (m) | | EB LTR | A | 7.6 | 2.2 | A | 7.6 | 2.9 | | WB LTR | A | 7.7 | 6.5 | A | 7.8 | 8.5 | | NB LTR | B | 10.7 | 9.7 | B | 11.1 | 12.6 | | SB LTR | B | 12.0 | 9.9 | B | 12.8 | 10.3 |
*Notes: EB & WB = Watkiss Way, NB = Erskine Lane and SB = Stoneridge Drive, 95th Queues based on SimTraffic results
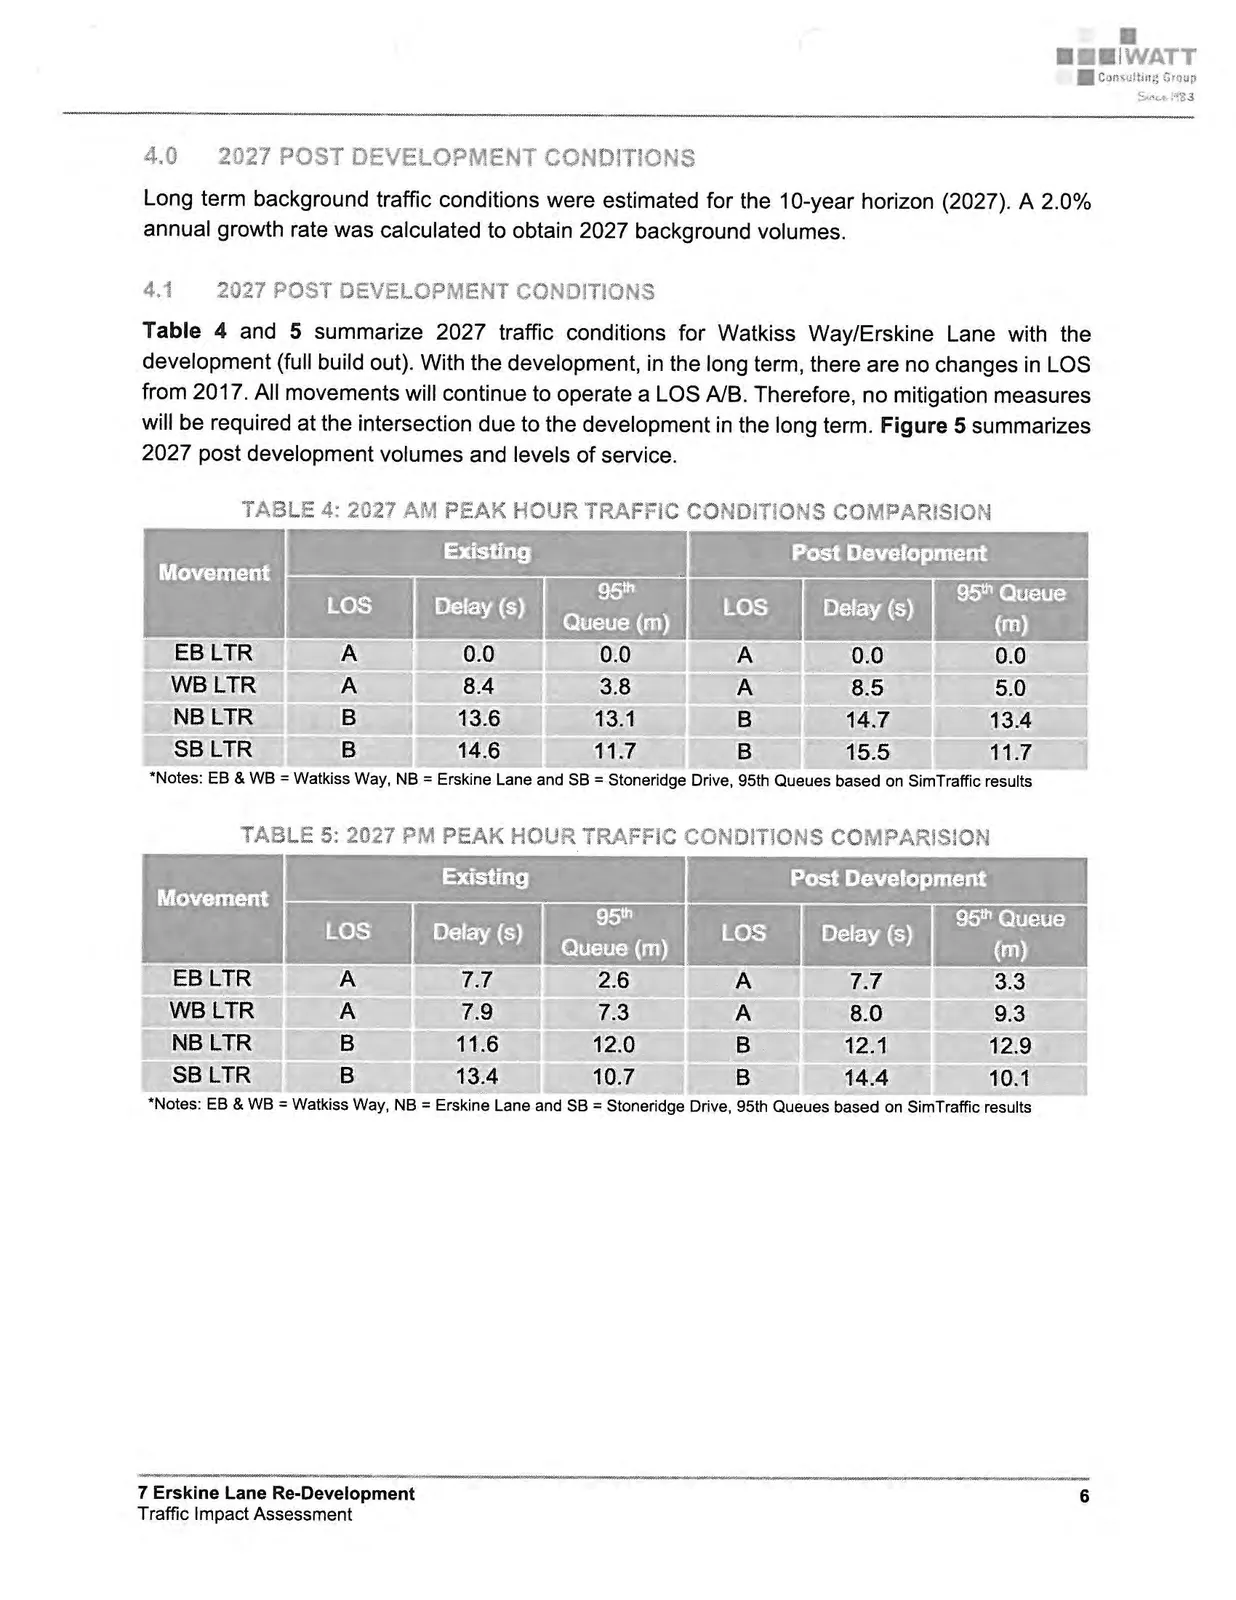
4.0 2027 POST DEVELOPMENT CONDITIONS
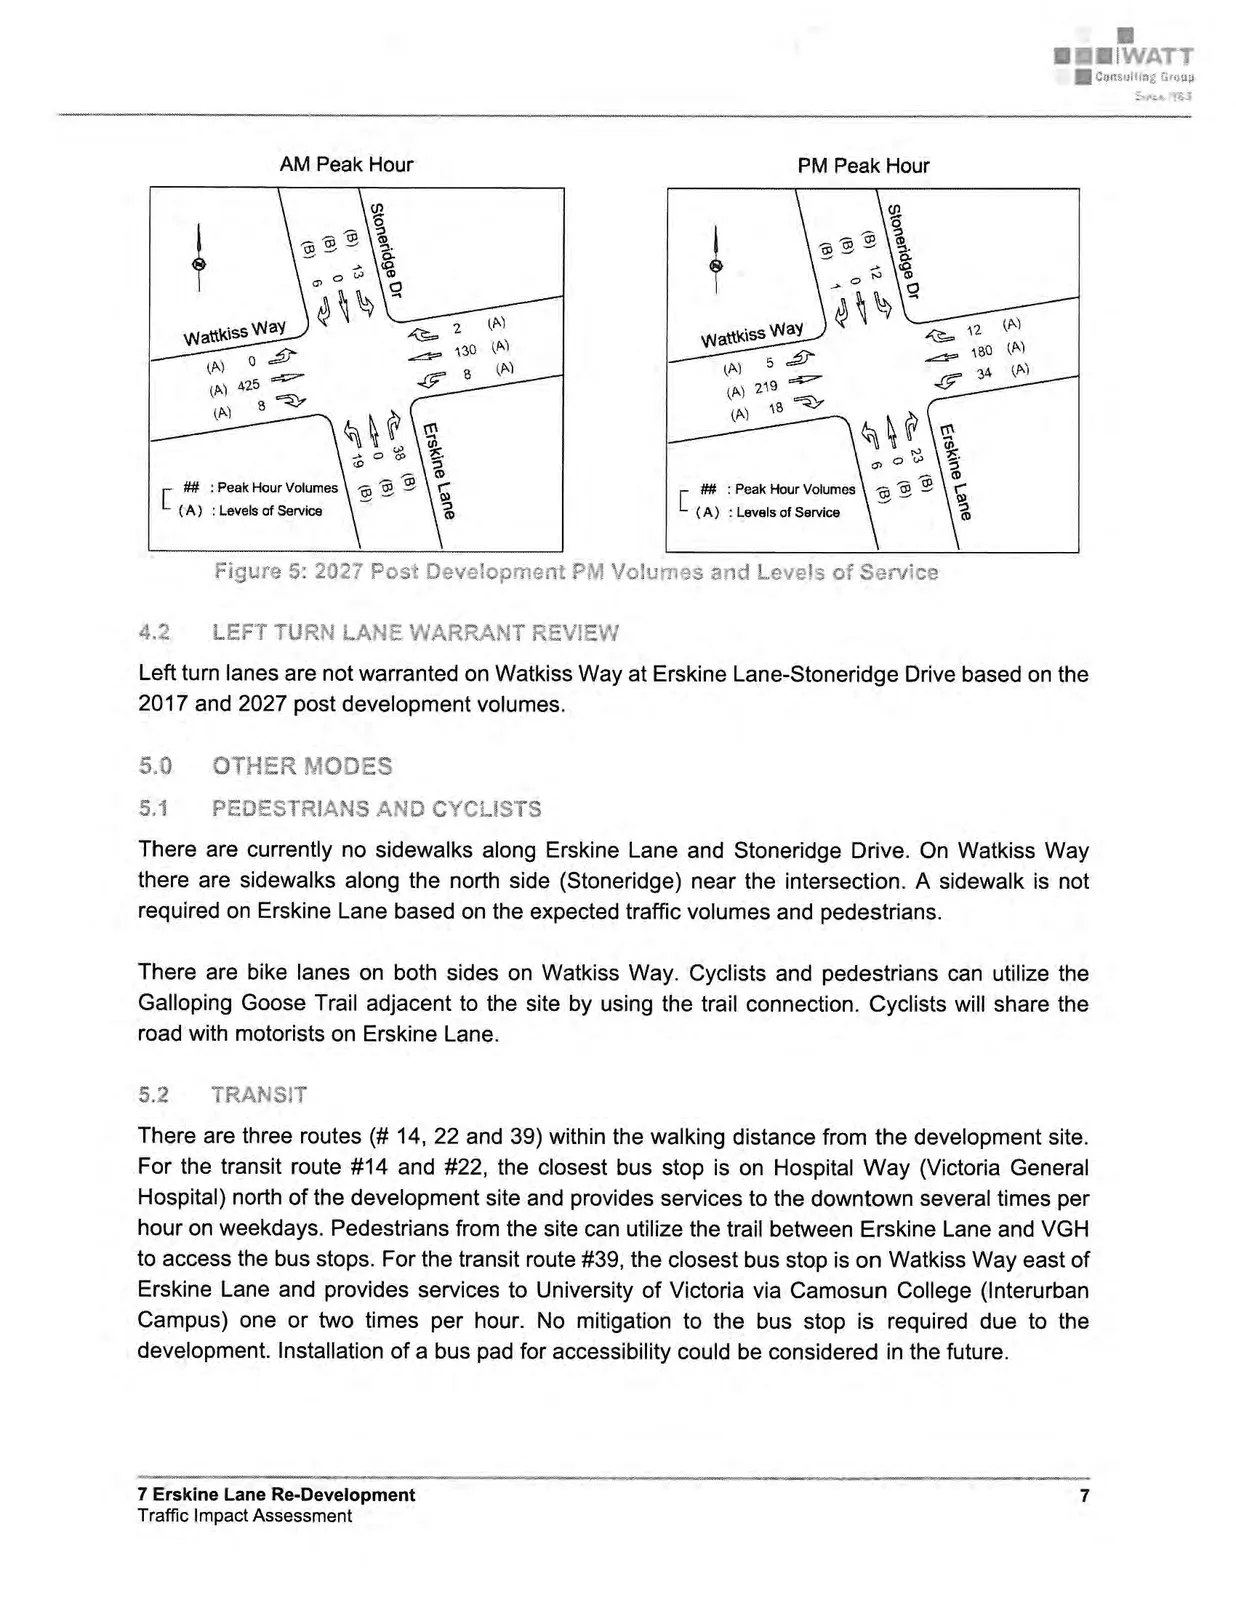
Long term background traffic conditions were estimated for the 10-year horizon (2027). A 2.0% annual growth rate was calculated to obtain 2027 background volumes.
4.1 2027 POST DEVELOPMENT CONDITIONS
Table 4 and 5 summarize 2027 traffic conditions for Watkiss Way/Erskine Lane with the development (full build out). With the development, in the long term, there are no changes in LOS from 2017. All movements will continue to operate a LOS A/B. Therefore, no mitigation measures will be required at the intersection due to the development in the long term. Figure 5 summarizes 2027 post development volumes and levels of service.
TABLE 4: 2027 AM PEAK HOUR TRAFFIC CONDITIONS COMPARISON
| Movement | Existing | Post Development | | :--- | :---: | :---: | :---: | :---: | | | LOS | Delay (s) | 95th Queue (m) | LOS | Delay (s) | 95th Queue (m) | | EB LTR | A | 0.0 | 0.0 | A | 0.0 | 0.0 | | WB LTR | A | 8.4 | 3.8 | A | 8.5 | 5.0 | | NB LTR | B | 13.6 | 13.1 | B | 14.7 | 13.4 | | SB LTR | B | 14.6 | 11.7 | B | 15.5 | 11.7 |
*Notes: EB & WB = Watkiss Way, NB = Erskine Lane and SB = Stoneridge Drive, 95th Queues based on SimTraffic results
TABLE 5: 2027 PM PEAK HOUR TRAFFIC CONDITIONS COMPARISON
| Movement | Existing | Post Development | | :--- | :---: | :---: | :---: | :---: | | | LOS | Delay (s) | 95th Queue (m) | LOS | Delay (s) | 95th Queue (m) | | EB LTR | A | 7.7 | 2.6 | A | 7.7 | 3.3 | | WB LTR | A | 7.9 | 7.3 | A | 8.0 | 9.3 | | NB LTR | B | 11.6 | 12.0 | B | 12.1 | 12.9 | | SB LTR | B | 13.4 | 10.7 | B | 14.4 | 10.1 |
*Notes: EB & WB = Watkiss Way, NB = Erskine Lane and SB = Stoneridge Drive, 95th Queues based on SimTraffic results
4.2 LEFT TURN LANE WARRANT REVIEW
Left turn lanes are not warranted on Watkiss Way at Erskine Lane-Stoneridge Drive based on the 2017 and 2027 post development volumes.
5.0 OTHER MODES
5.1 PEDESTRIANS AND CYCLISTS
There are currently no sidewalks along Erskine Lane and Stoneridge Drive. On Watkiss Way there are sidewalks along the north side (Stoneridge) near the intersection. A sidewalk is not required on Erskine Lane based on the expected traffic volumes and pedestrians.
There are bike lanes on both sides on Watkiss Way. Cyclists and pedestrians can utilize the Galloping Goose Trail adjacent to the site by using the trail connection. Cyclists will share the road with motorists on Erskine Lane.
5.2 TRANSIT
There are three routes (# 14, 22 and 39) within the walking distance from the development site. For the transit route #14 and #22, the closest bus stop is on Hospital Way (Victoria General Hospital) north of the development site and provides services to the downtown several times per hour on weekdays. Pedestrians from the site can utilize the trail between Erskine Lane and VGH to access the bus stops. For the transit route #39, the closest bus stop is on Watkiss Way east of Erskine Lane and provides services to University of Victoria via Camosun College (Interurban Campus) one or two times per hour. No mitigation to the bus stop is required due to the development. Installation of a bus pad for accessibility could be considered in the future.
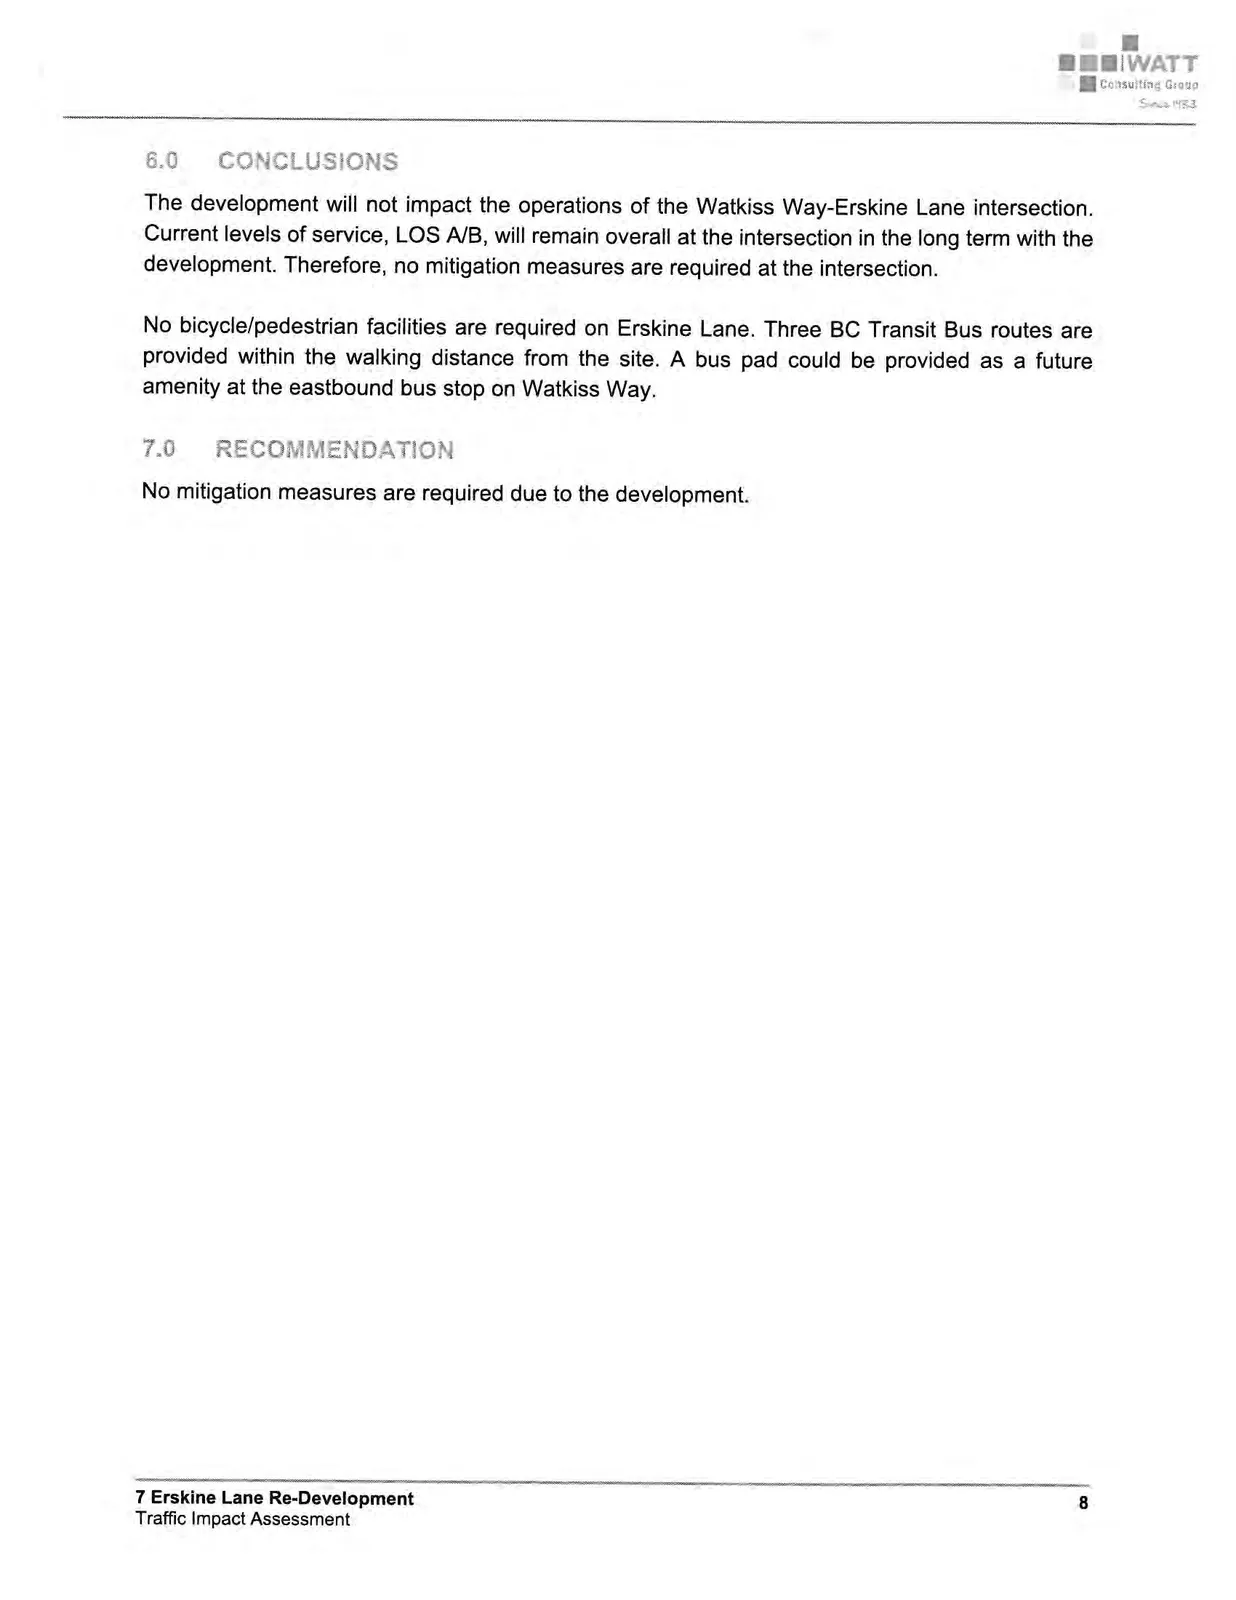
6.0 CONCLUSIONS
The development will not impact the operations of the Watkiss Way-Erskine Lane intersection. Current levels of service, LOS A/B, will remain overall at the intersection in the long term with the development. Therefore, no mitigation measures are required at the intersection.
No bicycle/pedestrian facilities are required on Erskine Lane. Three BC Transit Bus routes are provided within the walking distance from the site. A bus pad could be provided as a future amenity at the eastbound bus stop on Watkiss Way.
7.0 RECOMMENDATION
No mitigation measures are required due to the development.
APPENDIX A: SYNCHRO BACKGROUND
SYNCHRO MODELLING SOFTWARE DESCRIPTION
The traffic analysis was completed using Synchro and SimTraffic traffic modeling software. Results were measured in delay, level of service (LOS) and 95th percentile queue length. Synchro is based on the Highway Capacity Manual (HCM) methodology. SimTraffic integrates established driver behaviours and characteristics to simulate actual conditions by randomly "seeding" or positioning vehicles travelling throughout the network. The simulation is run five times (five different random seedings of vehicle types, behaviours and arrivals) to obtain statistical significance of the results.
Levels of Service
Traffic operations are typically described in terms of levels of service, which rates the amount of delay per vehicle for each movement and the entire intersection. Levels of service range from LOS A (representing best operations) to LOS E/F (LOS E being poor operations and LOS F being unpredictable/disruptive operations). LOS E/F are generally unacceptable levels of service under normal everyday conditions.
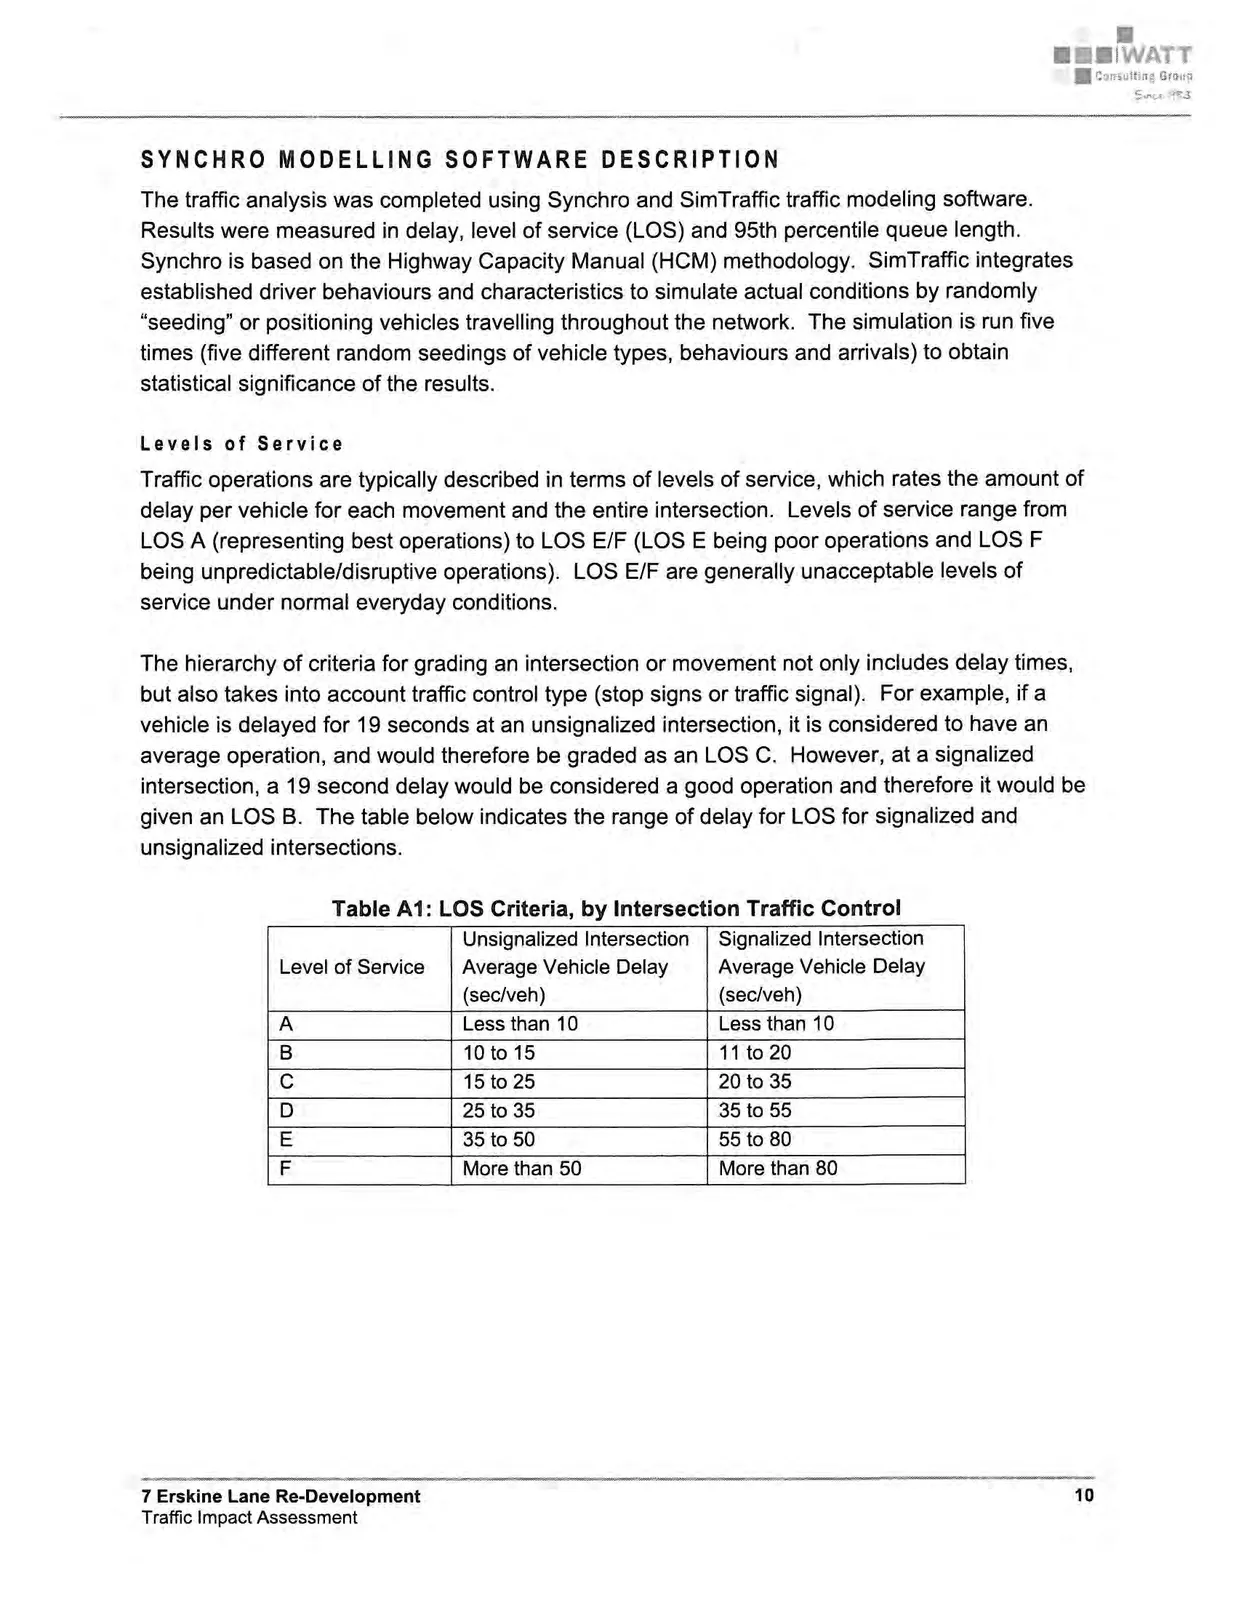
The hierarchy of criteria for grading an intersection or movement not only includes delay times, but also takes into account traffic control type (stop signs or traffic signal). For example, if a vehicle is delayed for 19 seconds at an unsignalized intersection, it is considered to have an average operation, and would therefore be graded as an LOS C. However, at a signalized intersection, a 19 second delay would be considered a good operation and therefore it would be given an LOS B. The table below indicates the range of delay for LOS for signalized and unsignalized intersections.
Table A1: LOS Criteria, by Intersection Traffic Control
| Level of Service | Unsignalized Intersection Average Vehicle Delay (sec/veh) | Signalized Intersection Average Vehicle Delay (sec/veh) |
|---|---|---|
| A | Less than 10 | Less than 10 |
| B | 10 to 15 | 11 to 20 |
| C | 15 to 25 | 20 to 35 |
| D | 25 to 35 | 35 to 55 |
| E | 35 to 50 | 55 to 80 |
| F | More than 50 | More than 80 |
Document Images
(9)