Attachment 6. Traffic Impact Assessment Addendum – Watt Consulting Group
Supplemental traffic analysis expanding the study area to include Burnside Road and Helmcken Road intersections.
7 ERSKINE LANE RE-DEVELOPMENT
TIA Addendum #1
Prepared for: Mark Johnston Prepared by: Watt Consulting Group Our File: 2296.B01 Date: November 23, 2018
TABLE OF CONTENTS
1.0 INTRODUCTION ................................................................................................... 1 2.0 EXISTING CONDITIONS ...................................................................................... 1 2.1 Traffic Counts ........................................................................................................ 1 2.2 Traffic Modelling .................................................................................................... 1 2.3 Traffic Modelling – Background Information .......................................................... 1 2.4 Analysis Results – Existing Conditions.................................................................. 2 3.0 POST DEVELOPMENT CONDITIONS ................................................................. 3 3.1 Trip Generation & Assignment .............................................................................. 3 3.2 Analysis Results – Post Development Conditions ................................................. 5 4.0 2028 POST DEVELOPMENT CONDITIONS ........................................................ 6 4.1 Analysis Results – 2028 Background Conditions .................................................. 6 4.2 Analysis Results – 2028 Post Development Conditions ........................................ 8 5.0 ON-STREET PARKING ...................................................................................... 10 6.0 CONCLUSIONS .................................................................................................. 11
APPENDICES Appendix A: Synchro Background Appendix B: 2018 Existing and Post Development Conditions Appendix C: 2028 Background and Post Development Conditions
LIST OF FIGURES Figure 1: Existing 2018 Intersection Volumes and LOS – AM Peak Hour .................................... 2 Figure 2: Existing 2018 Intersection Volumes and LOS – PM Peak Hour .................................... 3 Figure 3: AM Peak Hour Trip Assignment .................................................................................... 4 Figure 4: PM Peak Hour Trip Assignment .................................................................................... 4 Figure 5: 2018 Post Development Intersection Volumes and LOS – AM Peak Hour ................... 5 Figure 6: 2018 Post Development Intersection Volumes and LOS – PM Peak Hour ................... 6 Figure 7: 2028 Background Intersection Volumes and LOS – AM Peak Hour.............................. 7 Figure 8: 2028 Background Intersection Volumes and LOS – PM Peak Hour.............................. 8 Figure 9: 2028 Post Development Intersection Volumes and LOS – AM Peak Hour ................... 9 Figure 10: 2028 Post Development Intersection Volumes and LOS – PM Peak Hour ............... 10 Figure 11: Parking Restrictions on Erskine Lane ........................................................................ 11
1.0 INTRODUCTION
In December 2017, Watt Consulting Group conducted a Traffic Impact Assessment for Mark Johnston regarding a proposed residential development at 7 Erskine Lane in View Royal, BC. The original TIA dated January 3, 2018, included a review of the impact to the Watkiss Way / Erskine Lane intersection. This report is an addendum to that TIA that expands the study area to include the intersections at Burnside Road / Watkiss Way and Helmcken Road / Watkiss Way as well as the Watkiss Way roundabout at the access to Victoria General Hospital and the Eagle Creek development. This addendum will examine the existing and post development conditions at the four Watkiss Way intersections noted above to determine the impact of traffic generated by the proposed development. The addendum will also review the impact of the proposed development on the on-street parking on Erskine Lane.
2.0 EXISTING CONDITIONS
2.1 TRAFFIC COUNTS
Turning movement counts were conducted for the Watkiss Way intersections during the AM and PM peak hours (8:00AM – 9:00AM and 4:00PM to 5:00PM, respectively) on the following dates:
- Watkiss Way / Burnside Road: November 14, 2018
- Watkiss Way / Erskine Lane: November 16, 2017
- Watkiss Way / Victoria General Access: November 13, 2018
- Watkiss Way / Helmcken Road: September 6/7, 2017
For the 2017 counts, the volumes were adjusted to 2018 volumes using a 1% annual growth rate. This growth rate was determined using historical CRD traffic volume data for Watkiss Way at Helmcken Road.
2.2 TRAFFIC MODELLING
Analysis of the traffic conditions at the Watkiss Way intersections was undertaken using Synchro and SIDRA traffic modelling software. Synchro was used for the signalized and stop-controlled intersections and SIDRA was used for modelling of the roundabout. Additional background information on traffic modelling including descriptions of the levels of service are included in the 7 Erskine Lane TIA dated January 3, 2018 (Section 2.4 and Appendix A).
2.3 TRAFFIC MODELLING – BACKGROUND INFORMATION
Synchro and SIDRA are traffic modelling software programs that provides analysis of traffic conditions based on traffic control, geometry, volumes and traffic operations to determine measures of effectiveness including level of service (LOS), delay and 95th percentile queue length.
The type of traffic control are analyzed to determine the level of service and delays. The level of services are broken down into six letter grades with LOS A being excellent operations and LOS F being unstable/failure operations. Level of service C is generally considered to be an acceptable LOS by most municipalities. Level of service D is generally considered to be on the threshold between acceptable and unacceptable operations. A description of level of service and Synchro is provided in Appendix A.
2.4 ANALYSIS RESULTS – EXISTING CONDITIONS
The existing traffic volumes and levels of service are shown in Figure 1 for the AM peak hour and Figure 2 for the PM peak hour.
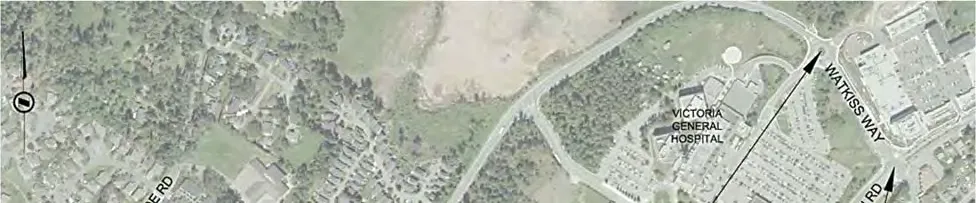
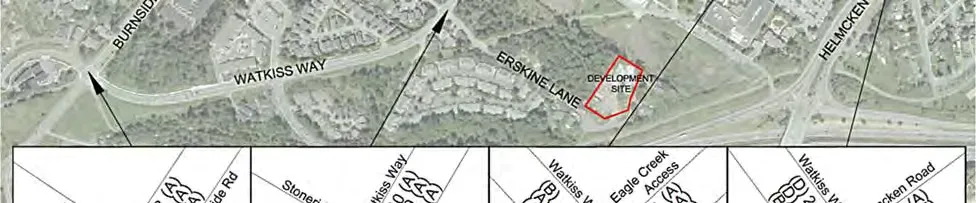
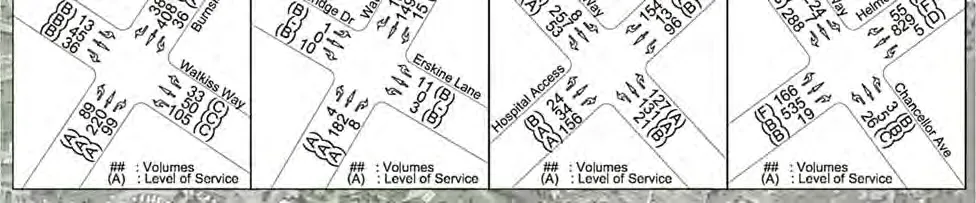
Figure 1: Existing 2018 Intersection Volumes and LOS – AM Peak Hour
At the Burnside Road / Watkiss Way intersection, all movements operate at LOS C or better during the AM peak hour. At the Erskine Road / Watkiss Way intersection and the hospital access roundabout, all movements operate at LOS B or better.
At the Helmcken Road / Watkiss Way intersection, the dual eastbound left turn movement is at a failing LOS F. The westbound through and left turn movements and the southbound combined through / left turn lane operate at LOS D, which is typically considered a borderline operation level. The remaining movements operate at LOS C or better.
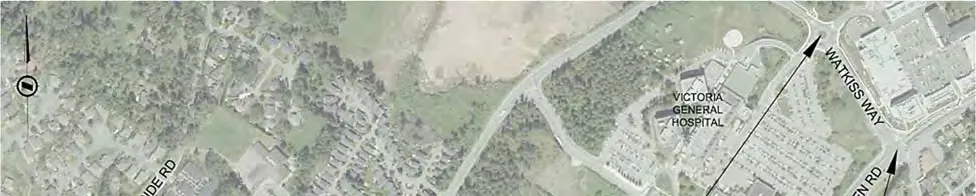
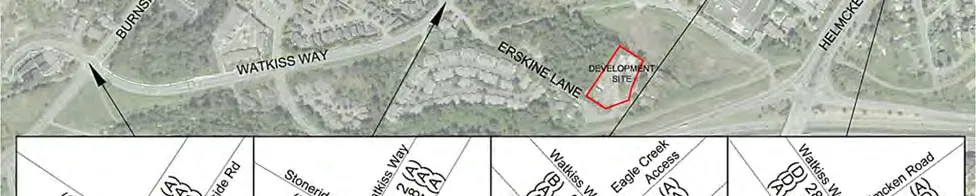
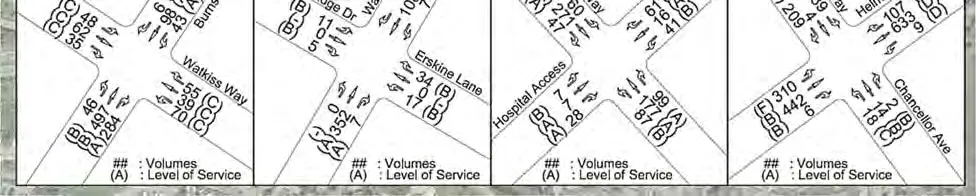
Figure 2: Existing 2018 Intersection Volumes and LOS – PM Peak Hour
At the Burnside Road / Watkiss Way intersection, all movements operate at LOS C or better during the AM peak hour. At the hospital access roundabout and the Erskine Road / Watkiss Way intersection, all movements operate at LOS B or better.
At the Helmcken Road / Watkiss Way intersection, the dual eastbound left turn movement and the westbound through movement are at LOS F. The westbound left turn and the southbound combined through / left turn lane operate at LOS D. The remaining movements operate at LOS C or better. There is significant queuing on the westbound leg of Helmcken from the Watkiss intersection.
3.0 POST DEVELOPMENT CONDITIONS
3.1 TRIP GENERATION & ASSIGNMENT
The 7 Erskine Lane TIA determined that the proposed development is expected to generate 31 trips (5 inbound / 26 outbound) during the AM peak hour and 36 trips (24 inbound / 12 outbound) during the PM peak hour. The TIA assigned the generated trips as follows:
AM Peak Hour
- 65% of exiting site trips are to Watkiss Way East (17 vph)
- 35% of exiting site trips are to Watkiss Way West (9 vph)
- 55% of entering site trips are from Watkiss Way East (3 vph)
- 45% of entering site trips are from Watkiss Way West (2 vph)
PM Peak Hour
- 80% of exiting site trips are to Watkiss Way East (10 vph)
- 20% of exiting site trips are to Watkiss Way West (2 vph)
- 67 of entering site trips are from Watkiss Way East (16 vph)
- 33% of entering site trips are from Watkiss Way West (8 vph)
This addendum expands the trip assignment through the additional intersections. Figure 3 shows the expanded AM peak hour trip assignment and Figure 4 shows the expanded PM peak hour trip assignment.
Figure 3: AM Peak Hour Trip Assignment
Figure 4: PM Peak Hour Trip Assignment
3.2 ANALYSIS RESULTS – POST DEVELOPMENT CONDITIONS
The 2018 post development traffic volumes and levels of service are shown in Figure 5 for the AM peak hour and Figure 6 for the PM peak hour.
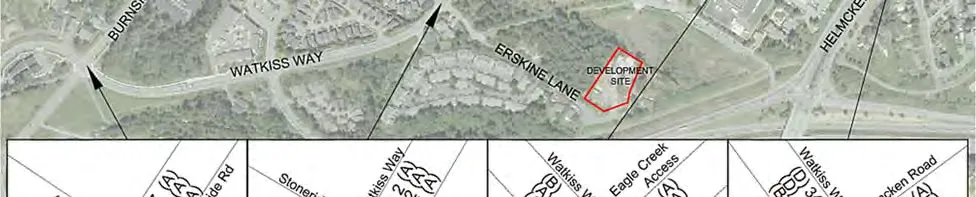
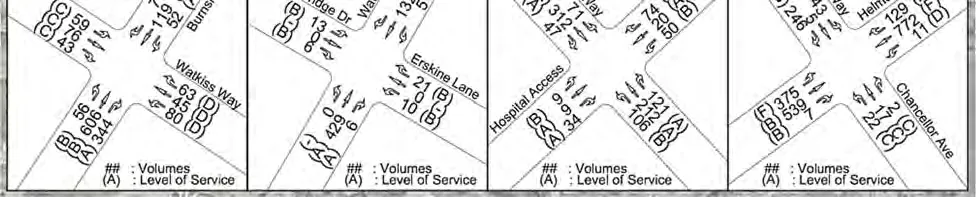
Figure 5: 2018 Post Development Intersection Volumes and LOS – AM Peak Hour
At each of the Watkiss Way intersections during the AM peak hour, the post development levels of service remain unchanged compared to the existing conditions, delays increased by less than 4 seconds and queue lengths increased by less than 2.5m for all intersection movements. See Appendix B (Tables B.1-B.4) for a detailed comparison of the existing and 2018 post development operations of the intersections during the AM peak hour.
Figure 6: 2018 Post Development Intersection Volumes and LOS – PM Peak Hour
At each of the Watkiss Way intersections during the PM peak hour, the post development levels of service remain unchanged compared to the existing conditions, delays increased by less than 2 seconds and queue lengths increased by less than 3m for all intersection movements. See Appendix B (Tables B.5-B.8) for a detailed comparison of the existing and 2018 post development operations of the intersections during the PM peak hour.
4.0 2028 POST DEVELOPMENT CONDITIONS
The long term traffic conditions at the Watkiss Way intersections were determined for the 10-year 2028 horizon. A growth rate of 2% (as calculated in the 7 Erskine Lane TIA) was used to determine the 2028 background traffic volumes.
4.1 ANALYSIS RESULTS – 2028 BACKGROUND CONDITIONS
The 2028 background traffic volumes and levels of service are shown in Figure 7 for the AM peak hour and Figure 8 for the PM peak hour.
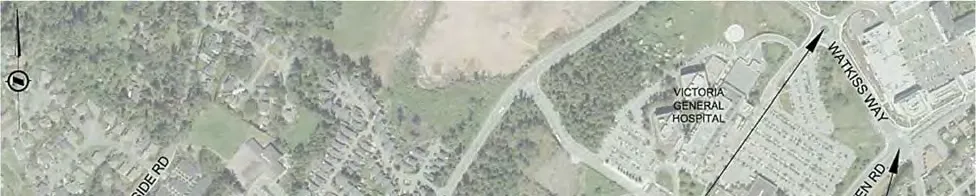
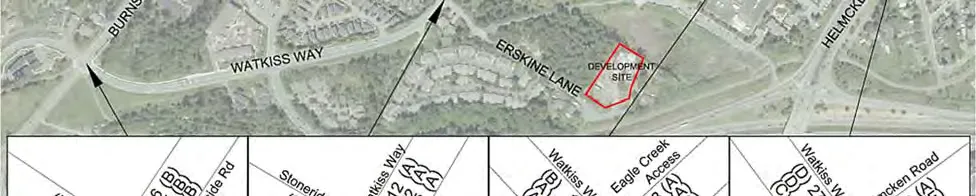
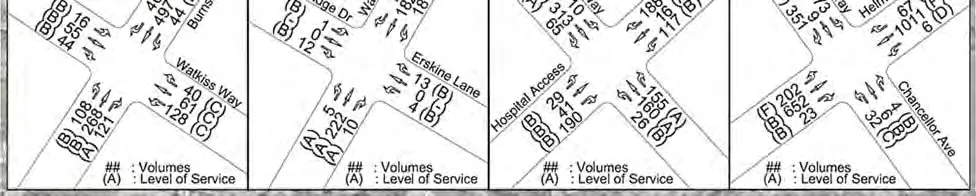
Figure 7: 2028 Background Intersection Volumes and LOS – AM Peak Hour
During the AM peak hour at the Burnside Road / Watkiss Way intersection, the westbound movements on Watkiss Way operate at LOS D while the remaining movements operate at LOS C or better.
At the Erskine Lane / Watkiss Way intersection and the hospital access roundabout, all intersection movements operate at LOS A or B.
At the Helmcken Road / Watkiss Way intersection, the dual eastbound left turn movement and the westbound through movement operate at LOS F. The westbound left turn movement and the southbound combined through / left turn lane operate at LOS D. The remaining movements operate at LOS C or better.
Figure 8: 2028 Background Intersection Volumes and LOS – PM Peak Hour
During the 2028 PM peak hour, the Burnside Road / Watkiss Way intersection operates at LOS C or better for all intersection movements.
At the Erskine Lane / Watkiss Way intersection and the hospital access roundabout, all movements operate at LOS A or B.
At the Helmcken Road / Watkiss Way intersection, the dual eastbound left turn lanes and the westbound through movement operate at LOS F. The westbound left turn movement and the southbound combined through / left turn lane operate at LOS D. The remaining intersection movements operate at LOS C or better.
4.2 ANALYSIS RESULTS – 2028 POST DEVELOPMENT CONDITIONS
The 2028 post development traffic volumes and levels of service are shown in Figure 9 for the AM peak hour and Figure 10 for the PM peak hour.
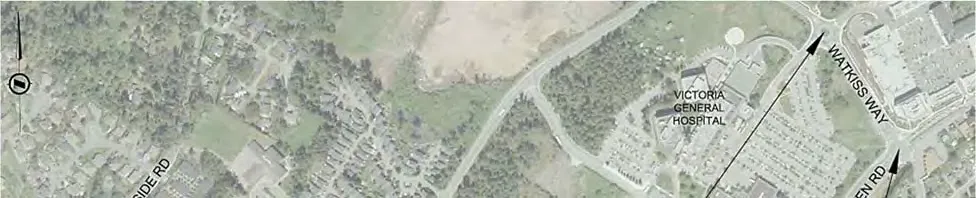
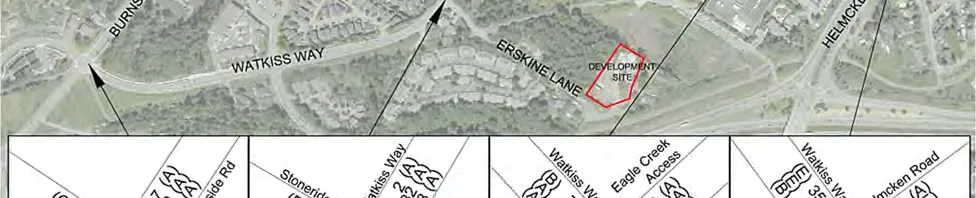
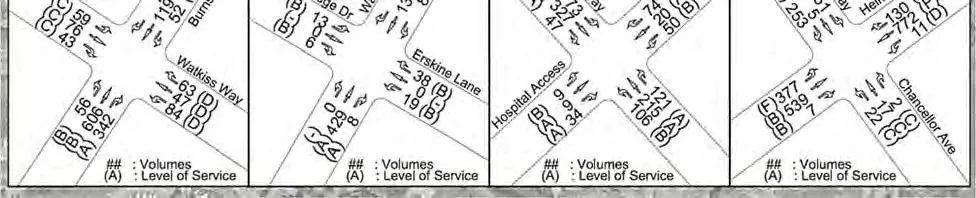
Figure 9: 2028 Post Development Intersection Volumes and LOS – AM Peak Hour
During the AM peak hour at the Burnside Road / Watkiss Way and the Erskine Lane / Watkiss Way intersections and at the hospital access roundabout, the post development LOS is unchanged compared to 2028 background conditions, delay increases are less than 1.5 seconds, and queue lengths increased by less than 2 meters for all movements.
At the Helmcken Road / Watkiss Way intersection, the southbound through / left turn movement dropped from LOS D to LOS E due to a 3 second delay increase. For all other movements, the LOS is unchanged from 2028 background conditions. The delay increased by 3 seconds or less and the queue lengths increased by less than 2 meters for all movements.
See Appendix C (Tables C.1-C.4) for a detailed comparison of the 2028 background and post development operations of the Watkiss Way intersections during the AM peak hour.
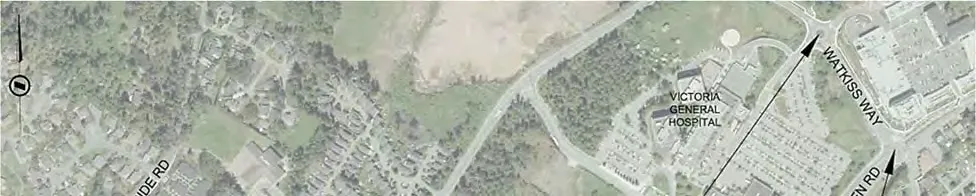
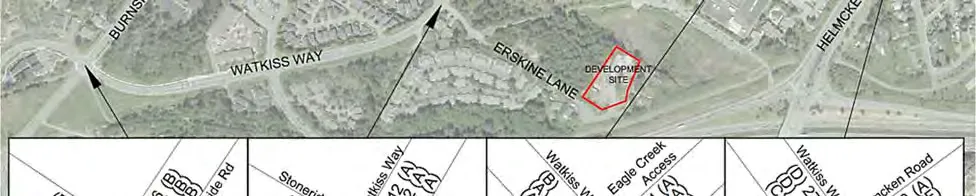
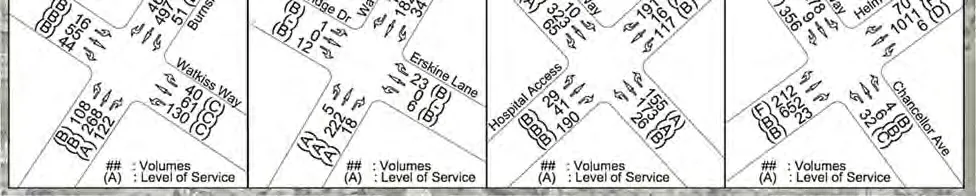
Figure 10: 2028 Post Development Intersection Volumes and LOS – PM Peak Hour
During the PM peak hour at the Burnside Road / Watkiss Way and the Erskine Lane / Watkiss Way intersections and at the hospital access roundabout, the post development LOS is unchanged compared to 2028 background conditions, delay increases by 1 second or less, and queue lengths increased by less than 4 meters for all movements.
At the Helmcken Road / Watkiss Way intersection, the post development LOS is unchanged from 2028 background conditions. The dual eastbound left turn lane delay increased by 20 seconds from 145 to 165 seconds. This increase in delay is a result of the failing level of service of the movement, which can cause a small increase in traffic (10 vph) to result in a large delay increase. Even with the increased delay, the eastbound left turn queue length increased by less than 2.5 meters. The remaining intersection movements had delay increases of less than 4 seconds and queue length increases of less than 5 meters.
See Appendix C (Tables C.5-C.8) for a detailed comparison of the 2028 background and post development operations of the Watkiss Way intersections during the PM peak hour.
5.0 ON-STREET PARKING
The impact on the on-street parking on Erskine Lane due to the proposed development was examined. On-street parking is not permitted along Erskine Lane with the exception of a 100m section of permit-only parking on the north side of the road west of the proposed development site as shown in Figure 11.
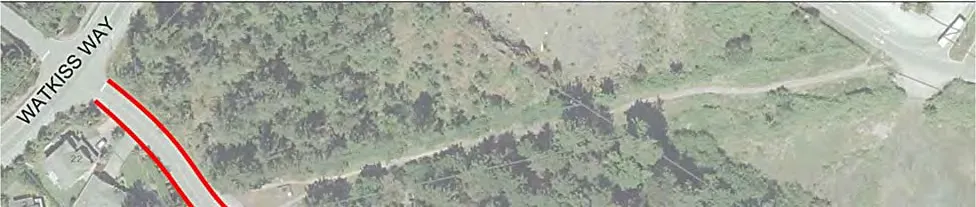
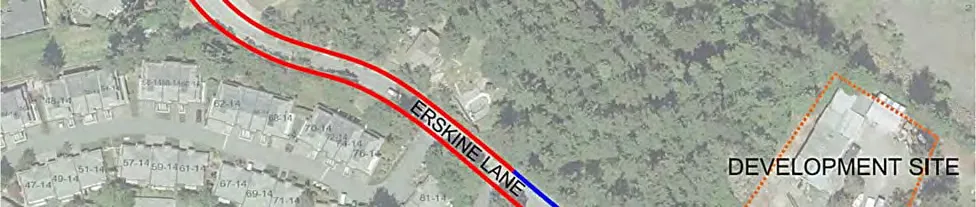
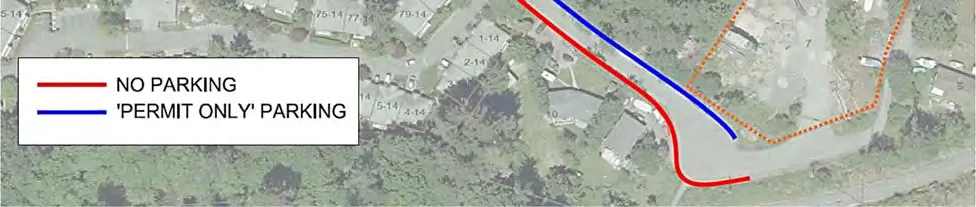
Figure 11: Parking Restrictions on Erskine Lane
The proposed development provides off-street parking that meets the parking requirements of the proposed zoning and therefore spillover onto the street is not expected to occur.
6.0 CONCLUSIONS
Under existing conditions, the Burnside Road / Watkiss Way and Erskine Lane / Watkiss Way intersections as well as the hospital access roundabout operate at LOS C or better during both the AM and PM peak hours. At the Helmcken Road / Watkiss Way intersection, the dual eastbound left turn movements are at LOS F during the AM and PM peak hours and the westbound through movement is at LOS F during the PM peak. The additional traffic generated by the proposed development will have no impact on the studied intersections in either the AM or PM peak hours with less than 5 seconds of additional delay and queue lengths increased by less than 3 meters.
In the long term, under 2028 background conditions the westbound lane of the Burnside Road / Watkiss Way intersection drops from LOS C to LOS D and the Helmcken Road / Watkiss Way westbound through movement drops from LOS D to LOS F during the AM peak. With the addition of the development traffic, the AM and PM levels of service at each intersection are unchanged compared to the 2028 background conditions with the exception of the AM peak hour Helmcken Road / Watkiss Way southbound through / left turn movement, which crosses the threshold between LOS D to LOS E due to a 3 second delay increase. For all intersection movements at each Watkiss Way intersection, queue lengths increased by less than 4 meters and delays increased by less than 4 seconds except for the Helmcken Road / Watkiss Way eastbound left turn lane which had a delay increase of less than 20 seconds during the PM peak hour as a result of the failing level of service that exists under 2028 background conditions.
The proposed development provides adequate off-street parking to meet the zoning parking requirements and therefore no impact on on-street parking is expected due to the development.
APPENDIX A: SYNCHRO BACKGROUND
SYNCHRO MODELLING SOFTWARE DESCRIPTION
The traffic analysis was completed using Synchro and SimTraffic traffic modeling software. Results were measured in delay, level of service (LOS) and 95th percentile queue length. Synchro is based on the Highway Capacity Manual (HCM) methodology. SimTraffic integrates established driver behaviours and characteristics to simulate actual conditions by randomly "seeding" or positioning vehicles travelling throughout the network. The simulation is run five times (five different random seedings of vehicle types, behaviours and arrivals) to obtain statistical significance of the results.
Levels of Service
Traffic operations are typically described in terms of levels of service, which rates the amount of delay per vehicle for each movement and the entire intersection. Levels of service range from LOS A (representing best operations) to LOS E/F (LOS E being poor operations and LOS F being unpredictable/disruptive operations). LOS E/F are generally unacceptable levels of service under normal everyday conditions.
The hierarchy of criteria for grading an intersection or movement not only includes delay times, but also takes into account traffic control type (stop signs or traffic signal). For example, if a vehicle is delayed for 19 seconds at an unsignalized intersection, it is considered to have an average operation, and would therefore be graded as an LOS C. However, at a signalized intersection, a 19 second delay would be considered a good operation and therefore it would be given an LOS B. The table below indicates the range of delay for LOS for signalized and unsignalized intersections.
Table A1: LOS Criteria, by Intersection Traffic Control
| Level of Service | Unsignalized Intersection Average Vehicle Delay (sec/veh) | Signalized Intersection Average Vehicle Delay (sec/veh) |
|---|---|---|
| A | Less than 10 | Less than 10 |
| B | 10 to 15 | 11 to 20 |
| C | 15 to 25 | 20 to 35 |
| D | 25 to 35 | 35 to 55 |
| E | 35 to 50 | 55 to 80 |
| F | More than 50 | More than 80 |
APPENDIX B: 2018 EXISTING AND POST DEVELOPMENT CONDITIONS
TABLE B.1: BURNSIDE ROAD / WATKISS WAY INTERSECTION EXISTING & POST DEVELOPMENT CONDITIONS (AM PEAK HOUR)
| Movement | Existing Conditions LOS | Existing Conditions Delay (s) | Existing Conditions 95th Queue (m) | Post Development Conditions LOS | Post Development Conditions Delay (s) | Post Development Conditions 95th Queue (m) |
|---|---|---|---|---|---|---|
| EB L/T/R | C | 22.9 | 26.2 | C | 22.2 | 26.2 |
| WB L/T/R | C | 28.5 | 33.3 | C | 29.3 | 35.5 |
| NB L/T | B | 10.4 | 69.7 | B | 10.7 | 69.7 |
| NBR | A | 1.8 | 8.1 | A | 1.8 | 8.1 |
| SB L/T/R | A | 6.5 | 16.5 | A | 6.6 | 16.5 |
TABLE B.2: ERSKINE LANE / WATKISS WAY INTERSECTION EXISTING & POST DEVELOPMENT CONDITIONS (AM PEAK HOUR)
| Movement | Existing Conditions LOS | Existing Conditions Delay (s) | Existing Conditions 95th Queue (m) | Post Development Conditions LOS | Post Development Conditions Delay (s) | Post Development Conditions 95th Queue (m) |
|---|---|---|---|---|---|---|
| EB L/T/R | A | 0 | 0 | A | 0 | 0 |
| WB L/T/R | A | 0.3 | 0 | A | 0.5 | 0 |
| NB L/T/R | B | 11.6 | 0.8 | B | 12.1 | 2.2 |
| SB L/T/R | B | 12.0 | 0.8 | B | 12.3 | 0.8 |
TABLE B.3: WATKISS WAY / HOSPITAL ACCESS ROUNDABOUT EXISTING & POST DEVELOPMENT CONDITIONS (AM PEAK HOUR)
| Movement | Existing Conditions LOS | Existing Conditions Delay (s) | Existing Conditions 95th Queue (m) | Post Development Conditions LOS | Post Development Conditions Delay (s) | Post Development Conditions 95th Queue (m) |
|---|---|---|---|---|---|---|
| EBL | B | 12.2 | 15.8 | B | 12.3 | 16.7 |
| EBT | A | 7.2 | 15.8 | A | 7.2 | 16.7 |
| EBR | A | 8.0 | 15.8 | A | 8.0 | 16.7 |
| WBL | B | 11.4 | 8.3 | B | 11.4 | 8.4 |
| WBT | A | 6.3 | 8.3 | A | 6.3 | 8.4 |
| WBR | A | 7.7 | 3.9 | A | 7.7 | 4.0 |
| NBL | B | 13.0 | 2.5 | B | 13.1 | 2.5 |
| NBT | A | 7.9 | 2.5 | A | 8.0 | 2.5 |
| NBR | A | 8.7 | 2.5 | A | 8.9 | 2.5 |
| SBL | B | 12.8 | 7.0 | B | 12.8 | 7.0 |
| SBT | A | 7.7 | 7.0 | A | 7.7 | 7.0 |
| SBR | A | 8.5 | 7.0 | A | 6.5 | 7.0 |
TABLE B.4: HELMCKEN ROAD / WATKISS WAY INTERSECTION EXISTING & POST DEVELOPMENT CONDITIONS (AM PEAK HOUR)
| Movement | Existing Conditions LOS | Existing Conditions Delay (s) | Existing Conditions 95th Queue (m) | Post Development Conditions LOS | Post Development Conditions Delay (s) | Post Development Conditions 95th Queue (m) |
|---|---|---|---|---|---|---|
| EBL | F | 271.2 | 67.8 | F | 274.8 | 68.4 |
| EB T/R | B | 11.4 | 36.2 | B | 11.4 | 36.2 |
| WBL | D | 42.9 | 6.1 | D | 42.9 | 6.1 |
| WBT | D | 37.0 | 143.5 | D | 37.0 | 143.5 |
| WBR | A | 3.9 | 6.7 | A | 3.9 | 6.9 |
| NBL | C | 23.3 | 6.4 | C | 23.4 | 6.4 |
| NB T/R | B | 17.8 | 5.4 | B | 17.8 | 5.4 |
| SB T/L | D | 35.8 | 34.4 | D | 36.8 | 35.2 |
| SBR | A | 6.9 | 12.7 | A | 7.4 | 13.9 |
TABLE B.5: BURNSIDE ROAD / WATKISS WAY INTERSECTION EXISTING & POST DEVELOPMENT CONDITIONS (PM PEAK HOUR)
| Movement | Existing Conditions LOS | Existing Conditions Delay (s) | Existing Conditions 95th Queue (m) | Post Development Conditions LOS | Post Development Conditions Delay (s) | Post Development Conditions 95th Queue (m) |
|---|---|---|---|---|---|---|
| EB L/T/R | B | 11.8 | 15.2 | B | 11.8 | 15.2 |
| WB L/T/R | C | 27.1 | 24.5 | C | 27.3 | 25.0 |
| NB L/T | A | 8.5 | 33.7 | A | 8.7 | 33.8 |
| NBR | A | 1.9 | 4.7 | A | 1.9 | 4.7 |
| SB L/T/R | A | 9.6 | 58.6 | B | 10.1 | 61.0 |
TABLE B.6: ERSKINE LANE / WATKISS WAY INTERSECTION EXISTING & POST DEVELOPMENT CONDITIONS (PM PEAK HOUR)
| Movement | Existing Conditions LOS | Existing Conditions Delay (s) | Existing Conditions 95th Queue (m) | Post Development Conditions LOS | Post Development Conditions Delay (s) | Post Development Conditions 95th Queue (m) |
|---|---|---|---|---|---|---|
| EB L/T/R | A | 0.2 | 0 | A | 0.2 | 0 |
| WB L/T/R | A | 0.7 | 0 | A | 1.3 | 0.8 |
| NB L/T/R | B | 10.0 | 0.8 | B | 10.1 | 0.8 |
| SB L/T/R | B | 11.8 | 0.8 | B | 12.5 | 0.8 |
TABLE B.7: WATKISS WAY / HOSPITAL ACCESS ROUNDABOUT EXISTING & POST DEVELOPMENT CONDITIONS (PM PEAK HOUR)
| Movement | Existing Conditions LOS | Existing Conditions Delay (s) | Existing Conditions 95th Queue (m) | Post Development Conditions LOS | Post Development Conditions Delay (s) | Post Development Conditions 95th Queue (m) |
|---|---|---|---|---|---|---|
| EBL | B | 12.2 | 13.8 | B | 12.2 | 14.4 |
| EBT | A | 7.1 | 13.8 | A | 7.2 | 14.4 |
| EBR | A | 7.9 | 13.8 | A | 8.0 | 14.4 |
| WBL | B | 11.5 | 6.0 | B | 11.5 | 6.6 |
| WBT | A | 6.5 | 6.0 | A | 6.5 | 6.6 |
| WBR | A | 7.8 | 5.7 | A | 7.8 | 5.7 |
| NBL | B | 13.9 | 18.0 | B | 14.0 | 18.2 |
| NBT | A | 8.9 | 18.0 | A | 9.0 | 18.2 |
| NBR | A | 9.7 | 18.0 | A | 9.8 | 18.2 |
| SBL | B | 12.6 | 14.1 | B | 12.7 | 14.6 |
| SBT | A | 7.5 | 14.1 | A | 7.6 | 14.6 |
| SBR | A | 8.3 | 14.1 | A | 8.4 | 14.6 |
TABLE B.8: HELMCKEN ROAD / WATKISS WAY INTERSECTION EXISTING & POST DEVELOPMENT CONDITIONS (PM PEAK HOUR)
| Movement | Existing Conditions LOS | Existing Conditions Delay (s) | Existing Conditions 95th Queue (m) | Post Development Conditions LOS | Post Development Conditions Delay (s) | Post Development Conditions 95th Queue (m) |
|---|---|---|---|---|---|---|
| EBL | F | 89.1 | 34.2 | F | 88.1 | 35.8 |
| EB T/R | B | 11.3 | 45.1 | B | 11.1 | 44.8 |
| WBL | D | 42.2 | 3.9 | D | 42.2 | 3.9 |
| WBT | F | 81.0 | 240.7 | F | 81.0 | 240.7 |
| WBR | A | 0.3 | 0.0 | A | 0.6 | 0.3 |
| NBL | C | 23.6 | 9.5 | C | 24. | 9.6 |
| NB T/R | B | 16.2 | 2.4 | B | 16.4 | 2.4 |
| SB T/L | D | 37.1 | 67.9 | D | 38.7 | 70.6 |
| SBR | B | 17.8 | 41.8 | B | 18.4 | 43.0 |
APPENDIX C: 2028 BACKGROUND AND POST DEVELOPMENT CONDITIONS
TABLE C.1: BURNSIDE ROAD / WATKISS WAY INTERSECTION 2028 BACKGROUND & POST DEVELOPMENT CONDITIONS (AM PEAK HOUR)
| Movement | Existing Conditions LOS | Existing Conditions Delay (s) | Existing Conditions 95th Queue (m) | Post Development Conditions LOS | Post Development Conditions Delay (s) | Post Development Conditions 95th Queue (m) |
|---|---|---|---|---|---|---|
| EB L/T/R | C | 24.5 | 32.3 | C | 23.9 | 32.4 |
| WB L/T/R | D | 34.5 | 43.9 | D | 35.9 | 50.5 |
| NB L/T | B | 16.4 | 120.2 | B | 16.8 | 120.2 |
| NBR | A | 2.1 | 9.0 | A | 2.1 | 9.0 |
| SB L/T/R | A | 8.4 | 21.4 | A | 8.4 | 21.5 |
TABLE C.2: ERSKINE LANE / WATKISS WAY INTERSECTION 2028 BACKGROUND & POST DEVELOPMENT CONDITIONS (AM PEAK HOUR)
| Movement | Existing Conditions LOS | Existing Conditions Delay (s) | Existing Conditions 95th Queue (m) | Post Development Conditions LOS | Post Development Conditions Delay (s) | Post Development Conditions 95th Queue (m) |
|---|---|---|---|---|---|---|
| EB L/T/R | A | 0 | 0 | A | 0 | 0 |
| WB L/T/R | A | 0.3 | 0 | A | 0.5 | 0 |
| NB L/T/R | B | 12.8 | 1.5 | B | 13.4 | 3.0 |
| SB L/T/R | B | 13.3 | .8 | B | 13.8 | 0.8 |
TABLE C.3: WATKISS WAY / HOSPITAL ACCESS ROUNDABOUT 2028 BACKGROUND & POST DEVELOPMENT CONDITIONS (AM PEAK HOUR)
| Movement | Existing Conditions LOS | Existing Conditions Delay (s) | Existing Conditions 95th Queue (m) | Post Development Conditions LOS | Post Development Conditions Delay (s) | Post Development Conditions 95th Queue (m) |
|---|---|---|---|---|---|---|
| EBL | B | 12.5 | 22.8 | B | 12.5 | 24.1 |
| EBT | A | 7.4 | 22.8 | A | 7.4 | 24.1 |
| EBR | A | 8.2 | 22.8 | A | 8.3 | 24.1 |
| WBL | B | 11.5 | 10.8 | B | 11.5 | 11.0 |
| WBT | A | 6.4 | 10.8 | A | 6.4 | 11.0 |
| WBR | A | 7.8 | 5.6 | A | 7.8 | 5.6 |
| NBL | B | 13.6 | 3.1 | B | 13.8 | 3.2 |
| NBT | A | 8.6 | 3.1 | A | 8.7 | 3.2 |
| NBR | A | 9.4 | 3.1 | A | 9.5 | 3.2 |
| SBL | B | 13.1 | 7.3 | B | 13.2 | 7.3 |
| SBT | A | 8.1 | 7.3 | A | 8.1 | 7.3 |
| SBR | A | 8.9 | 7.3 | A | 8.9 | 7.3 |
TABLE C.4: HELMCKEN ROAD / WATKISS WAY INTERSECTION 2028 BACKGROUND & POST DEVELOPMENT CONDITIONS (AM PEAK HOUR)
| Movement | Existing Conditions LOS | Existing Conditions Delay (s) | Existing Conditions 95th Queue (m) | Post Development Conditions LOS | Post Development Conditions Delay (s) | Post Development Conditions 95th Queue (m) |
|---|---|---|---|---|---|---|
| EBL | F | 123.8 | 69.5 | F | 125.6 | 69.9 |
| EB T/R | B | 11.6 | 44.8 | B | 11.6 | 44.8 |
| WBL | D | 44.0 | 7.0 | D | 44.0 | 7.0 |
| WBT | F | 99.9 | 231.2 | F | 99.9 | 231.2 |
| WBR | A | 5.9 | 11.0 | A | 6.0 | 11.1 |
| NBL | C | 26.0 | 7.5 | C | 26.3 | 7.6 |
| NB T/R | C | 21.8 | 5.9 | C | 21.8 | 5.9 |
| SB T/L | D | 53.5 | 42.0 | E | 56.3 | 43.1 |
| SBR | B | 14.3 | 29.6 | B | 14.9 | 31.3 |
TABLE C.5: BURNSIDE ROAD / WATKISS WAY INTERSECTION 2028 BACKGROUND & POST DEVELOPMENT CONDITIONS (PM PEAK HOUR)
| Movement | Existing Conditions LOS | Existing Conditions Delay (s) | Existing Conditions 95th Queue (m) | Post Development Conditions LOS | Post Development Conditions Delay (s) | Post Development Conditions 95th Queue (m) |
|---|---|---|---|---|---|---|
| EB L/T/R | B | 11.7 | 17.8 | B | 11.7 | 17.8 |
| WB L/T/R | C | 31.4 | 30.5 | C | 31.7 | 30.8 |
| NB L/T | B | 11.5 | 44.4 | B | 11.6 | 44.6 |
| NBR | A | 1.9 | 5.2 | A | 1.9 | 5.2 |
| SB L/T/R | B | 14.2 | 81.7 | B | 15.2 | 85.5 |
TABLE C.6: ERSKINE LANE / WATKISS WAY INTERSECTION 2028 BACKGROUND & POST DEVELOPMENT CONDITIONS (PM PEAK HOUR)
| Movement | Existing Conditions LOS | Existing Conditions Delay (s) | Existing Conditions 95th Queue (m) | Post Development Conditions LOS | Post Development Conditions Delay (s) | Post Development Conditions 95th Queue (m) |
|---|---|---|---|---|---|---|
| EB L/T/R | A | 0.2 | 0 | A | 0.2 | 0 |
| WB L/T/R | A | 0.7 | 0 | A | 1.2 | 0.8 |
| NB L/T/R | B | 10.5 | 0.8 | B | 10.7 | 0.8 |
| SB L/T/R | B | 13.0 | 0.8 | B | 13.8 | 0.8 |
TABLE C.7: WATKISS WAY / HOSPITAL ACCESS ROUNDABOUT 2028 BACKGROUND & POST DEVELOPMENT CONDITIONS (PM PEAK HOUR)
| Movement | Existing Conditions LOS | Existing Conditions Delay (s) | Existing Conditions 95th Queue (m) | Post Development Conditions LOS | Post Development Conditions Delay (s) | Post Development Conditions 95th Queue (m) |
|---|---|---|---|---|---|---|
| EBL | B | 12.6 | 19.2 | B | 12.6 | 19.9 |
| EBT | A | 7.6 | 19.2 | A | 7.6 | 19.9 |
| EBR | A | 8.4 | 19.2 | A | 8.4 | 19.9 |
| WBL | B | 11.7 | 8.0 | B | 11.7 | 8.6 |
| WBT | A | 6.6 | 8.0 | A | 6.6 | 8.6 |
| WBR | A | 7.9 | 7.5 | A | 7.9 | 7.6 |
| NBL | B | 15.9 | 29.6 | B | 16.1 | 30.4 |
| NBT | B | 10.9 | 29.6 | B | 11.1 | 30.4 |
| NBR | B | 11.7 | 29.6 | B | 11.9 | 30.4 |
| SBL | B | 13.1 | 19.6 | B | 13.3 | 20.3 |
| SBT | A | 8.1 | 19.6 | A | 8.2 | 20.3 |
| SBR | A | 8.9 | 19.6 | A | 9.0 | 20.3 |
TABLE C.8: HELMCKEN ROAD / WATKISS WAY INTERSECTION 2028 BACKGROUND & POST DEVELOPMENT CONDITIONS (PM PEAK HOUR)
| Movement | Existing Conditions LOS | Existing Conditions Delay (s) | Existing Conditions 95th Queue (m) | Post Development Conditions LOS | Post Development Conditions Delay (s) | Post Development Conditions 95th Queue (m) |
|---|---|---|---|---|---|---|
| EBL | F | 146.9 | 44.0 | F | 164.5 | 46.2 |
| EB T/R | B | 12.0 | 56.6 | B | 12.0 | 56.6 |
| WBL | D | 42.7 | 4.6 | D | 42.7 | 4.6 |
| WBT | F | 177.8 | 317.3 | F | 177.8 | 317.3 |
| WBR | A | 1.1 | 1.6 | A | 1.2 | 2.1 |
| NBL | C | 25.4 | 11.6 | C | 25.7 | 11.7 |
| NB T/R | B | 15.4 | 2.5 | B | 15.4 | 2.5 |
| SB T/L | D | 48.9 | 97.3 | D | 52.2 | 101.6 |
| SBR | C | 26.8 | 63.7 | C | 27.5 | 65.3 |
Document Images
(1)