Public Safety Report for January - February 2020
A report detailing municipal permit summaries, bylaw enforcement activities, and fire rescue statistics for the months of January and February 2020.
January Permit Summary
| # of permits | Construction value | |
|---|---|---|
| Residential permits new construction and renovations | 2 | $40,000 |
| Demolition permits | 0 | 0 |
| Commercial/Multi-family permits new construction | 2 | $6,866,912 |
| Commercial permits renovations or tenant improvements | 2 | $5,000 |
February Permit Summary
| # of permits | Construction value | |
|---|---|---|
| Residential permits new construction and renovations | 1 | $5,000 |
| Demolition permits | 0 | 0 |
| Commercial /Multi-family permits new construction | 1 | $180,000 |
| Commercial permits renovations or tenant improvements | 1 | $125,000 |
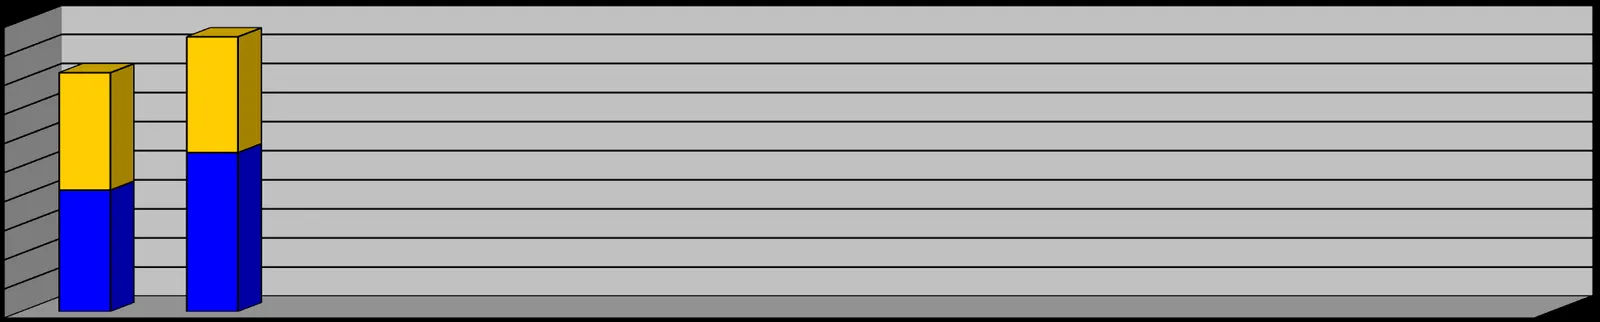
Permit Revenue Comparison Chart
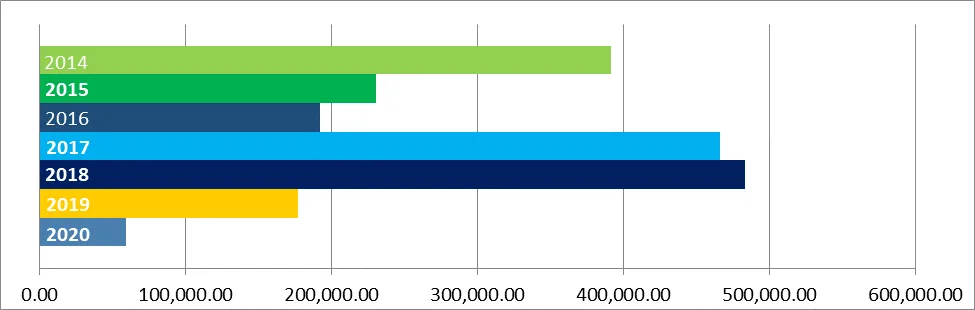
Gary Faykes, Building Inspector
Bylaw Division:
In January during the snowfall Bylaw received many complaints and inquiries regarding keeping one’s sidewalk clear, as a result, we educated residents on the expectations under the bylaw.
January also brought the conclusion of a file that started in 2018 regarding a boat and dock in the Portage Inlet. The dock has been removed from the inlet and has been dismantled and disposed of. Bylaw also assisted by providing recommendations to the facilitators for the removal of the remaining vessel currently submerged in Saanich’s jurisdiction. Recent feedback received indicates the submerged vessel is earmarked for removal soon.
January/February Activity
| Activity | Number of Warnings (Jan) | Number of Warnings (Feb) | Number of Tickets Issued (Jan) | Number of Tickets Issued (Feb) | Tickets Paid (Jan) | Tickets Paid (Feb) | Total |
|---|---|---|---|---|---|---|---|
| Admin | 1 | 1 | 2 | ||||
| Animal Control | 2 | 1 | 3 | ||||
| Assist Other Agencies/Dept | 5 | 2 | 7 | ||||
| Building | |||||||
| Burning | |||||||
| Business License - Issued | 6 | 2 | 8 | ||||
| Business License - Inspected | |||||||
| Dumping | |||||||
| Fireworks | |||||||
| Graffiti | 1 | 1 | |||||
| Illegal Signs | 2 | 4 | 6 | ||||
| Noise | 1 | 3 | 1 | 5 | |||
| Parking Tickets Issued | 16 | 18 | 34 | ||||
| Parks & Public | 1 | 3 | 4 | ||||
| Referred to Other Agencies | |||||||
| Referred to Other Dept | |||||||
| Secondary Suite | |||||||
| Soil | |||||||
| Streets and Traffic | 25 | 12 | 1 | 1 | 38 | ||
| Tree Prevention | 5 | 1 | 5 | ||||
| Unsightly Premise | 2 | 2 | 4 | ||||
| Vacation Rental | |||||||
| Zoning | 5 | 1 | 5 | ||||
| Freedom of Information Requests | 1 | 1 | |||||
| Totals | 66 | 54 | 1 | 1 | 3 | 123 |
Mark Groulx, Bylaw Enforcement Officer
VIEW ROYAL FIRE RESCUE MONTHLY STATISTICS 2020
FIRE IMPACT
| JAN | FEB | MAR | APR | MAY | JUN | JUL | AUG | SEP | OCT | NOV | DEC | YTD | |
|---|---|---|---|---|---|---|---|---|---|---|---|---|---|
| FIRE DEATHS | 0 | 0 | 0 | ||||||||||
| FIRE INJURIES | 0 | 0 | 0 | ||||||||||
| VALUE OF LOSS ($) | 0 | 0 | 0 | ||||||||||
| VALUE SAVED ($) | 0 | 0 | 0 | ||||||||||
| FIRES INVESTIGATED | 0 | 0 | 0 | ||||||||||
| ARSON FIRES | 0 | 0 | 0 |
FIRE PREVENTION
| JAN | FEB | YTD | |
|---|---|---|---|
| BUILDING INSPECTIONS / REINSPECTIONS | 26 | 29 | 55 |
| FIRE PRE-PLANS | 0 | ||
| JUVENILE FIRESETTER INTERVENTIONS | 0 | 0 | 0 |
| BUILDING / FIRE SAFETY PLANS REVIEWED | 0 | 0 | 0 |
| PERMITS ISSUED | 0 | 0 | 0 |
| PUBLIC EDUCATION TOURS / LECTURES | 0 | 2 | 2 |
| CAR SEAT EDUCATOR | 0 | 3 | 3 |
TRAINING
| JAN | FEB | YTD | |
|---|---|---|---|
| DRILLS | 11 | 12 | 23 |
| COURSES / SEMINARS ATTENDED | 3 | 3 | 6 |
| TOTAL ATTENDANCE | 164 | 178 | 342 |
| TOTAL PERSONNEL HOURS FOR DRILLS | 418 | 547 | 965 |
VOLUNTEER IMPACT
| JAN | FEB | YTD | |
|---|---|---|---|
| DAY SHIFT 08:30 TO 16:29 | 39 | 24 | 63 |
| EVENING SHIFT 16:30 TO 20:59 | 13 | 15 | 28 |
| NIGHT SHIFT 21:00 TO 05:59 | 19 | 14 | 33 |
| MORNING SHIFT 06:00 TO 08:29 | 7 | 3 | 10 |
| NIGHT SHIFT VOLUNTEER HRS | 738 | 540 | 1278 |
| TOTAL PERSONNEL HOURS FOR CALL OUTS | 404 | 398 | 802 |
TOTAL PERSONNEL HOURS 2020
VIEW ROYAL FIRE RESCUE MONTHLY STATISTICS 2020
CALLS ATTENDED
| JAN | FEB | MAR | APR | MAY | JUN | JUL | AUG | SEP | OCT | NOV | DEC | YTD | |
|---|---|---|---|---|---|---|---|---|---|---|---|---|---|
| STRUCTURE FIRES / FIRES IN BUILDINGS | 3 | 6 | 9 | ||||||||||
| MOTOR VEHICLE FIRES | 1 | 0 | 1 | ||||||||||
| MVA'S / JAWS / RESCUES | 10 | 8 | 18 | ||||||||||
| BUSH / GRASS / BEACH FIRES | 0 | 0 | 0 | ||||||||||
| GARBAGE / DUMPSTER / MISC FIRES | 2 | 0 | 2 | ||||||||||
| HYDRO ELECTRICAL FIRES / CALLS | 0 | 0 | 0 | ||||||||||
| MEDICAL AID CALLS | 36 | 29 | 65 | ||||||||||
| RESCUE / BOAT CALLS | 1 | 0 | 1 | ||||||||||
| DANGEROUS GOODS / SPILLS / LEAKS | 0 | 0 | 0 | ||||||||||
| ALARM BELLS | 16 | 4 | 20 | ||||||||||
| BURNING & BYLAW COMPLAINTS | 0 | 0 | 0 | ||||||||||
| NATURAL GAS / PROPANE LEAKS | 0 | 2 | 2 | ||||||||||
| SMOKE SMELL & SIGHTINGS | 0 | 0 | 0 | ||||||||||
| MUTUAL AID / AUTOMATIC AID | 4 | 5 | 9 | ||||||||||
| ASSIST PUBLIC/ STANDBY/OTHER | 9 | 8 | 17 | ||||||||||
| TOTAL CALLS | 78 | 57 | 0 | 0 | 0 | 0 | 0 | 0 | 0 | 0 | 0 | 0 | 135 |
| 2019 (with comparative YTD) | 68 | 62 | 70 | 79 | 69 | 75 | 66 | 55 | 79 | 73 | 65 | 82 | 843 |
| 2018 (with comparative YTD) | 74 | 90 | 70 | 95 | 76 | 56 | 66 | 71 | 68 | 64 | 71 | 72 | 873 |
| 2017 (with comparative YTD) | 106 | 69 | 78 | 91 | 81 | 94 | 75 | 83 | 79 | 75 | 82 | 94 | 1007 |
| 2016 (with comparative YTD) | 83 | 69 | 69 | 89 | 69 | 82 | 92 | 75 | 79 | 88 | 70 | 100 | 965 |
| 2015 (with comparative YTD) | 73 | 60 | 61 | 61 | 67 | 77 | 84 | 83 | 80 | 86 | 83 | 72 | 887 |
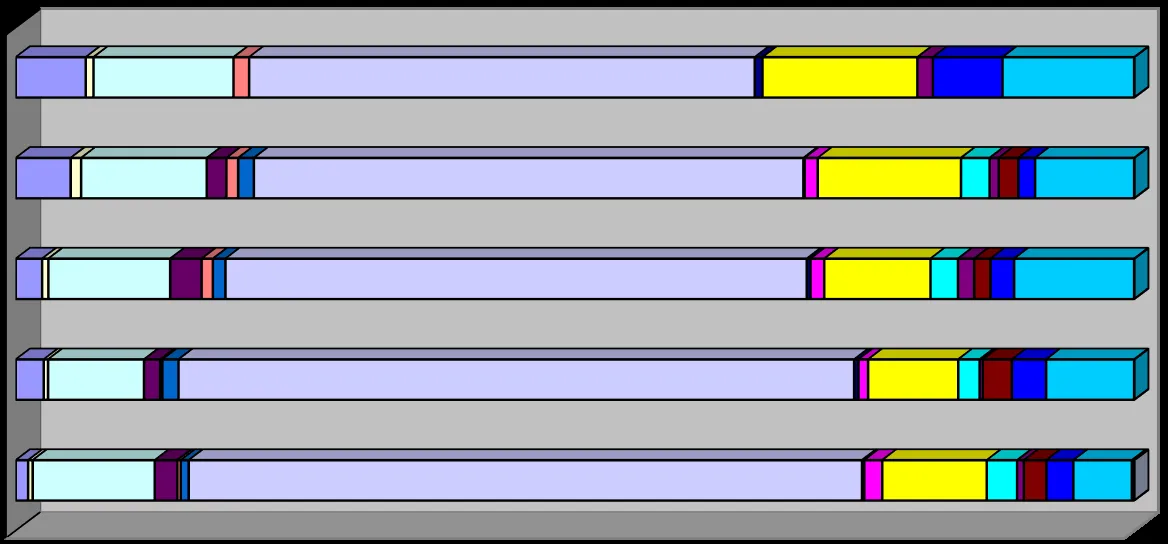
FIVE YEAR MONTHLY COMPARISON

VIEW ROYAL FIRE RESCUE MONTHLY STATISTICS 2020
CALLS ATTENDED 2010 - 2020
| CALLS ATTENDED | 2010 | 2011 | 2012 | 2013 | 2014 | 2015 | 2016 | 2017 | 2018 | 2019 | 2020 |
|---|---|---|---|---|---|---|---|---|---|---|---|
| STRUCTURE FIRES / FIRES IN BUILDINGS | 18 | 13 | 18 | 18 | 21 | 25 | 11 | 26 | 21 | 42 | 9 |
| MOTOR VEHICLE FIRES | 8 | 5 | 5 | 4 | 4 | 7 | 4 | 4 | 5 | 8 | 1 |
| MVA'S / JAWS / RESCUES | 95 | 98 | 79 | 91 | 102 | 107 | 108 | 89 | 97 | 96 | 18 |
| BUSH / GRASS / BEACH FIRES | 15 | 55 | 37 | 11 | 17 | 22 | 20 | 15 | 25 | 15 | 0 |
| GARBAGE / DUMPSTER / MISC FIRES | 8 | 18 | 3 | 4 | 5 | 3 | 3 | 2 | 9 | 9 | 2 |
| HYDRO-ELECTRICAL FIRES/CALLS | 6 | 4 | 6 | 6 | 9 | 7 | 7 | 15 | 10 | 12 | 0 |
| MEDICAL AID CALLS | 261 | 401 | 421 | 420 | 432 | 531 | 596 | 627 | 463 | 420 | 65 |
| RESCUE / BOAT CALLS | 5 | 6 | 2 | 6 | 3 | 4 | 2 | 4 | 3 | 1 | 1 |
| DANGEROUS GOODS / SPILLS / LEAKS | 9 | 9 | 13 | 10 | 11 | 14 | 16 | 9 | 11 | 10 | 0 |
| ALARM BELLS | 76 | 71 | 77 | 81 | 77 | 77 | 93 | 84 | 85 | 110 | 20 |
| BURNING & BYLAW COMPLAINTS | 30 | 33 | 13 | 19 | 16 | 15 | 27 | 20 | 22 | 22 | 0 |
| NATURAL GAS / PROPANE LEAKS | 12 | 8 | 1 | 7 | 3 | 8 | 6 | 3 | 13 | 7 | 2 |
| SMOKE SMELL & SIGHTINGS | 24 | 25 | 13 | 18 | 18 | 21 | 20 | 27 | 13 | 15 | 0 |
| MUTUAL AID / AUTOMATIC AID | 21 | 17 | 29 | 32 | 20 | 32 | 24 | 32 | 19 | 13 | 9 |
| ASSIST PUBLIC/ OTHER | 29 | 44 | 35 | 49 | 41 | 46 | 52 | 82 | 96 | 76 | 17 |
| TOTAL CALLS | 596 | 790 | 723 | 744 | 759 | 887 | 965 | 1007 | 873 | 843 | 135 |
NOTE: Mutual/Auto Aid calls not included in total calls starting in 2009
ANNUAL COMPARISON 2016-2020
Document Images
(5)