Attachment 9: Traffic Impact Study - December 2017
An extensive study analyzing the traffic volumes, trip generation, and intersection operations resulting from the proposed BC Transit facility.
HANDYDART OPERATIONS AND MAINTENANCE FACILITY TRAFFIC IMPACT STUDY
BC TRANSIT
FINAL REPORT CONFIDENTIAL
PROJECT NO.: 169-00385-20 DATE: DECEMBER 2017
WSP SUITE 700 1045 HOWE STREET, V6Z-2A9 VANCOUVER, BC, CANADA
T +1 604 685-9381 F +1 604 683-8655 WSP.COMWSP.COM
SIGNATURES
PREPARED BY
Amy Thai, EIT Transportation Planner
REVIEWED BY
Mark Merlo, P.Eng., PTOE Manager, Transportation Planning BC Dec 22, 2017
TABLE OF CONTENTS
1 INTRODUCTION 1 1.1 Proposed Development 1 1.2 Existing Conditions 3 2 TRIP GENERATION 4 2.1 Trip Generation 4 2.2 Trip Distribution and Assignment 4 3 TRAFFIC INFORMATION 6 3.1 Existing Volumes 6 3.2 Background Forecast Volumes 6 3.3 Total Forecast Volumes 6 4 TRAFFIC OPERATIONS 10 5 ROAD NETWORK IMPACTS 13 6 PARKING 17 6.1 Parking 17 7 RECOMMENDATIONS 18
TABLES
TABLE 1 | NEW TRIPS 4 TABLE 2 | TRIP DISTRIBUTION AND ASSIGNMENT 4 TABLE 3 | MORNING PEAK HOUR LOS RESULTS FOR EXISTING, BACKGROUND, AND TOTAL FORECAST SCENARIOS 11 TABLE 4 | AFTERNOON PEAK HOUR LOS RESULTS FOR EXISTING, BACKGROUND, AND TOTAL FORECAST SCENARIOS 12 TABLE 5 | LOS RESULTS FOR SIGNALIZED INTERSECTION FOR EXISTING, BACKGROUND, AND TOTAL FORECAST VOLUMES 13 TABLE 6 | LOS RESULTS FOR MODIFIED INTERSECTION FOR THE TOTAL FORECAST VOLUMES 14
FIGURES
FIGURE 1 | SITE PLAN AND STUDY INTERSECTIONS 2 FIGURE 2 | EXISTING BUS ROUTES 3 FIGURE 3 | NEW TRIPS 5 FIGURE 4 | EXISTING MORNING AND AFTERNOON PEAK HOUR VOLUMES 7 FIGURE 5 | 5-YEAR (2022) BACKGROUND FORECAST MORNING AND AFTERNOON PEAK HOUR VOLUMES 8 FIGURE 6 | 5-YEAR (2022) TOTAL FORECAST MORNING AND AFTERNOON PEAK HOUR VOLUMES 9 FIGURE 7 | INTERSECTION SIGHT DISTANCE – LEFT-TURN FROM STOP 15 FIGURE 8 | INTERSECTION SIGHT DISTANCE – RIGHT-TURN FROM STOP 15 FIGURE 9 | ACCESS POINT SIGHTLINE ASSESSMENT 16
APPENDICES
APPENDIX A HIGHWAY 1 WESTBOUND OFF-RAMP VOLUMES APPENDIX B TAC SIGNAL WARRANT ANALYSIS APPENDIX C BC MOIT LEFT-TURN WARRANT ANALYSIS APPENDIX D SIGHTLINE ASSESSMENT FIELD REVIEW APPENDIX E SITE STATISTICS APPENDIX F SYNCHRO SUMMARY
1 INTRODUCTION
WSP was commissioned by BC Transit (Client) to complete a Traffic Impact Study (TIS) for the HandyDART Operations and Maintenance (O&M) Facility. The purpose of this study is to establish the additional traffic generated by the proposed development, determine impacts of the proposed development on the adjacent transportation network, and discuss mitigation measures, if required.
1.1 PROPOSED DEVELOPMENT
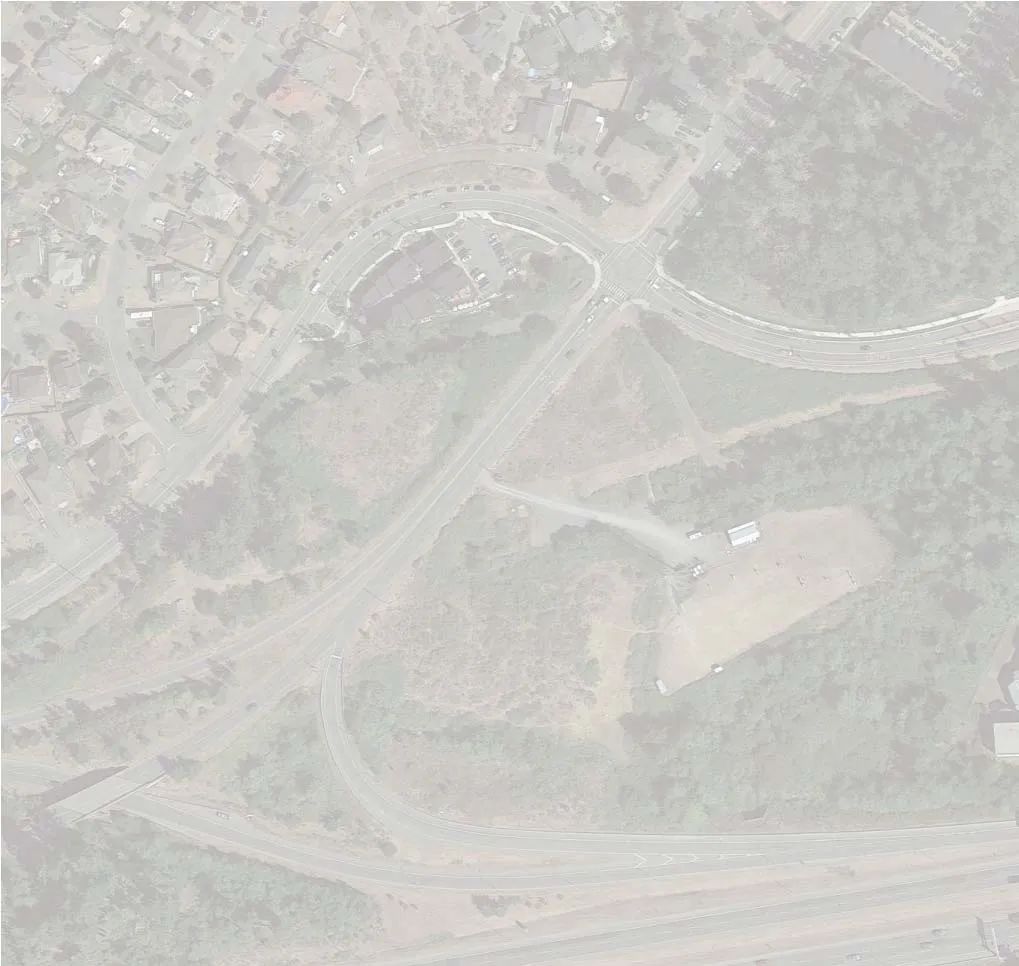
Located on the existing Victoria Bowmen Outdoor Range (Range) site, the development is proposed to share the existing access road to the Range. The access point is proposed to be relocated slightly to the north of its current location, approximately 90 m south of Watkiss Way. This TIS focused on the traffic operations at the following intersections:
— Burnside Road West and Watkiss Way; — Highway 1 westbound off-ramp at Burnside Road West; and — Burnside Road West and Access Road (access point).
In addition, an access on Watkiss Way was proposed for emergency use in the event that Burnside Road is closed. The access will be gated for day-to-day operations and flagged during use. The emergency access is expected to cross the Galloping Goose Trail. The site plan indicates that there is no connection between the Trail and the site for pedestrians or cyclists.
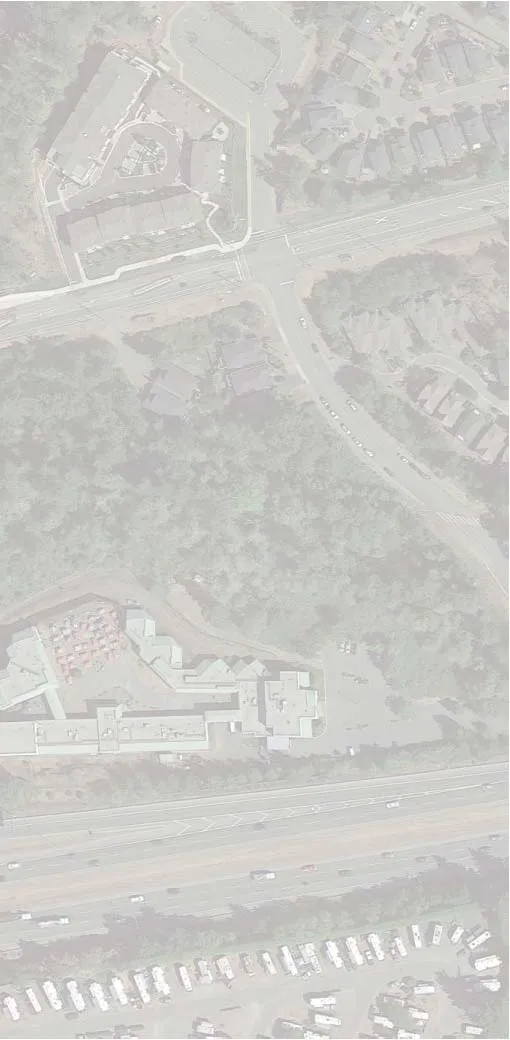
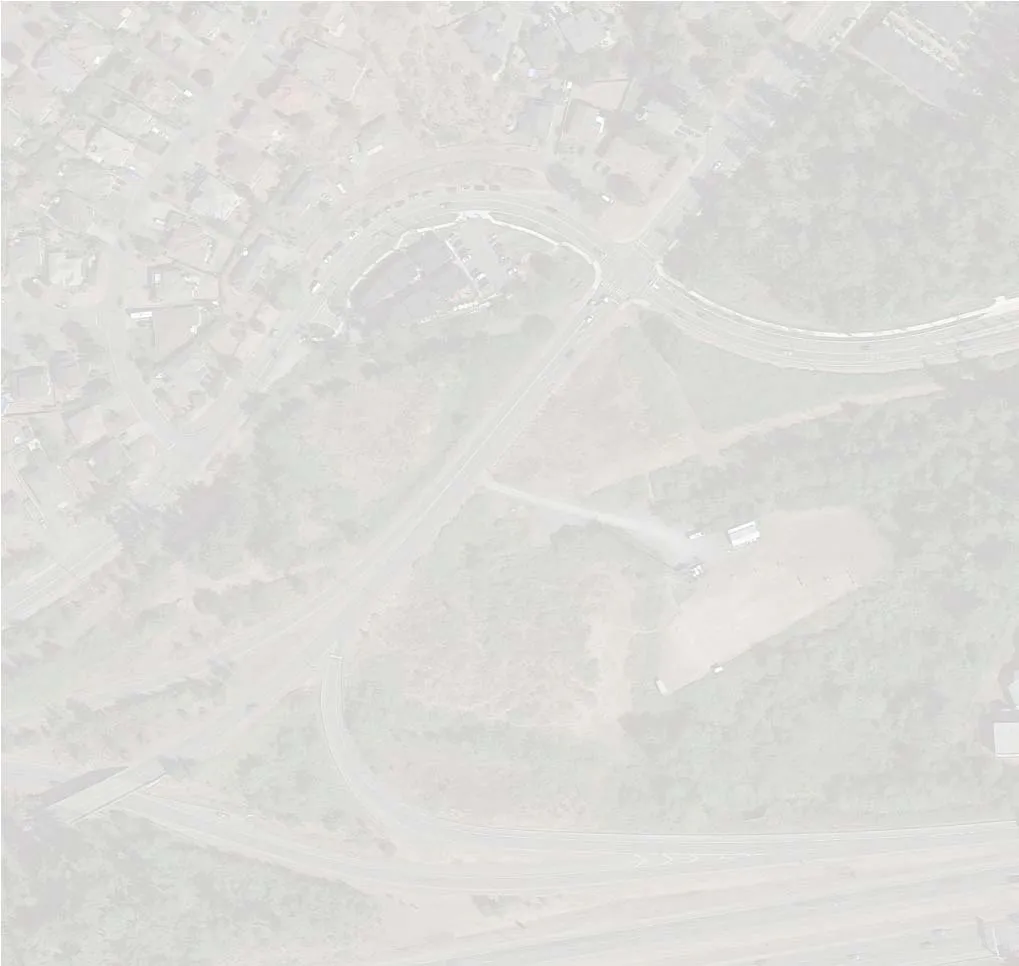
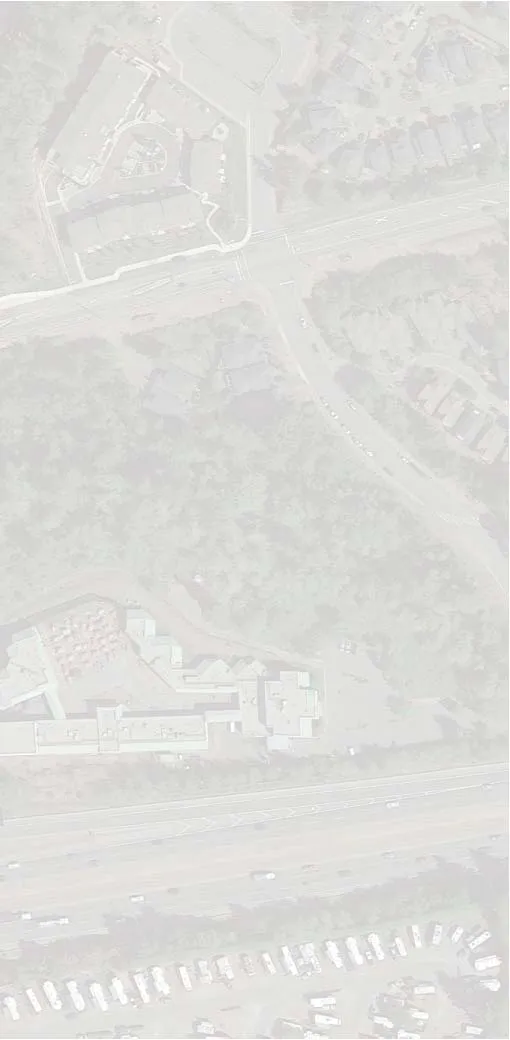
Figure 1 illustrates the proposed site plan and study intersections.
WSP contacted the BC Transit for information regarding the proposed facility, as outlined below:
- Total Buses at Opening Day: 90 buses (potential increase to 115 buses in 20 years)
- Full Build-Out: 5 years (2022)
- Hours of Operation: 4:30 a.m. to 11:00 p.m.
- Employees Arrival / Departure Time for Both Shifts: 6:45 a.m. – 8:00 a.m. and 4:00 p.m. – 6:30 p.m. (Evening starts between 1:00 p.m. – 3:00 p.m.)
- Total Number of Employees: 112 employees (on-site staff + bus drivers)
- Employee Parking Stalls: 19 (utilize empty bus stalls during office hours)
- Visitor / Accessible Stalls: 8 stalls
- Number of Visitors: 10 per day
- Total Buses Enter / Exit During Peak Periods:
- 50 buses (7:00 a.m. – 8:00 a.m.)
- 40 buses (8:00 a.m. – 9:00 a.m.)
- 40 buses (1:00 p.m. – 2:00 p.m.)
- 20 buses (2:00 p.m. – 3:00 p.m.)
- 10 buses (3:00 p.m. – 6:00 p.m.) per hour
- 20 buses per hour (6:00 p.m. – 11:00 p.m.)
1.2 EXISTING CONDITIONS
VEHICULAR NETWORK
The existing Highway 1 westbound off-ramp at Burnside Road West is stop-controlled with Burnside Road West operating free-flow. The outside lane of Burnside Road West northbound is reserved for right-turn movements at Watkiss Way. The Burnside Road West and Watkiss Way intersection is an All-Way Stop-Controlled (AWSC) intersection. The posted speeds are 50 km/h on Burnside Road West and 40 km/h on Watkiss Way. There are two school zones immediately to the north and to the east of the study intersection.
PEDESTRIAN AND CYCLIST FACILITIES
The following pedestrian facilities are provided adjacent to the site:
— Bike lanes on both sides on Watkiss Way; — Bike lanes on both sides on Burnside Road West north of Watkiss Way; — Sidewalk on the south side of Watkiss Way west of Burnside Road West; — Sidewalk on the north side of Watkiss Way east of Burnside Road West; — Sidewalks on both sides on Burnside Road West north of Watkiss Way; — Pathway on the south side of Watkiss Way west of Burnside Road West; and, — Galloping Goose Trail south of Watkiss Way.
TRANSIT FACILITIES
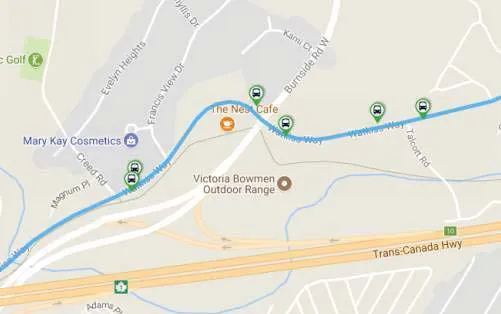
The following routes were identified adjacent to the site:
- No. 22 | Vic General / Hillside Mall: Eastbound on Watkiss Way from 6:12 a.m. – 7:35 p.m.
- No. 39 | Westhills / Camosun / Royal Oak / UVic: Westbound on Watkiss Way from 7:01 a.m. – 6:31 p.m.
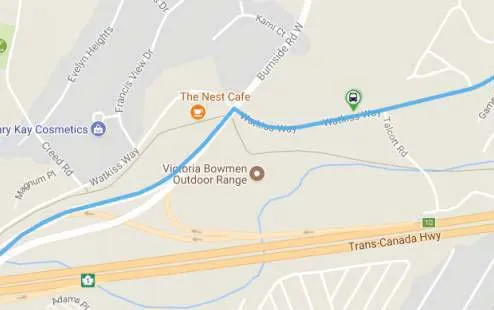
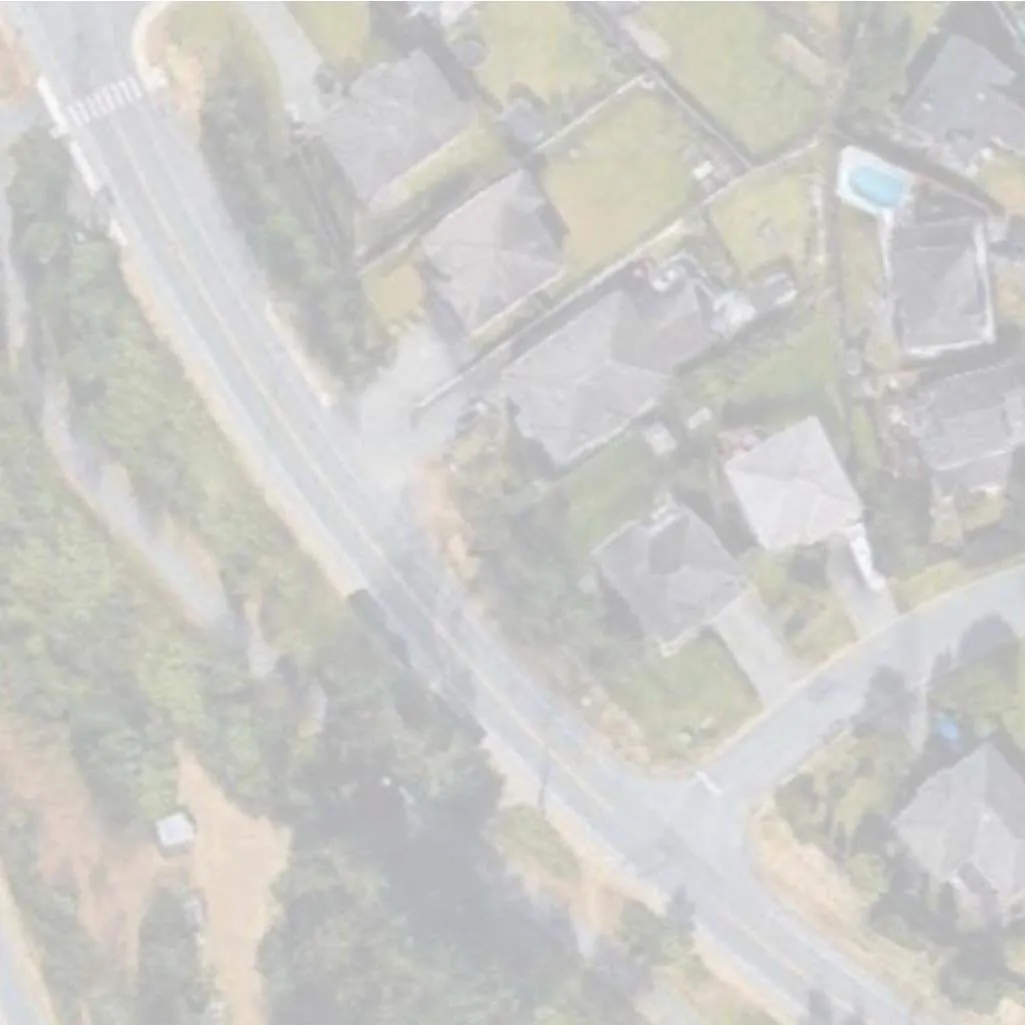
Figure 2 illustrates a snapshot of the existing bus routes adjacent to the proposed site.
2 TRIP GENERATION
2.1 TRIP GENERATION
Typically, the Institute of Transportation Engineering (ITE) Trip Generation Manual (Manual) is used to determine the trips any particular land use will generated; however, an operations and maintenance facility is not a predefined land use and no projection were available. For the purpose of this study, the new trips were estimated using the information provided by BC Transit based on the number of buses as well as anticipated employees and shifts, outlined in Section 1.1. Since there are no active transportation facilities provided south of Watkiss Way (sidewalks, trails, or bike lanes) connecting to the site, the trips generated by this development were assumed to be all vehicular trips. Table 1 presents the estimated trip generated by this site.
It should be noted that there are typically no buses entering the facility during the morning peak hour demand. For conservative estimates, a total of 5 buses was included to account for breakdown / services. In addition, the evening shift employees start between 1:00 p.m. and 3:00 p.m., and were not included in the trip generation in the afternoon peak hour.
Table 1 | New Trips
| | Morning Peak Hour | Afternoon Peak Hour | | :--- | :--- | :--- | :--- | :--- | :--- | :--- | | | Enter | Exit | Total | Enter | Exit | Total | | Employees | 40 | 5 | 45 | 5 | 15 | 20 | | Buses | 5 | 40 | 45 | 10 | 5 | 15 | | Visitors | 1 | 1 | 2 | 1 | 1 | 2 | | Total Trips: | 46 | 46 | 92 | 16 | 21 | 37 |
2.2 TRIP DISTRIBUTION AND ASSIGNMENT
The anticipated site-generated traffic volumes were applied to the study intersections based on an assessment of how buses / employees would enter or exit the site, as illustrated in Figure 3. The new traffic volumes were distributed to the intersections using a comparison of existing traffic patterns obtained from the traffic data, and the location of the facility in relation to the Town and Greater Victoria area, as summarized in Table 2.
Table 2 | Trip Distribution and Assignment
| Road | To / From | % Distribution | Morning Peak Hour | Afternoon Peak Hour | | :--- | :--- | :--- | :--- | :--- | :--- | :--- | :--- | :--- | | | | | Enter | Exit | Total | Enter | Exit | Total | | Burnside Rd | North | 25% | 12 | 12 | 24 | 3 | 5 | 8 | | Burnside Rd | South | 50% | 23 | 28 | 51 | 8 | 13 | 21 | | Hwy 1 WB Off-Ramp | South | 10% | 5 | n/a | 5 | 2 | n/a | 2 | | Watkiss Way | East | 15% | 7 | 7 | 14 | 2 | 3 | 5 | | Total: | | 100% | 46 | 46 | 92 | 16 | 21 | 37 |
3 TRAFFIC INFORMATION
3.1 EXISTING VOLUMES
Existing turning movement counts at the Burnside Road West and Watkiss Way intersection were collected the week of September 10, 2017 during the morning (7:00 a.m. – 9:00 a.m.) and afternoon (3:00 p.m. – 6:00 p.m.) peak periods to capture typical commuter traffic. The morning peak hour for this intersection occurred between 7:45 a.m. and 8:45 a.m. and the afternoon peak hour between 4:00 p.m. and 5:00 p.m.
The traffic volumes for the Highway 1 Westbound Off-ramp at Burnside Road west were derived from BC Ministry of Transportation and Infrastructure counters located in the adjacent areas, attached in Appendix A. The morning and afternoon peak hour volumes were assumed to be 10% of the daily traffic volumes. No traffic data was provided for the Burnside Road West and Access Road intersection. For the purpose of this study, minimal traffic volumes (5 vehicles per direction) were assigned to the turning movement volumes for the Access Road. It should be noted that where no traffic data were collected, volumes along Burnside Road West were derived from the Watkiss Way intersection as well as the Highway 1 westbound off-ramp intersection.
Figure 4 illustrates the existing traffic volumes at the study intersections during the morning and afternoon peak hour.

3.2 BACKGROUND FORECAST VOLUMES
The background forecast traffic scenario is a projection of the traffic volumes anticipated without the demand from the proposed development. An annual 2% growth was applied to the study intersections to determine the background traffic volumes for the 2022 horizon year. Figure 5 illustrates the 5-year (2022) background forecast traffic volumes at the study intersections during the morning and afternoon peak hour volumes.
3.3 TOTAL FORECAST VOLUMES
Total forecast volumes associated with the proposed development are obtained by combining the background traffic growth with the new trips associated with the development. Figure 6 illustrates the 5-year (2022) total forecast traffic volumes at the study intersections during the morning and afternoon peak hour volumes.
4 TRAFFIC OPERATIONS
Existing, background and total forecast volumes have been assessed using Synchro 9.0 (industry-standard traffic analysis software). For stop-controlled intersection, Highway Capacity Manual (HCM) 2010 was used to conduct the capacity analysis. The study intersections was assessed during the morning and afternoon peak hour with no additional turning lanes or changes applied. Tables 3 and 4 present the analysis results for the morning and afternoon peak hour for existing, background and total forecast scenarios.
Level of service (LOS) analysis assesses the effectiveness of a transportation system alphabetically from A to F, with LOS A equating to the best operating conditions with little delay and LOS F representing the failure of a movement or intersection with long delays. LOS E is typically considered the limit of acceptable operation for left-turn movements at a two-way stop-control intersection.
The volume-to-capacity (v/c) ratio is representative of congestion and available capacity, and may be used to identify a movement’s ability to accommodate fluctuations in traffic flow. V/C values of 0.90 or greater typically indicate a system that has reached its limit of operational effectiveness. The 95th percentile queue length, determined using SimTraffic, represents the maximum length of a queue a movement may experience with 95th percentile traffic volumes.
BURNSIDE ROAD WEST AND WATKISS WAY INTERSECTION
Existing Conditions | Capacity analysis indicates that the northbound movements fail (LOS F) during and morning peak hour and the shared through / left-turn lane experiences significant delays (LOS D) during the afternoon peak hour. The southbound approach operates with acceptable delays (LOS C) during the morning peak hour and fails (LOS F) during the afternoon peak. It was identified that Burnside Road West operates overcapacity (v/c > 1.00) in the morning peak hour and Watkiss Way westbound (east leg) operates at constrained conditions and is approaching its effective capacity.
Background Forecast | Traffic operations on the northbound and southbound approaches are expected to continue to decline during the morning and afternoon peak hour. In addition, the westbound approach is expected to reach LOS E during the morning peak hour. Similarly, the northbound through lane is expected to fail (LOS E) during the afternoon peak.
Total Forecast | The overall intersection operation is expected to continue to deteriorate for both peak hours. The northbound approach is expected to operate under constrained conditions (v/c > 0.9) during both peak hours. Similarly, the westbound approach is anticipated to continue to decline (LOS E) during both peak hours. The highest 95th percentile queue length of 61 m on the northbound approach is not anticipated to interfere with the Access Road intersection operations.
BURNSIDE ROAD WEST AND ACCESS ROAD INTERSECTION
Existing Condition | overall intersection operates acceptably during the morning and afternoon peak hour with minimal queue lengths.
Background Forecast | intersection is anticipated to continue to operate at acceptable conditions during the morning and afternoon peak hour.
Total Forecast | overall intersection is expected to operate acceptably while the Access Road (westbound) is anticipated to operate at LOS D/C during both peak hours with acceptable queue lengths. With the existing northbound right-turn lane, there are minimal queuing on the northbound approach.
BURNSIDE ROAD WEST AND HIGWAY 1 WB OFF-RAMP INTERSECTION
Existing Condition | the Highway 1 Westbound off-ramp operates at LOS A/B during both peak hours with acceptable queue length (approximately 3 vehicles queuing) while Burnside Road West free-flows.
Background Forecast | the Highway 1 Westbound off-ramp is expected to operate acceptably.
Total Forecast | the Highway 1 Westbound off-ramp is expected to continue to operate acceptably during both peak hours with acceptable 95th percentile queue lengths.
Table 3 | Morning Peak Hour LOS Results for Existing, Background, and Total Forecast Scenarios
| | | EASTBOUND | WESTBOUND | NORTHBOUND | SOUTHBOUND | | :--- | :--- | :---: | :---: | :---: | :---: | :---: | :---: | :---: | :---: | :---: | :---: | :---: | :---: | | | | LT | TH | RT | LT | TH | RT | LT | TH | RT | LT | TH | RT | | Burnside Road West and Watkiss Way | | | | | | | | | | | | | | | Existing | V/C Ratio | | 0.53 | | | 0.76 | | | 1.02 | | 1.03 | | 0.42 | | | 95th Queue (m) | | 23 | | | 26 | | | 42 | | 44 | | 17 | | | LOS | | C | | | D | | | F | | F | | C | | Background | V/C Ratio | | 0.62 | | | 0.87 | | | 1.21 | | 1.21 | | 0.49 | | | 95th Queue (m) | | 24 | | | 29 | | | 47 | | 56 | | 19 | | | LOS | | C | | | E | | | F | | F | | C | | Total | V/C Ratio | | 0.63 | | | 0.89 | | | 1.25 | | 1.25 | | 0.53 | | | 95th Queue (m) | | 25 | | | 32 | | | 61 | | 50 | | 19 | | | LOS | | C | | | E | | | F | | F | | C | | Burnside Road West and Access Road | | | | | | | | | | | | | | | Existing | V/C Ratio | - | - | - | 0.04 | - | 0.04 | - | 0 | - | - | 0.01 | - | | | 95th Queue (m) | - | - | - | 8 | - | 8 | - | 1 | - | - | 6 | - | | | LOS | - | - | - | C | - | C | - | A | - | - | B | - | | Background | V/C Ratio | - | - | - | 0.05 | - | 0.05 | - | 0 | - | - | 0.01 | - | | | 95th Queue (m) | - | - | - | 8 | - | 8 | - | 3 | - | - | 7 | - | | | LOS | - | - | - | C | - | C | - | A | - | - | B | - | | Total | V/C Ratio | - | - | - | 0.35 | - | 0.35 | - | 0 | - | - | 0.04 | - | | | 95th Queue (m) | - | - | - | 19 | - | 19 | - | 4 | - | - | 18 | - | | | LOS | - | - | - | D | - | D | - | A | - | - | B | - | | Burnside Road and Highway 1 Westbound Off-Ramp | | | | | | | | | | | | | | | Existing | V/C Ratio | - | - | - | - | - | 0.12 | - | 0 | - | - | 0 | - | | | 95th Queue (m) | - | - | - | - | - | 18 | - | 0 | - | - | 0 | - | | | LOS | - | - | - | - | - | B | - | A | - | - | A | - | | Background | V/C Ratio | - | - | - | - | - | 0.14 | - | 0 | - | - | 0 | - | | | 95th Queue (m) | - | - | - | - | - | 18 | - | 0 | - | - | 0 | - | | | LOS | - | - | - | - | - | B | - | A | - | - | A | - | | Total | V/C Ratio | - | - | - | - | - | 0.15 | - | 0 | - | - | 0 | - | | | 95th Queue (m) | - | - | - | - | - | 20 | - | 1 | - | - | 0 | - | | | LOS | - | - | - | - | - | B | - | A | - | - | A | - |
Table 4 | Afternoon Peak Hour LOS Results for Existing, Background, and Total Forecast Scenarios
| | | EASTBOUND | WESTBOUND | NORTHBOUND | SOUTHBOUND | | :--- | :--- | :---: | :---: | :---: | :---: | :---: | :---: | :---: | :---: | :---: | :---: | :---: | :---: | | | | LT | TH | RT | LT | TH | RT | LT | TH | RT | LT | TH | RT | | Burnside Road West and Watkiss Way | | | | | | | | | | | | | | | Existing | V/C Ratio | | 0.45 | | | 0.64 | | | 0.74 | | 0.22 | | 1.37 | | | 95th Queue (m) | | 18 | | | 20 | | | 23 | | 14 | | 43 | | | LOS | | C | | | C | | | D | | B | | F | | Background | V/C Ratio | | 0.54 | | | 0.78 | | | 0.89 | | 0.26 | | 1.61 | | | 95th Queue (m) | | 19 | | | 23 | | | 24 | | 15 | | 65 | | | LOS | | C | | | D | | | E | | B | | F | | Total | V/C Ratio | | 0.55 | | | 0.8 | | | 0.93 | | 0.28 | | 1.64 | | | 95th Queue (m) | | 19 | | | 22 | | | 25 | | 15 | | 73 | | | LOS | | C | | | D | | | E | | B | | F | | Burnside Road West and Access Road | | | | | | | | | | | | | | | Existing | V/C Ratio | - | - | - | 0.03 | - | 0.03 | - | 0 | - | - | 0.01 | - | | | 95th Queue (m) | - | - | - | 8 | - | 8 | - | 0 | - | - | 4 | - | | | LOS | - | - | - | B | - | B | - | A | - | - | A | - | | Background | V/C Ratio | - | - | - | 0.03 | - | 0.03 | - | 0 | - | - | 0.01 | - | | | 95th Queue (m) | - | - | - | 8 | - | 8 | - | 2 | - | - | 5 | - | | | LOS | - | - | - | C | - | C | - | A | - | - | A | - | | Total | V/C Ratio | - | - | - | 0.12 | - | 0.12 | - | 0 | - | - | 0.01 | - | | | 95th Queue (m) | - | - | - | 13 | - | 13 | - | 2 | - | - | 6 | - | | | LOS | - | - | - | C | - | C | - | A | - | - | A | - | | Burnside Road and Highway 1 Westbound Off-Ramp | | | | | | | | | | | | | | | Existing | V/C Ratio | - | - | - | - | - | 0.08 | - | 0 | - | - | 0 | - | | | 95th Queue (m) | - | - | - | - | - | 15 | - | 0 | - | - | 0 | - | | | LOS | - | - | - | - | - | A | - | A | - | - | A | - | | Background | V/C Ratio | - | - | - | - | - | 0.08 | - | 0 | - | - | 0 | - | | | 95th Queue (m) | - | - | - | - | - | 14 | - | 0 | - | - | 0 | - | | | LOS | - | - | - | - | - | A | - | A | - | - | A | - | | Total | V/C Ratio | - | - | - | - | - | 0.08 | - | 0 | - | - | 0 | - | | | 95th Queue (m) | - | - | - | - | - | 14 | - | 0 | - | - | 0 | - | | | LOS | - | - | - | - | - | A | - | A | - | - | A | - |
5 ROAD NETWORK IMPACTS
Without the proposed development, the Burnside Road West and Watkiss Way intersection operates poorly during both peak hours for the existing traffic volumes and is expected to continue to decline in the 5-year forecast scenarios.
TRAFFIC SIGNAL WARRANT ANALYSIS
Warrant for traffic signal was completed using the Transportation Association of Canada (TAC) Traffic Signal Warrant, attached in Appendix B. It should be noted that the warrant requires a 6-hour traffic volumes. Since the traffic data provided does not include the midday volumes, a sensitivity assessment was completed to determine the volume threshold where the intersection will meet the signal warrant requirement of 100 points. It was identified that a signal is warranted at the Burnside Road West and Watkiss Way intersection if the midday traffic volumes are as low as 40% of the afternoon peak hour volumes. As the midday peak period peak period traffic volumes are expected to exceed this threshold, traffic signals are assumed to be warranted at the existing volumes.
A summary of the capacity analysis for the signalized Burnside Road West and Watkiss Way intersection is presented in Table 5.
Table 5 | LOS Results for Signalized Intersection for Existing, Background, and Total Forecast Volumes
| | | EASTBOUND | WESTBOUND | NORTHBOUND | SOUTHBOUND | | :--- | :--- | :---: | :---: | :---: | :---: | :---: | :---: | :---: | :---: | :---: | :---: | :---: | | | | LT | TH | RT | LT | TH | RT | LT | TH | RT | LT | TH | RT | | Burnside Road West and Watkiss Way - Signalized - Existing Volumes | | | | | | | | | | | | | | | AM Peak | V/C Ratio | | 0.46 | | | 0.6 | | | 0.6 | | 0.56 | | 0.22 | | | 95th Queue (m) | | 33 | | | 42 | | | 57 | | 47 | | 32 | | | LOS | | B | | | B | | | B | | A | | A | | PM Peak | V/C Ratio | | 0.36 | | | 0.67 | | | 0.77 | | 0.13 | | 0.85 | | | 95th Queue (m) | | 27 | | | 32 | | | 42 | | 16 | | 68 | | | LOS | | B | | | C | | | C | | A | | C | | Burnside Road West and Watkiss Way - Signalized - Background Forecast | | | | | | | | | | | | | | | AM Peak | V/C Ratio | | 0.48 | | | 0.67 | | | 0.62 | | 0.57 | | 0.23 | | | 95th Queue (m) | | 43 | | | 54 | | | 59 | | 56 | | 43 | | | LOS | | B | | | C | | | B | | A | | A | | PM Peak | V/C Ratio | | 0.4 | | | 0.79 | | | 0.85 | | 0.13 | | 0.86 | | | 95th Queue (m) | | 31 | | | 41 | | | 50 | | 18 | | 69 | | | LOS | | B | | | D | | | C | | A | | C | | Burnside Road West and Watkiss Way - Signalized - Total Forecast | | | | | | | | | | | | | | | AM Peak | V/C Ratio | | 0.49 | | | 0.67 | | | 0.63 | | 0.58 | | 0.24 | | | 95th Queue (m) | | 40 | | | 53 | | | 64 | | 54 | | 54 | | | LOS | | B | | | C | | | B | | A | | B | | PM Peak | V/C Ratio | | 0.39 | | | 0.81 | | | 0.86 | | 0.14 | | 0.87 | | | 95th Queue (m) | | 31 | | | 40 | | | 50 | | 17 | | 75 | | | LOS | | B | | | D | | | D | | A | | C |
With the provision of a traffic signal, operations at the Burnside Road West and Watkiss Way intersection is expected to improve to LOS D or better during both peak hours for the existing and background forecast volumes. The intersection is expected to approach its effective capacity during the afternoon peak hour at full build-out. Additional geometric improvements on Burnside Road West may be required as traffic volumes continue to grow.
LEFT-TURN LANE WARRANT ANALYSIS
A left-turn warrant analysis was completed using the Ministry of Transportation and Highways Left-turn Lane Warrants at the Burnside Road West and access point intersection, attached in Appendix C. The warrant analysis was completed for both morning and afternoon peak hour volumes for the total forecast scenarios. It was identified that a southbound left-turn lane on Burnside Road West onto the Access Road is warranted at full build-out phase. The recommended storage length is 15 metres.
Table 6 summarizes the capacity analysis for the Burnside Road West and Access Road intersection, with the addition of a southbound left-turn bay on Burnside Road West.
Table 6 | LOS Results for Modified Intersection for the Total Forecast Volumes
| | | EASTBOUND | WESTBOUND | NORTHBOUND | SOUTHBOUND | | :--- | :--- | :---: | :---: | :---: | :---: | :---: | :---: | :---: | :---: | :---: | :---: | :---: | :---: | | | | LT | TH | RT | LT | TH | RT | LT | TH | RT | LT | TH | RT | | Total - AM | V/C Ratio | - | - | - | 0.35 | - | 0.35 | - | 0 | 0 | 0.04 | 0 | - | | | 95th Queue (m) | - | - | - | 16 | - | 16 | - | 0 | 2 | 12 | 0 | - | | | LOS | - | - | - | D | - | D | - | A | A | B | A | - | | Total - PM | V/C Ratio | - | - | - | 0.12 | - | 0.12 | - | 0 | 0 | 0.01 | 0 | - | | | 95th Queue (m) | - | - | - | 12 | - | 12 | - | 0 | 0 | 6 | 0 | - | | | LOS | - | - | - | C | - | C | - | A | A | A | A | - |
ACTIVE MODES NETWORK
An additional access is proposed on Watkiss Way for emergency purposes, should Burnside Road West be closed. The access will be gated during typical day-to-day operations, and flagged during use. Although the proposed access will cross Galloping Goose Trail, there are no major conflicts anticipated. There is currently no connections between the Galloping Goose Trail and the proposed facility. While there were minimal pedestrians / cyclists activities observed between the site and the adjacent areas, the provision of the access will encourage employees to use alternative modes of travel to work.
SIGHTLINE ASSESSMENT
A sightline assessment was completed for the proposed access point using the TAC Geometric Design Guide, as presented in Figure 9. A Combination Truck (WB-19 and WB-20) vehicle type was used in place of a bus and to determine the maximum sightline required. With an eye height of 1.8 m and object height of 0.6 m, the TAC Geometric Design Guide requires 190 m sightline visibility for heavy vehicles on a 60 km/h design speed roadway. Figures 7 and 8 illustrate the required sight distance for left- and right-turn from a stop.
Due to the limited survey data completed for the preliminary design stage, approximately 130 m of sightline visibility can be identified for both directions on Burnside Road West. However, additional field investigation was completed to determine the vertical sightline visibility and was identified that the 190 m required sightline is provided for both directions. Removal of vegetation will be required to improve visibility and should be further investigated in the detailed design stage. The field investigation summary is provided in Appendix D.
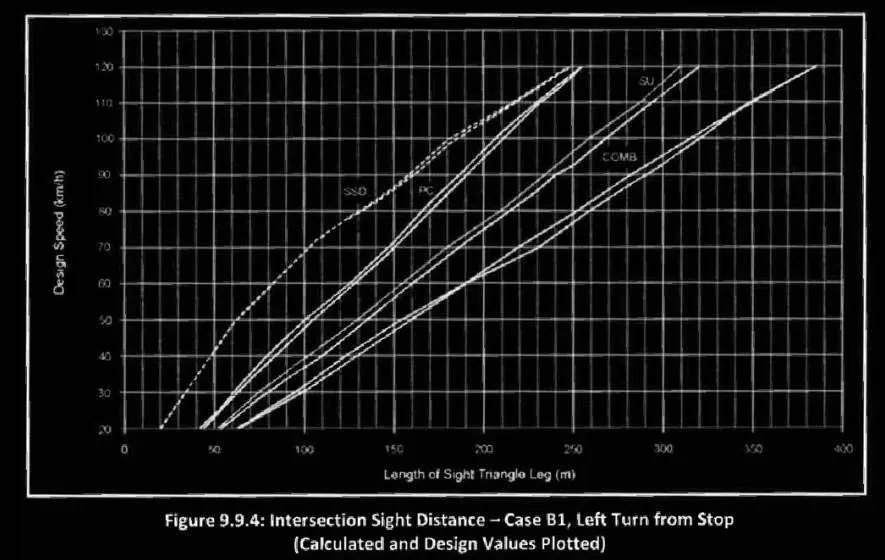
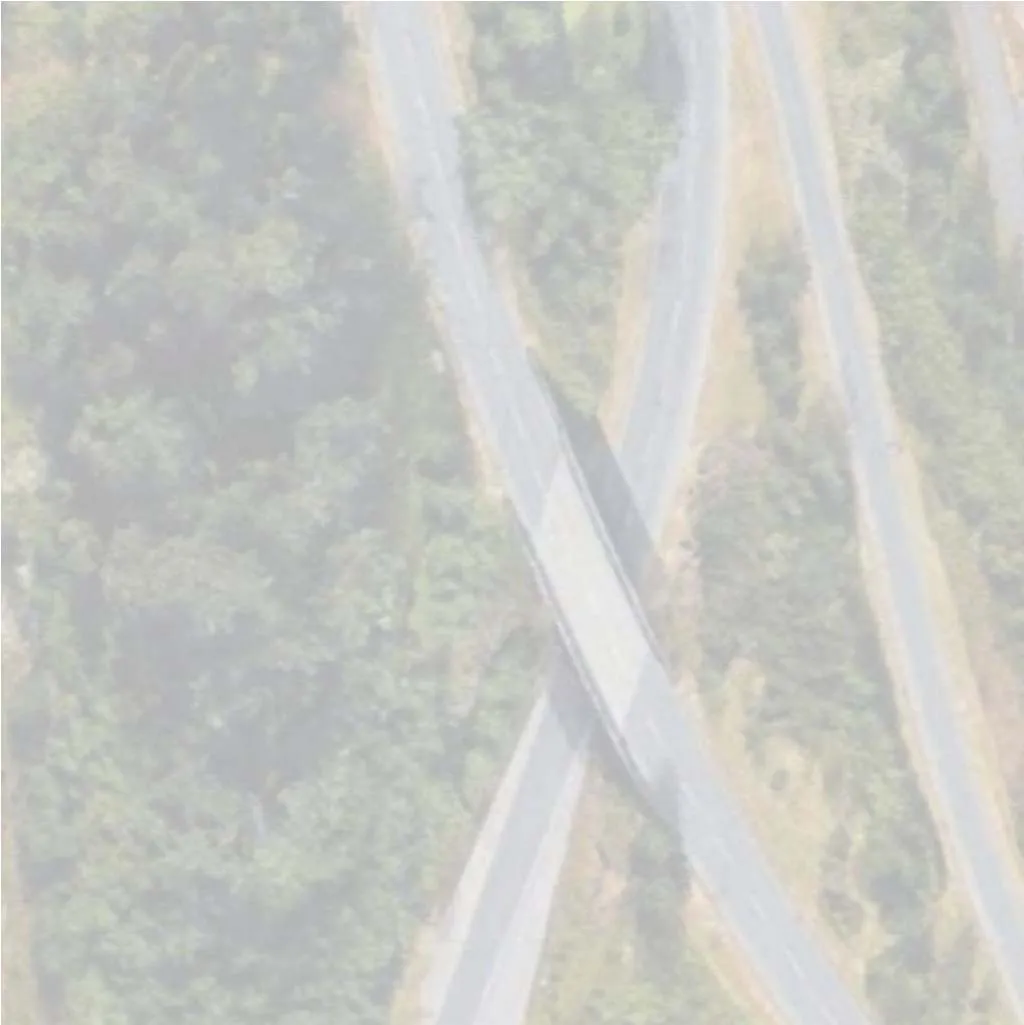
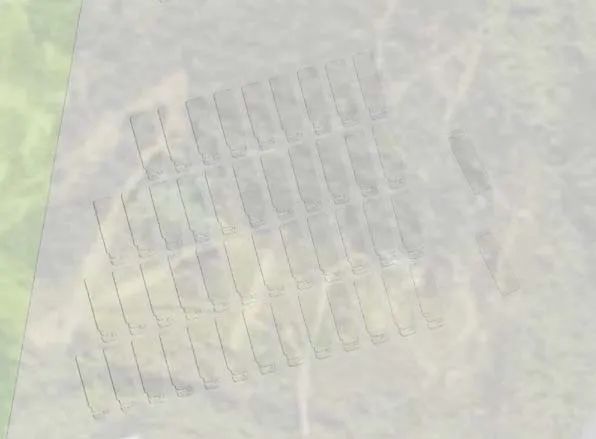
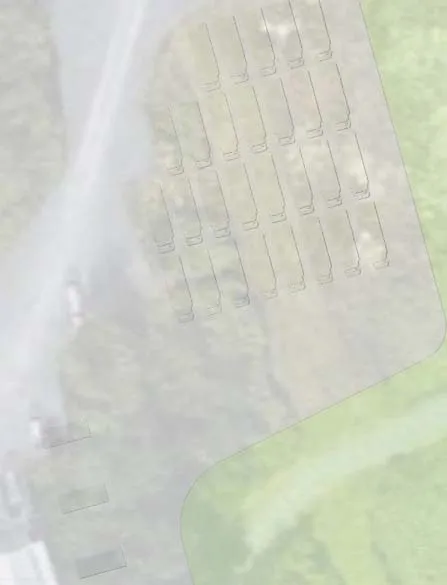
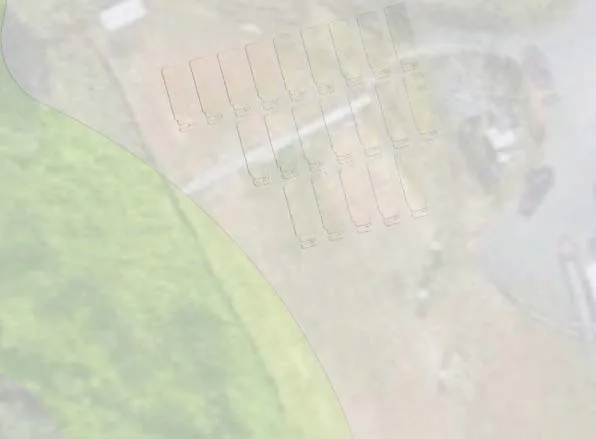

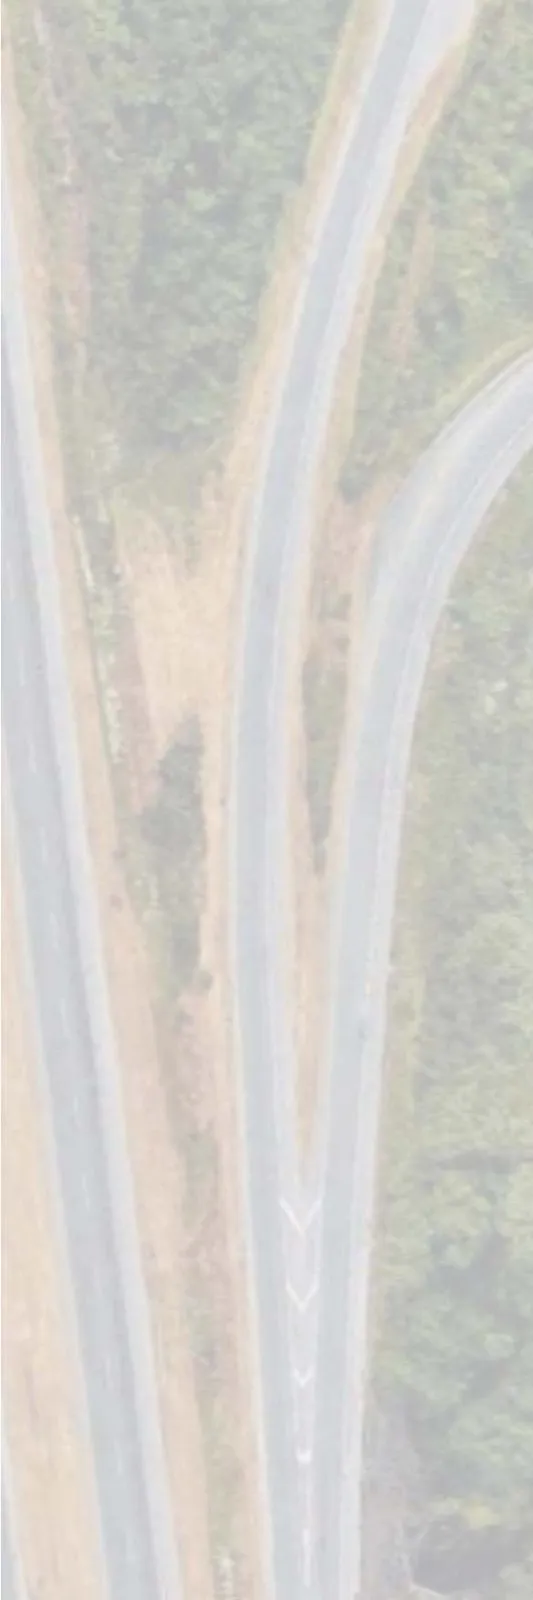
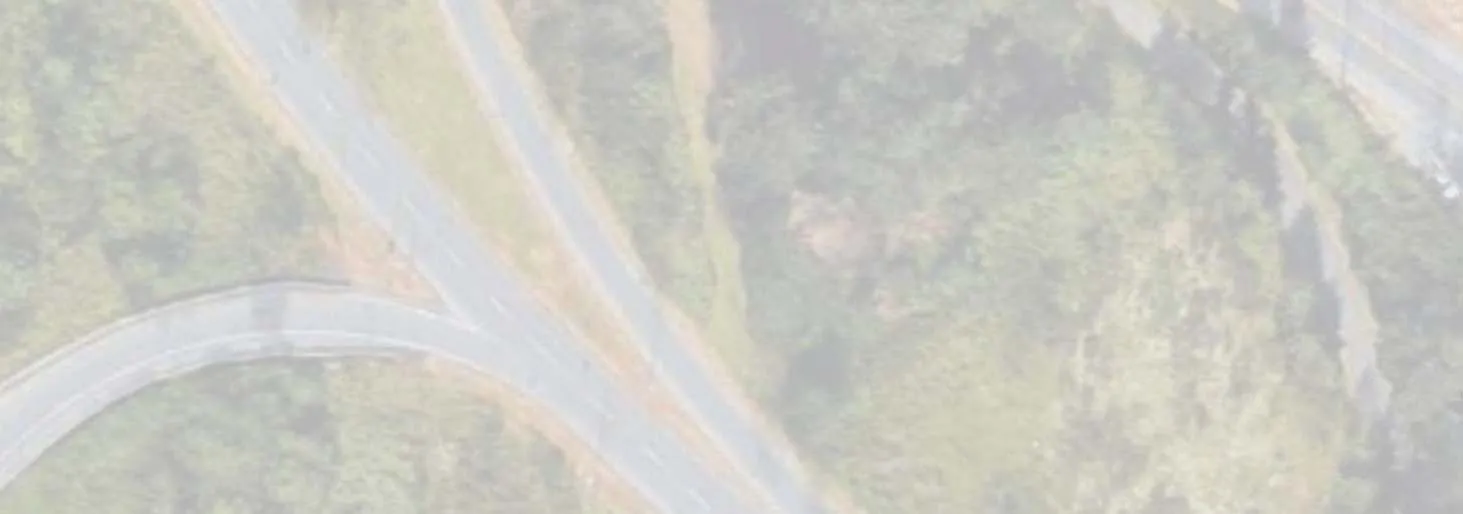
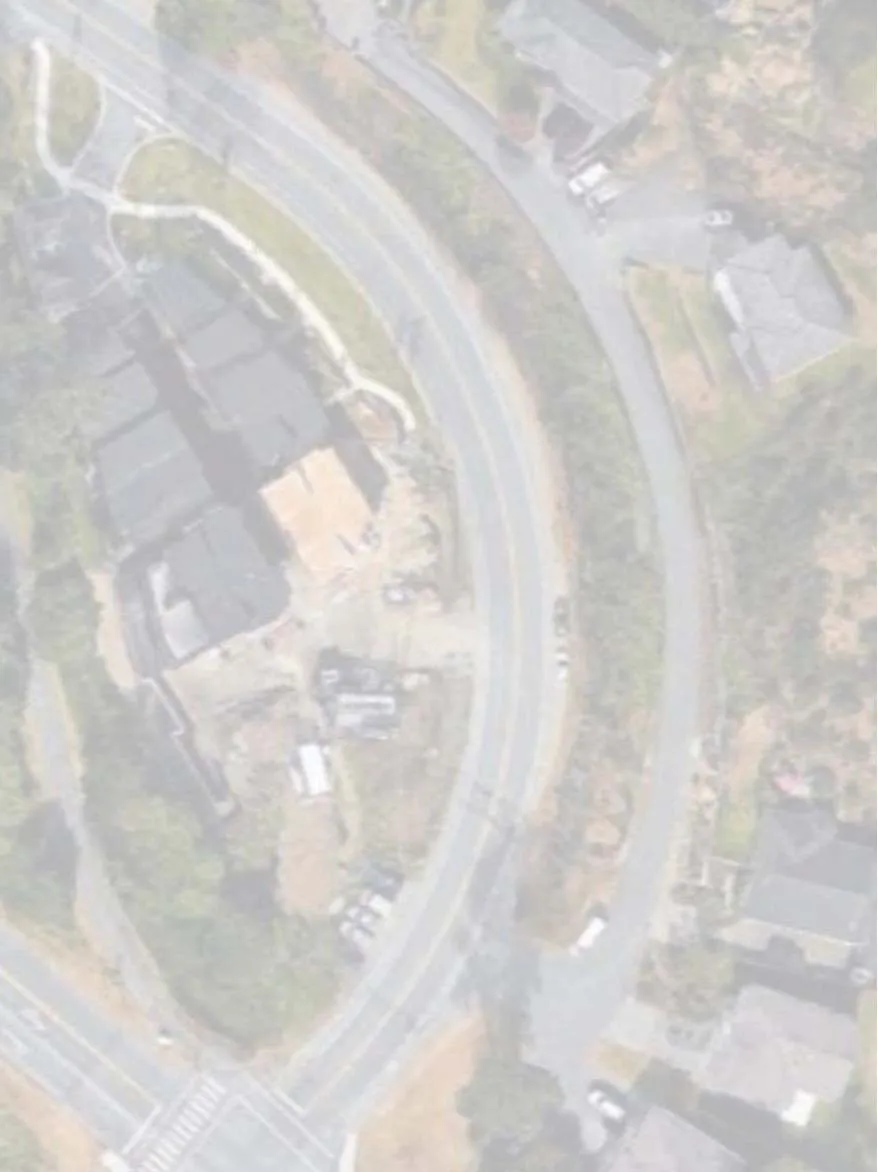
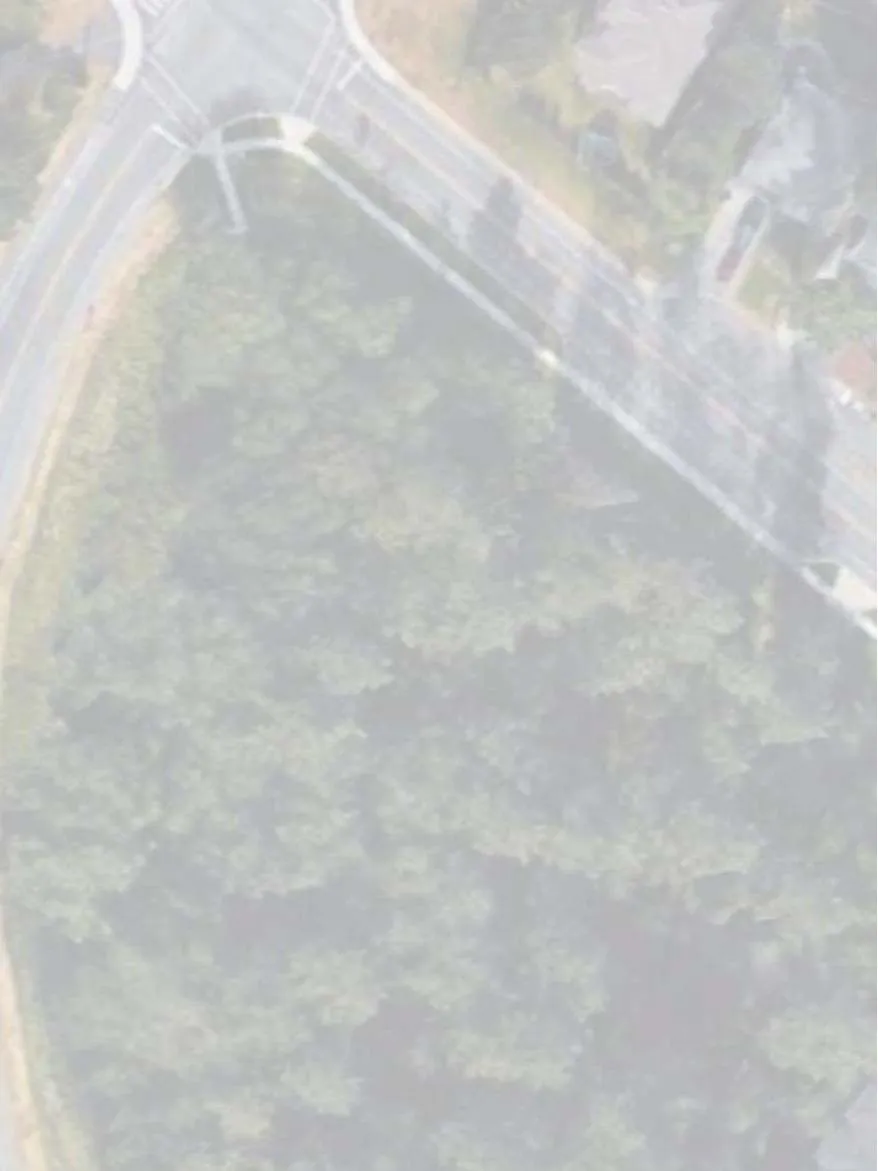
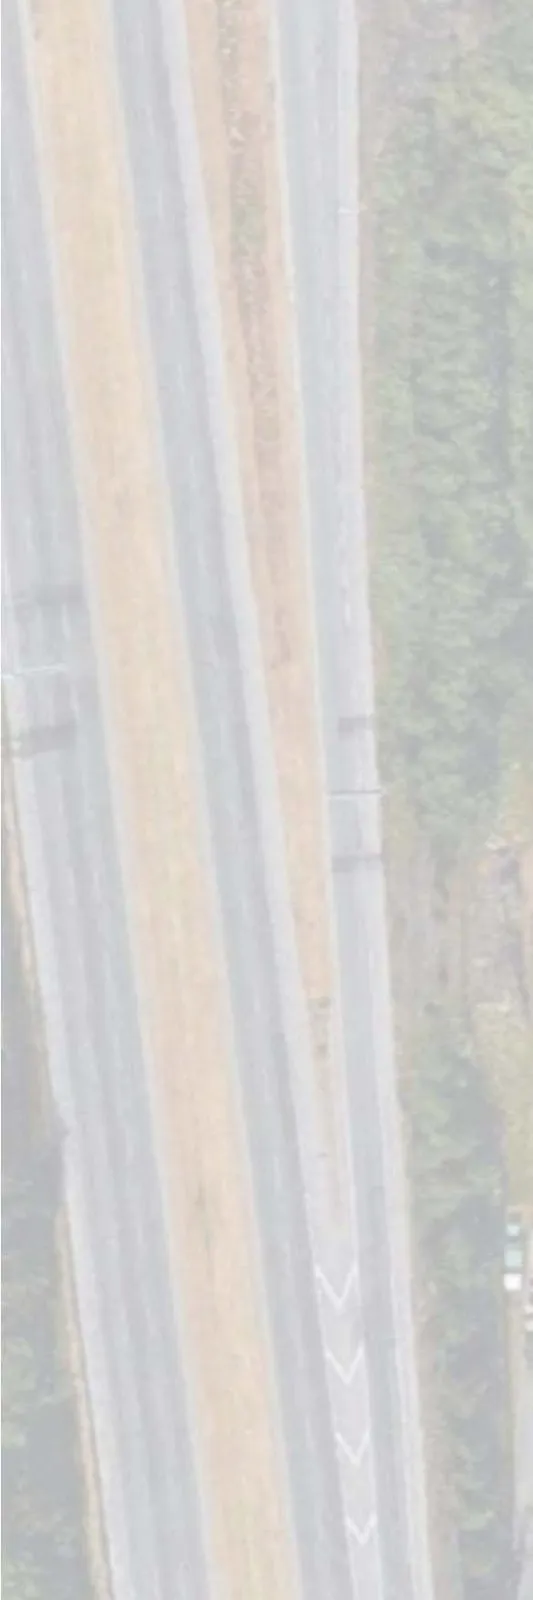
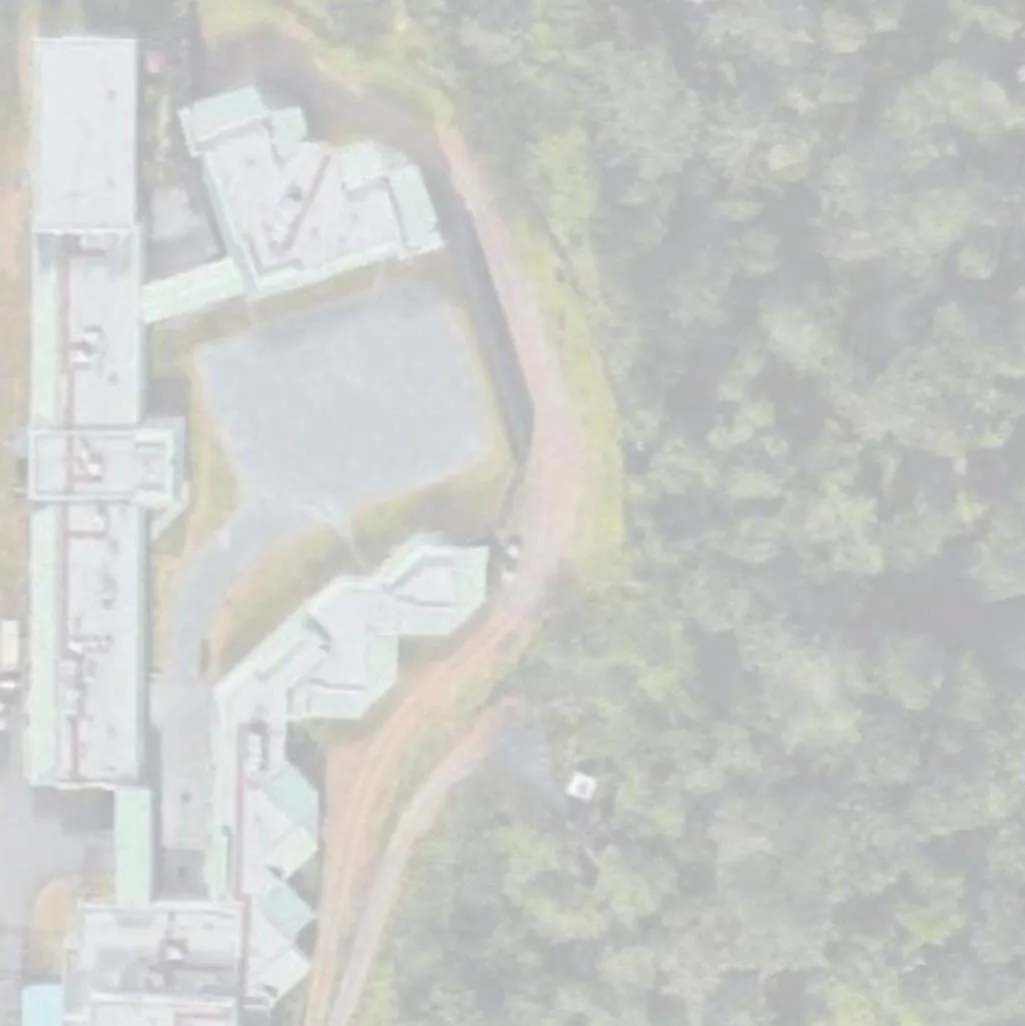
Figure 9 | HandyDART Facility Departure Sightline Assessments
6 PARKING
6.1 PARKING
Typically, the number of required parking spaces is identified based on the zoning district using the Town of View Royal Zoning Bylaw (No. 900); however, the proposed site is to be developed for a unique use and no parking requirements were provided. The proposed development is currently zoned as a P-3 Zone | Parks and Recreation, as per Town of View Royal Zoning Map Schedule B (January 2017). It was identified that a request for rezoning has been submitted and an appropriate zone may be created for this particular use.
For the purpose of this study, parking requirements were estimated based on the actual anticipated demand. Based on the information provided, presented in Appendix E, the facility is expected to have a total of 112 employees, comprises of 32 on-site employees and 80 bus drivers during both shifts. Since the facility hours of operation begins at 4:30 a.m., the estimation of total parking demand was completed for on-site employees and the bus drivers. In addition to the 80 bus parking stalls, a total of 31 employee stalls was estimated, using the following assumptions:
On-site Employees (32 staff) | assuming 85% of the employees will work the morning shift with an occupancy rate of 1.2 passengers / vehicle, a total of 23 parking stalls will be required.
Bus Drivers (80 drivers) | assuming 10% of drivers during the initial dispatch, a total of 8 stalls will be required. It is expected that employees will utilize the bus parking areas once the allotted staff parking spaces are full, as a portion of the fleet will be operating during the day.
Since HandyDART provides door to door service, the total visitors were estimated to be 10 patrons per day, based on other BC Transit site statistics. For conservative estimates, a minimum of 4 visitor stalls (40% of daily visitors) should be provided. The British Columbia Building Code indicates that where parking requirements exceed 50 stalls, accessible parking stalls should be provided in the ratio of 1 for every 100 or part thereof (Building Access Handbook 2014 Sec. 3.8.3.4 (2)). Since the total parking requirement was estimated to be 35 stalls, one accessible stall should be provided.
As such, it is anticipated that a total of 35 parking stalls will be required. The site plan indicates that in addition to the 115 bus parking spaces, there is a total of 19 regular stalls and 8 accessible-sized stalls provided. Reducing these larger-sized stalls should be considered to allow for more standard-sized parking spaces. Also, the site plan indicated that there may be some spaces on site available for expansions to meet the parking requirements, if required.
7 RECOMMENDATIONS
The TIS was conducted by quantifying the traffic generated by the proposed HandyDART View Royal O&M Facility as well as determine the impact of proposed development on the adjacent transportation network. The following recommendations have resulted from the completion of the study:
— Without the proposed HandyDART development, the analysis completed within this TIS identifies existing capacity issues at the Burnside Road West and Watkiss Way intersection that will become more constrained in the forecast scenarios.
— A traffic signal is warranted for the existing volumes at the Burnside Road West and Watkiss Way intersection. The provision of a traffic signal is anticipated to improve traffic operations from LOS F to LOS D or better for the existing and background forecast volumes. For total forecast scenario, westbound, southbound, and northbound through/left lanes are expected to operate at its effective capacity. Geometric improvements may be required on Burnside Road as traffic volumes continue to grow.
— A southbound left-turn bay is warranted on Burnside Road West at the access point with a minimum of 15 m storage length.
— Although the emergency access will cross the Galloping Goose Trail, no major impact is anticipated on the pathway trail since the access will be gated for day-to-day operations and flagged during use.
— A review of active modes facilities in the adjacent area indicated that sidewalks / pathways and bike lanes are provided north of the site. There is no connection between the Galloping Goose Trail and the site at existing conditions.
— Although there were very few cyclists observed during the data collection, consideration should be given to providing access between the Galloping Goose Trail and the site to accommodate employees who may wish to cycle to work. In addition, the access between the trail and the proposed facility will also encourage employees to use alternate modes of transportation.
— Based on the survey data and field investigation, the sightline at the access point is acceptable. Some vegetation will need to be removed to improve sight visibility and should be included as part of the detailed design process.
— It is anticipated that a total of 35 parking spaces will be required with 31 stalls for employees and 4 for visitors. A total of one accessible stall should be provided, but not in addition to the 35 stalls requirement. The site plan indicated that there is a total of 27 parking spaces will be provided with 19 regular spaces and 8 accessible-sized stalls. Reducing the number of these larger-sized parking stalls should be considered to allow for allow for the provision of more standard parking spaces. In addition, it was identified that the planned layout will provide additional room for expansion to meet the parking requirements, if required.
Document Images
(10)