Committee of the Whole/Documents/TOWN OF VIEW ROYAL DRAFT 2024-2028 FINANCIAL PLAN - Budget Workshops Day 1
Presentation
TOWN OF VIEW ROYAL DRAFT 2024-2028 FINANCIAL PLAN - Budget Workshops Day 1
February 13, 2024Pages 47–6620 sections
Presentation slides for the first day of budget workshops, highlighting assessments, operating revenue, and expense projections.
Proposed tax increase: 11.8%2024 total operating revenue: $22 M5-year total non-core requests: $10.5 MAverage residential home assessed at $1,060,954
TOWN OF VIEW ROYAL DRAFT 2024-2028 FINANCIAL PLAN
February 5, 2024
Page 47–66
Budget Workshops – Day 1
Purpose
- To orient Council to the draft 2024-2028 Financial Plan package
- To provide Council with key highlights in the draft 2024-2028 Financial Plan
Page 47–66
Financial Plan Orientation
- Legislation
- Sustainability
- Process
- Budget package
Page 47–66
Budget package
February 5, 2024
Table of Contents
- Introduction
- Council initiatives
- Schedule 1 Consolidated Financial Plan
- Schedule 2 Non-core Projects
- Schedule 3 Capital Projects
- Schedule 4 Projected Reserve Balances
- Schedule 5 Service Plans Budgets
- Project Summaries
- Appendix
Page 47–66
Budget Workshops
- Less presentation, more conversation
- Noted
- Shared with all
- Clear direction
Page 47–66
Financial Plan Highlights
The financial plan is comprised of the following key components:
- Assessments
- Operating revenue
- Operating expense
- Capital plan
- Reserves and debt
Page 47–66
Assessments
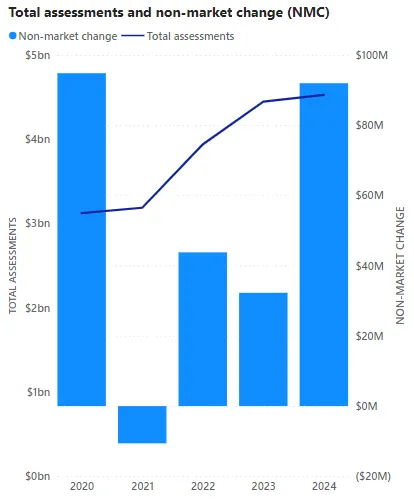
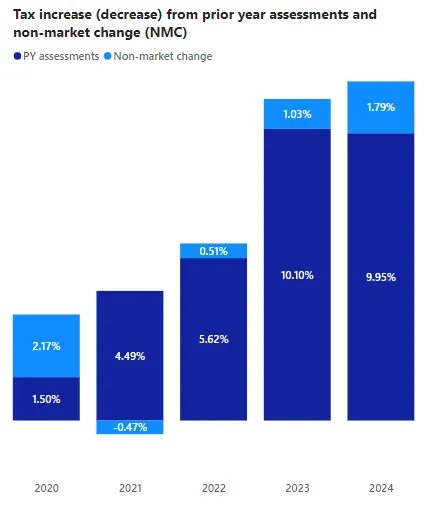
- Tax increase if budget is approved “as is”: 11.8%
- 2024 tax revenue increase due to non-market change: 1.8%
- Value of 1% tax increase in 2024: $111,000
Page 47–66
Operating Revenue
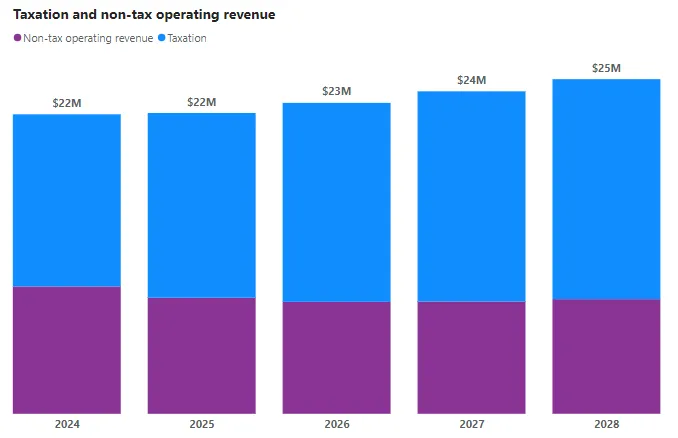
- Operating revenue (2024 total): $22 M (Decrease of $2.7 M)
- Non-tax operating revenue (2024 total): $9.3 M (Decrease of $4.0 M)
- Taxation (2024 total): $12.6 M (Increase of $1.3 M)
Page 47–66
Operating Revenue
- Sewer user fees increase (based on similar consumption)
- 2024: $11 (2%)
- 2024-2028: 2%-3% annual increase
- Garbage user fees increase
- 2024: $15 (6%)
- 2024-2028: 2-5% annual increase
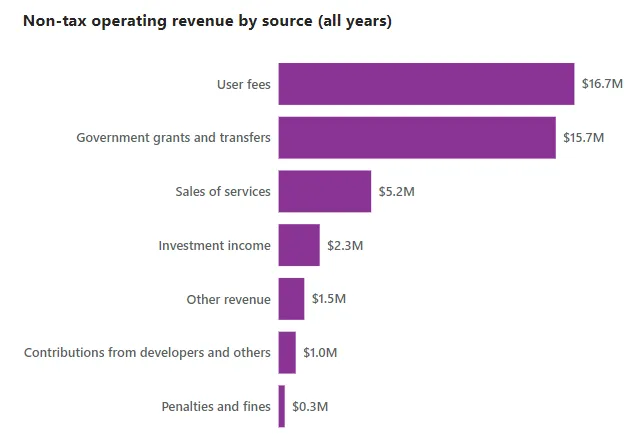
- Government grants and transfers (2024 total): $3.6 M (Decrease of $4.3 M)
Page 47–66
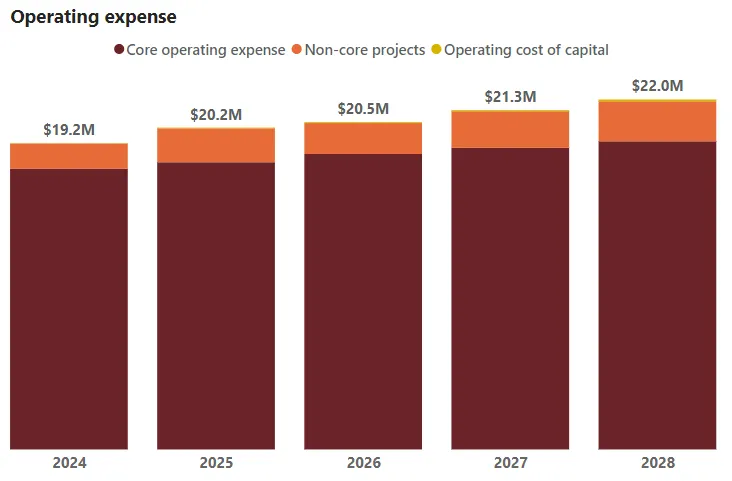
Operating Expense
- Non-core requests: $10.5 M (5-year total)
- Core operating expense: $18.5 M (Average annual)
- Total operating expense: $20.6 M (Average annual)
Page 47–66
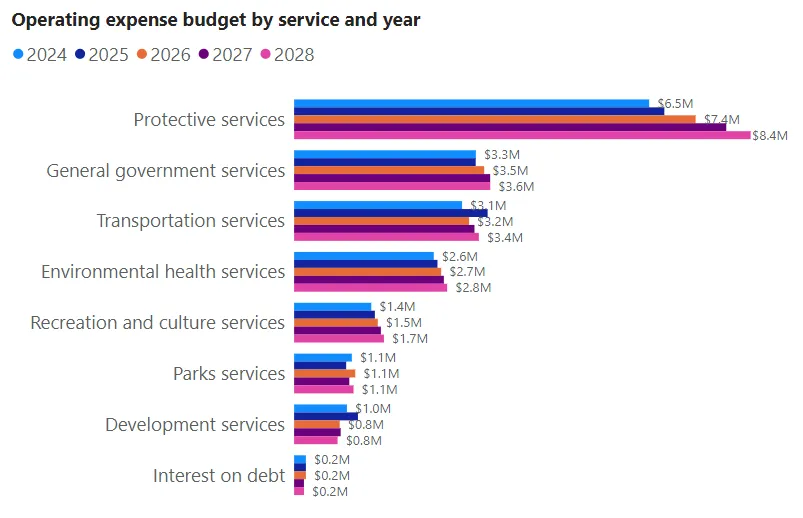
Operating Expense
Protective and Transportation Services account for 52% of the operating expense budget:
- Police: 18%
- Fire: 18%
- Transportation: 16%
Page 47–66
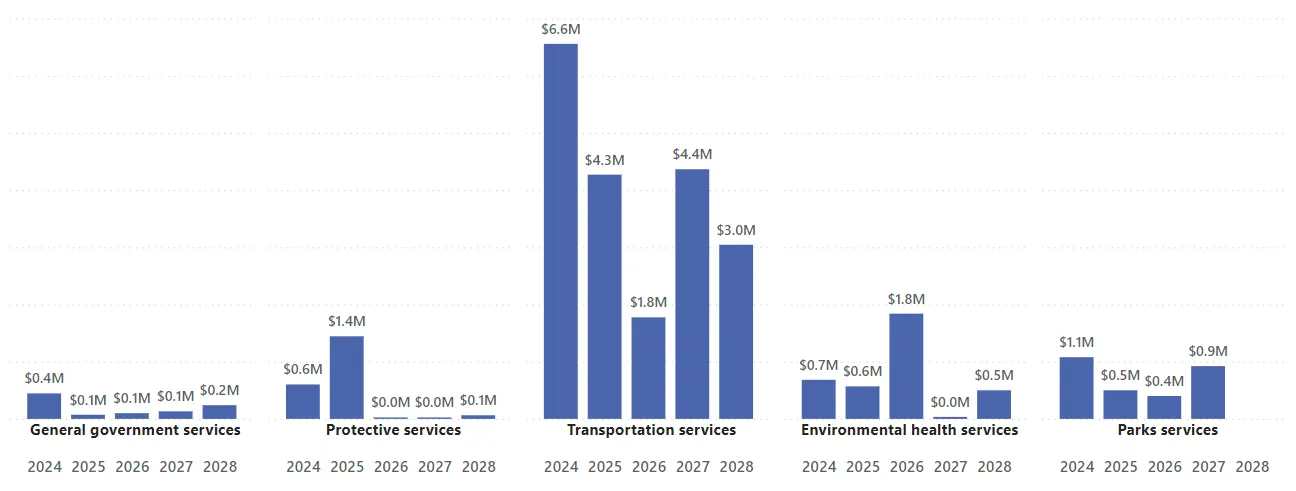
Capital Spending
- Capital investments: $29.7 M (5-year total)
Page 47–66
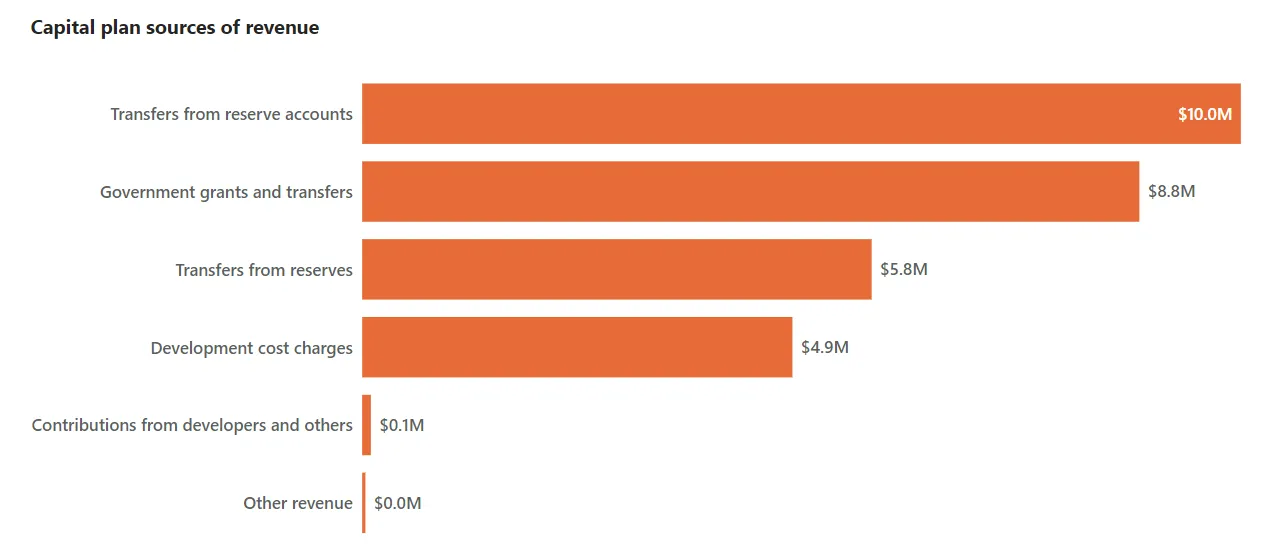
Capital Funding
- Total capital spending funded by Casino revenue and Community Works Fund: 34%
Page 47–66
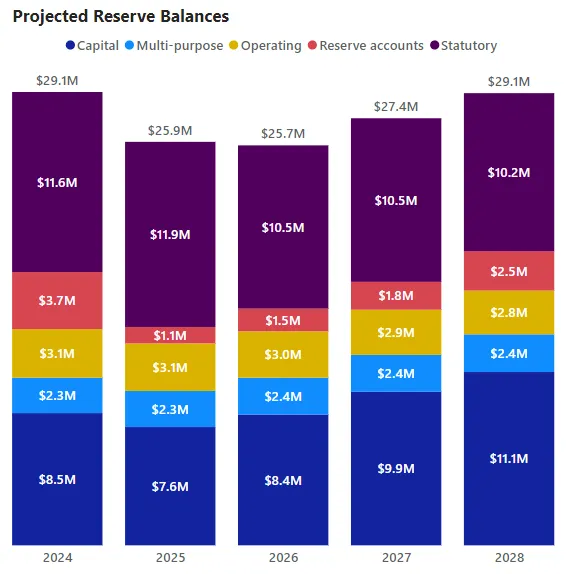
Reserves
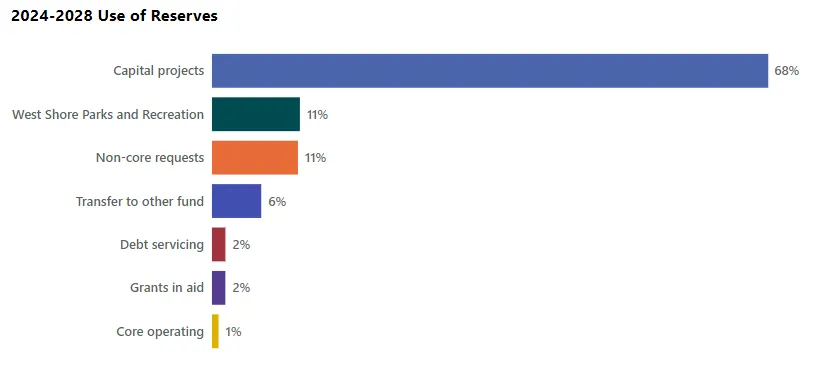
- Funding for capital: $20.7 M
- Funding for operations: $7.7 M
- 5-year net change: - $3.5 M
Page 47–66
Reserves
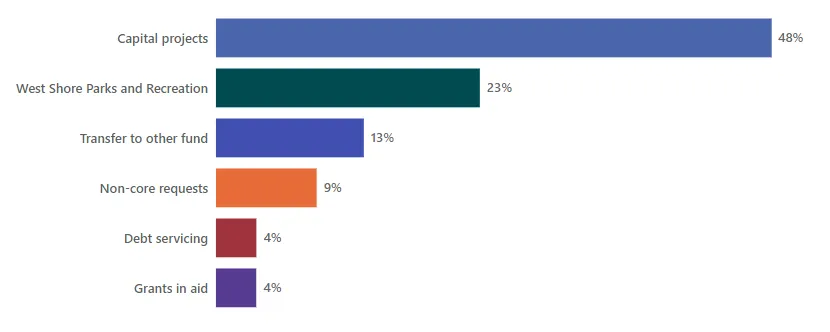
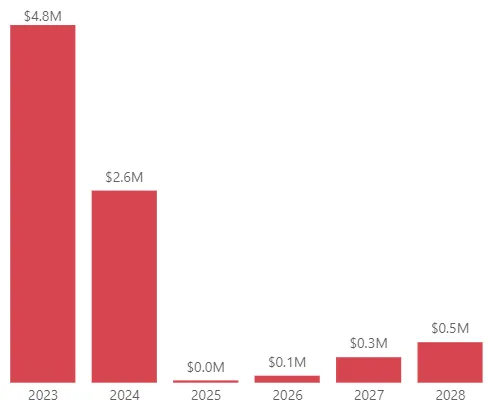
Use of Casino reserve
- 5-year net change: - $4.3 M
Page 47–66
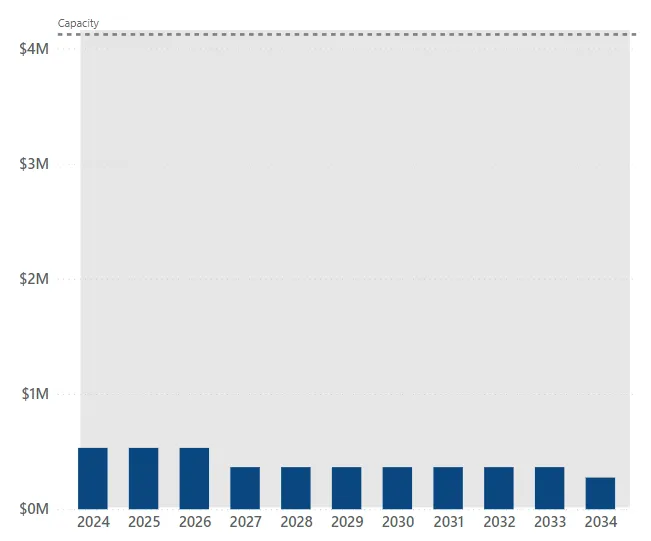
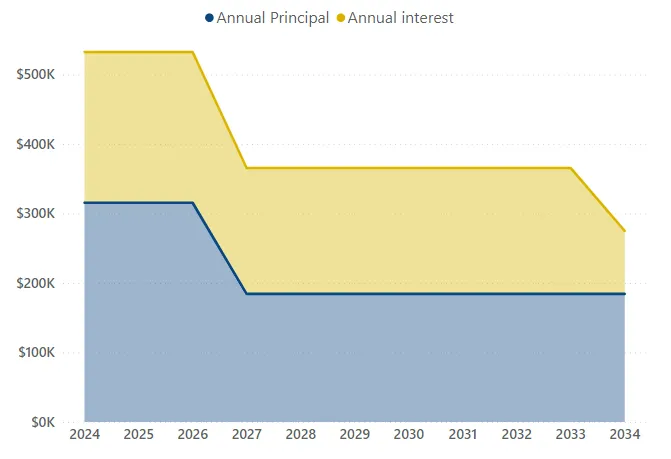
Debt
Debt service costs
Page 47–66
Summary – Implications for Taxpayers
| Category | Impact |
|---|---|
| Asset Management Strategy implications | |
| Contribution to capital reserves, funded by non-market change | 1.8% |
| Contribution to capital reserves, funded by prior year assessment base | 1.0% |
| Personnel | |
| Labour cost increases (salaries and benefits) | 4.0% |
| Personnel additions – police, fire, communications, development services | 3.3% |
| Transition West Shore Parks and Recreation funding | 0.5% |
| Operational cost of capital | 0.2% |
| All other net changes | 1.0% |
| Total 2024 tax increase, if financial plan approved as proposed | 11.8% |
Page 47–66
Summary – Implications for Taxpayers
11.8% total 2024 tax revenue increase, if financial plan approved as presented
The increase in assessments due to non-market change results in additional tax revenue of $199,400 or about a 1.8% tax increase.
Tax increase for prior year assessed properties is 10%
| Revenue Source | Tax Revenue | % Change |
|---|---|---|
| Tax revenue from prior year assessed properties | $12,220,106 | 10.0% |
| Tax revenue from non-market change | $ 199,400 | 1.8% |
| Total property tax revenue | $12,419,506 | 11.8% |
Page 47–66
Consolidated Financial Plan Highlights
As presented:
- 11.8% total tax revenue increase
- Average residential home in 2024 assessed at $1,060,954 would pay about $237 more
- Supports strategic initiatives and other non-core requests
- $1.6 million in 2024
- $10.5 million total over 5 years
- Invests in capital infrastructure renewal or acquisitions
- $9.4 million in 2024
- $29.7 million total over 5 years
- Applies financial sustainability principles and structural balance
- Begins to transition funding for West Shore Parks and Recreation service (2024)
- Begins funding for Sustainable Infrastructure Replacement Plan through Asset Management Strategy
Page 47–66
What’s next
Budget workshops
- Reserves and taxation
- Non-core projects
- Capital projects
- Service plans budgets
Page 47–66
Document Images
(1)
Extracted from: 2024 02 13 Committee of the Whole Agenda - Agenda - Pdf