TOWN OF VIEW ROYAL DRAFT 2024-2028 FINANCIAL PLAN - Reserve transfers
Presentation slides regarding reserve transfers and their implications for the five-year financial plan.
TOWN OF VIEW ROYAL DRAFT 2024-2028 FINANCIAL PLAN
February 5, 2024
Budget Workshops – Reserve transfers
Purpose
To provide Council with key considerations for reserve transfers for the draft 2024-2028 Financial Plan
Recap
- Financial plan orientation
- Financial plan highlights


Reserve transfers
- Asset Management Strategy implications
- Tax-funded reserve contributions
- Projected reserve balances
- Accumulated surplus
- Options
Schedule 4 Projected Reserve Balances page 43
Asset Management Strategy Implications
| Recommendation | 2024 | 2025 | 2026 | 2027 | 2028 |
|---|---|---|---|---|---|
| F.1 $500,000 of Casino revenue | $100 | $200 | $300 | $400 | $500 |
| F.2 Sewer utility user fees increase 5%/year | 2.5% $23 | 2.5% $23 | 5% $48 | 5% $51 | 5% $52 |
| F.3 1% tax increase | $111 | $124 | $133 | $144 | $152 |
| F.4 Retired debt servicing funding | $0 | $0 | $0 | $167 | $167 |
| F.5 Non-market change revenue | $199 | $0 | $0 | $0 | $0 |
| Total increase to capital reserve contributions | $433 | $347 | $481 | $762 | $871 |
(Draft 2024-2028 Financial Plan in $000s)
Asset Management Strategy Implications
Contributions from all sources
[Chart: Stacked area chart showing projected contributions to reserves from 2023 to 2028, including Status Quo: Capital Renewal, Status Quo: Sewer Capital, Casino revenue, 1% tax, NMC, Sewer fees, and Debt service]
Gradual increase in annual reserve contributions from sources recommended by Asset Management Strategy
- 2023: $289,500
- 2028: $1,197,000
Tax-funded reserve contributions
Capital reserves
(Draft 2024-2028 Financial Plan in $000s)
| Capital reserves | 2023 | 2024 | 2025-2028 |
|---|---|---|---|
| Capital Works and Land | $0 | $61 | + 2% / year |
| Capital Renewal | $200 | $210 | + 2% / year |
| Park Improvement | $105 | $128 | + 2% / year |
| Machinery and Equipment | $64 | $64 | No change |
| Fire Department Equipment | $32 | $56 | No change |
| Total | $401 | $519 | $2,154 |
| Total increase to taxation | $118 | $552 |
Schedule 4 Projected Reserve Balances page 43
Tax-funded reserve contributions
Operating reserves
(Draft 2024-2028 Financial Plan in $000s)
| Operating reserves | 2023 | 2024 | 2025-2028 |
|---|---|---|---|
| Future Expenditures | $100 | $104 | + 2% / year |
| Police Operating* | $100 | $217 | $17/year |
| Total | $200 | $321 | $505 |
| Total increase to taxation | $121 | $-295* |
*Actual contributions are based on the greater of the budgeted amount OR policing net tax surplus at end of each year
Schedule 4 Projected Reserve Balances page 44
Projected Reserve Balances
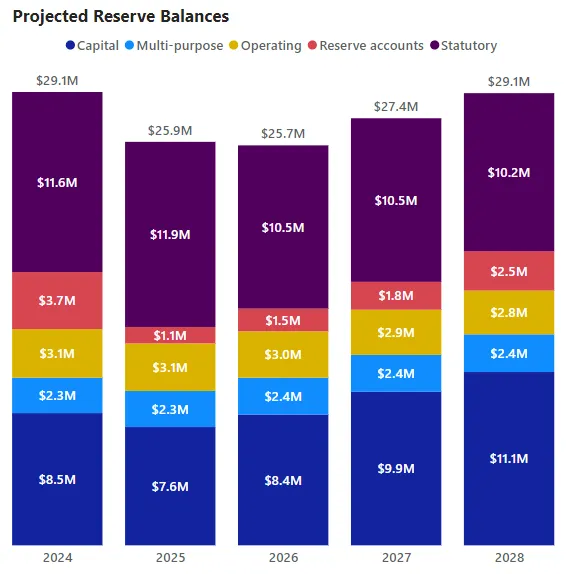
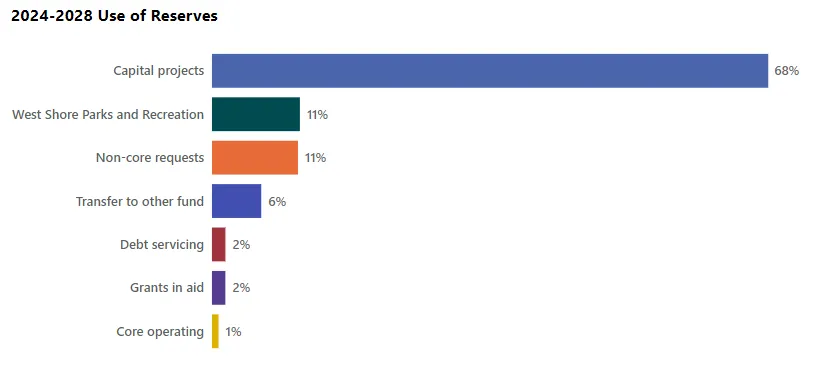
- Funding for capital: $20.7 M
- Funding for operations: $7.7 M
- 5-year net change: - $3.5 M
Page 43 Schedule 4 Projected Reserve Balances
Financial sustainability
2018-2028 Actual and Projected Taxation/User Fees and Operating Expense
[Chart: Line graph comparing Actual and Forecast Operating Expense against Taxation/User Fees from 2018 to 2028, indicating structural balance]
Structural balance is indicated where recurring revenue (taxation and user fees) is used to fund recurring costs (operating expense)
Financial sustainability
How much surplus do we have? How much do we need?
Accumulated Surplus
[Chart: Graph showing the Actual and Projected Accumulated Surplus from 2018 to 2028, plotted within a shaded range between "Low" and "High" requirements]
Options
| Decision | Amount (Tax %) | Implications |
|---|---|---|
| Defer transition to taxation for WSPR | $55,500 (0.5%) | Increases draw from Casino reserve; may need to defer projects depending on Casino reserve |
| Reduce tax-funded reserve contributions | Any amount $111,000 = 1% | Future projects depending on reserve funding may need to be deferred or cancelled; Not sustainable; increases future volatility in taxation |
| Increase use of accumulated surplus | Any amount $111,000 = 1% | Not sustainable; increases future volatility in taxation |
| Reduce services or service level | Any amount $111,000 = 1% | Degradation or elimination of desired service or service level |
Summary – Implications for Taxpayers
11.8% total 2024 tax revenue increase, if financial plan approved as presented
The increase in assessments due to non-market change results in additional tax revenue of $199,400 or about a 1.8% tax increase.
Tax increase for prior year assessed properties is 10%
| Tax Revenue | % Change | |
|---|---|---|
| Tax revenue from prior year assessed properties | $12,220,106 | 10.0% |
| Tax revenue from non-market change | $ 199,400 | 1.8% |
| Total property tax revenue | $12,419,506 | 11.8% |
Summary – Implications for Taxpayers
Asset Management Strategy implications
- Contribution to capital reserves, funded by non-market change: 1.8%
- Contribution to capital reserves, funded by prior year assessment base: 1.0%
Personnel
Labour cost increases (salaries and benefits): 4.0%
Personnel additions – police, fire, communications, development services: 3.3%
Transition West Shore Parks and Recreation funding: 0.5%
Operational cost of capital: 0.2%
All other net changes: 1.0%
Total 2024 tax increase, if financial plan approved as proposed: 11.8%
What’s next
Budget workshops, starting tomorrow, 6 pm
- Non-core projects
- Capital projects
- Service plans budgets
Document Images
(2)