Presentation
Tax Rate Options Presentation
April 12, 2022Pages 150–1628 sections
A slide deck for the April 12, 2022 Committee of the Whole meeting regarding property assessments and tax rate choices.
Date: April 12, 2022Average residential assessment in View Royal is $930,80060% of taxable properties are assessed below the average valueBusiness/Other (Class 6) count: 122 properties
Tax Rate Options
April 12, 2022 Committee of the Whole

Page 150–162
Overview
- Property taxes 101
- Property assessments context
- Regional context
- Scenario description
- Scenario results
- Choices
Page 150–162
Property taxes 101
- Property assessments
- Average or representative property
- Tax burden
- Tax revenue requirement
- Tax ratios (multiples)

Page 150–162
Property assessments context
| Property Class | 2022 Count | 2021 Average Assessment | 2022 Average Assessment | $ Chg | % Chg |
|---|---|---|---|---|---|
| Single Family | 2,410 | $808,485 | $1,034,399 | $225,914 | 28% |
| Strata | 1,366 | $497,900 | $582,965 | $85,065 | 17% |
| Vacant, ALR, Farm, other | 110 | $2,668,986 | $2,980,389 | $311,403 | 12% |
| Total residential | 3,886 | $753,425 | $930,796 | $177,371 | 24% |
Page 150–162
Property assessments context
Count of residential properties with assessed value between $1 and $2,200,000
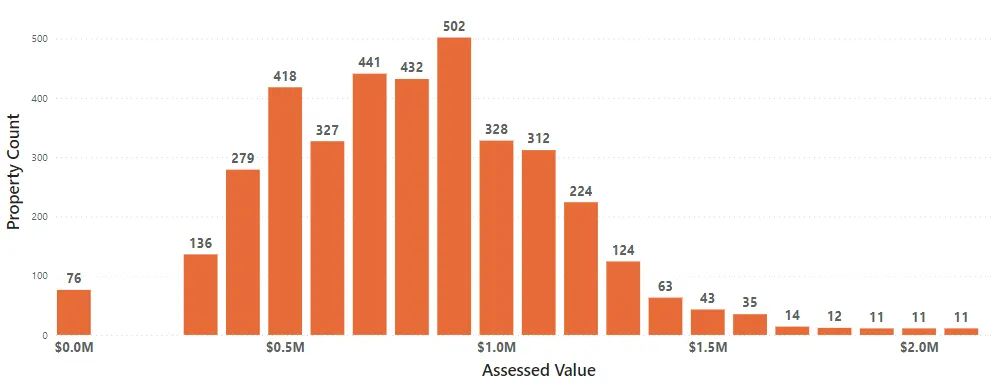
- Average residential assessment $930,800
- 60% of taxable properties are assessed below the average
- 40% of taxable properties are assessed above the average
Page 150–162
Property assessments context
| Property Class | 2022 Count | 2021 Average Assessment | 2022 Average Assessment | $ Chg | % Chg |
|---|---|---|---|---|---|
| Business/other | 122 | $2,431,552 | $2,570,405 | $138,853 | 6% |
Count of business/other (Class 6) properties with assessed value between $1 and $4,000,000
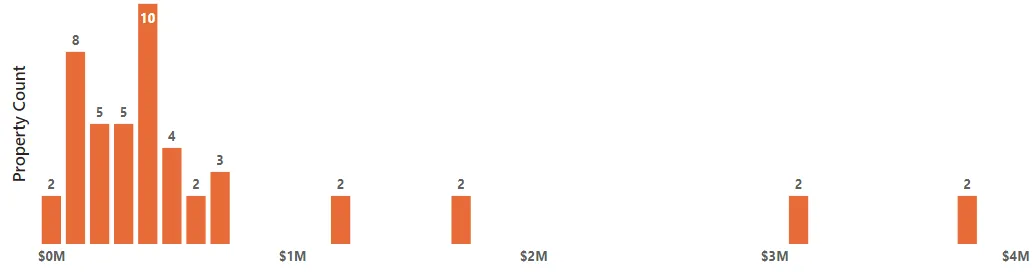
- 52% properties with assessed value less than $800,000
Page 150–162
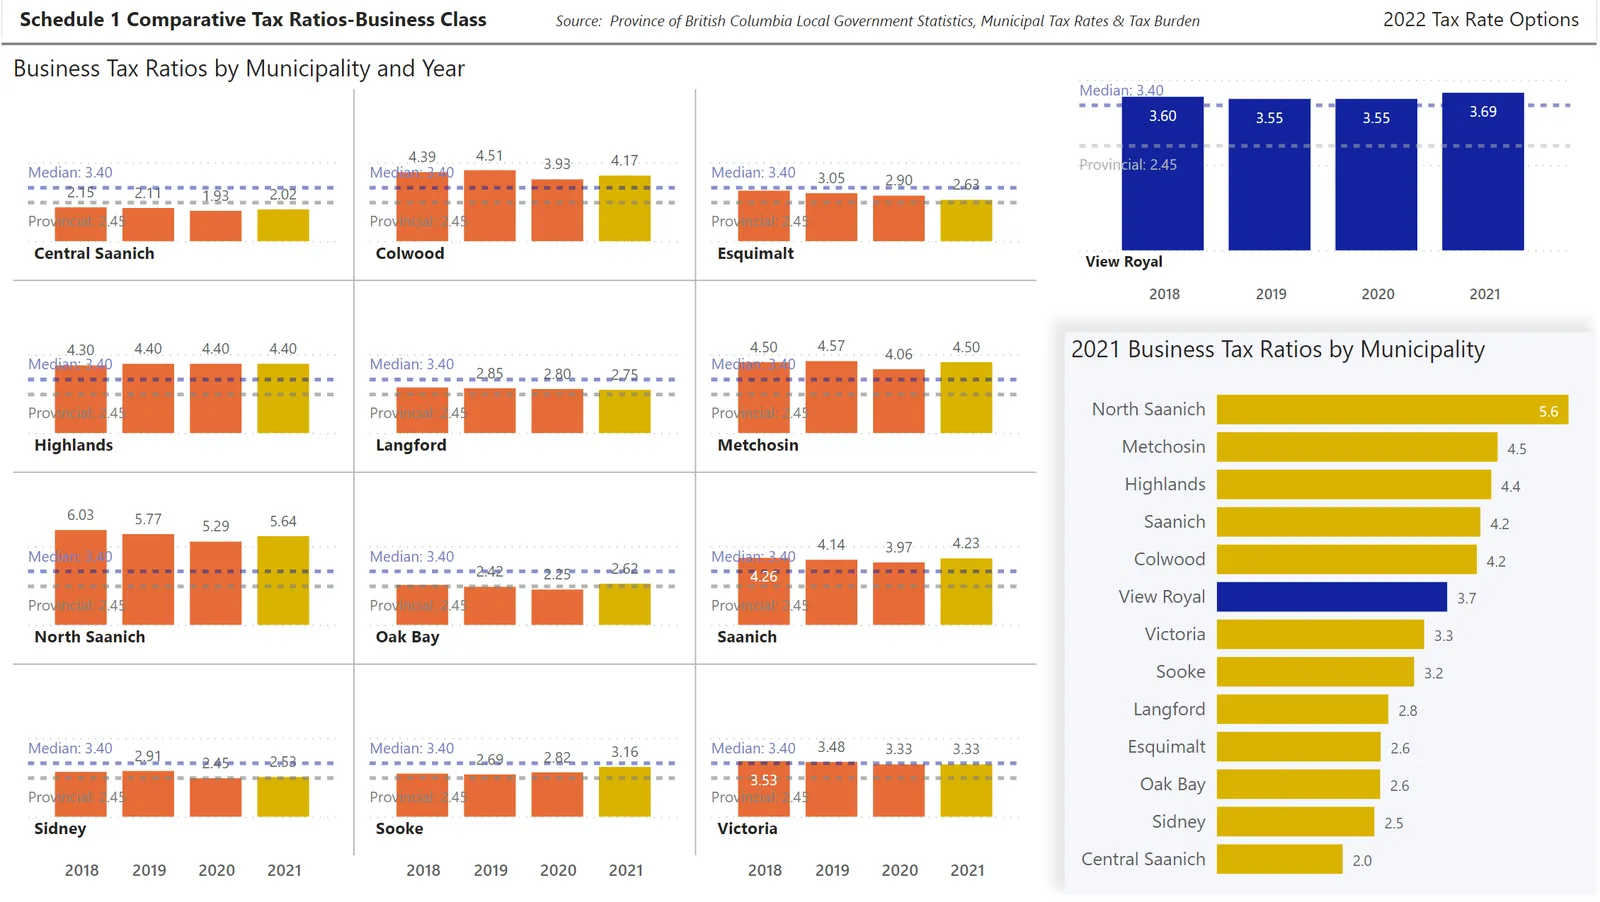
Regional context
Schedule 1 Comparative Tax Ratios-Business Class
Source: Province of British Columbia Local Government Statistics, Municipal Tax Rates & Tax Burden 2022 Tax Rate Options
Page 150–162
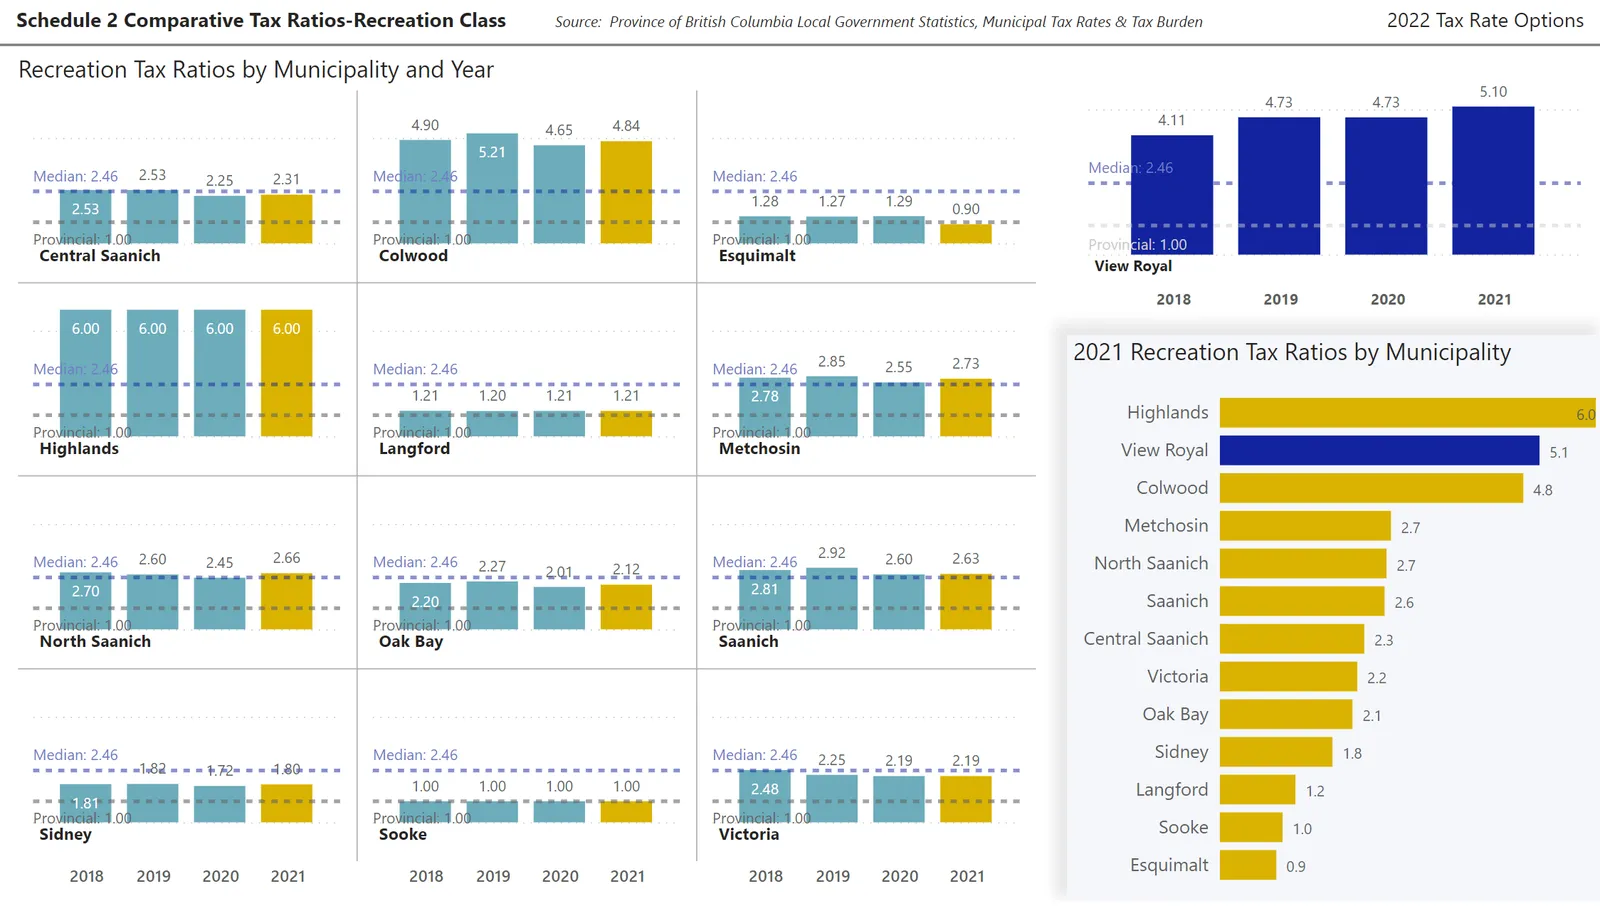
Regional context
Schedule 2 Comparative Tax Ratios-Recreation Class
Source: Province of British Columbia Local Government Statistics, Municipal Tax Rates & Tax Burden 2022 Tax Rate Options
Page 150–162
Extracted from: 2022 04 12 Committee of the Whole Agenda - Agenda - Pdf